OPEN-SOURCE SCRIPT
ha macd nemesis
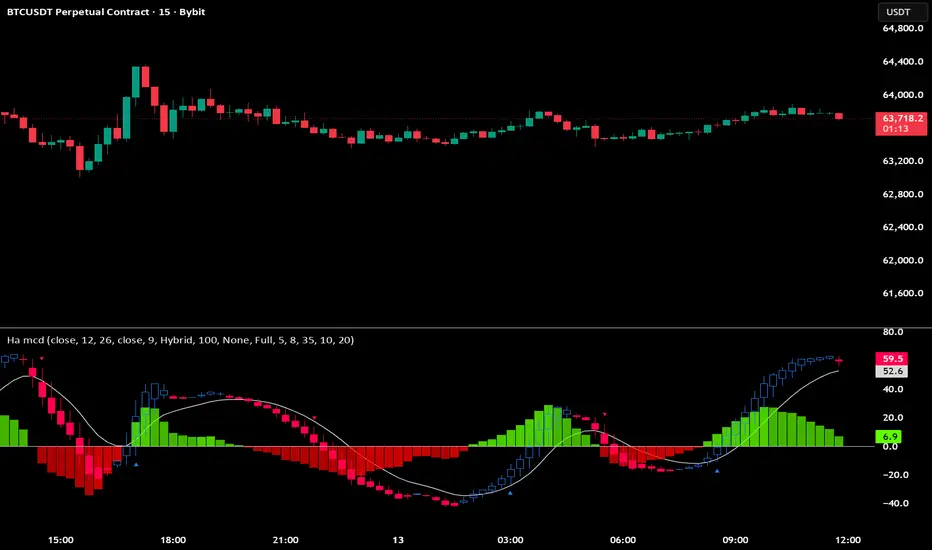
HA Nemesis is a Heikin Ashi based MACD oscillator designed to make momentum shifts easier to read in a separate pane.
Instead of plotting a classic MACD only as two lines and a histogram, this script rebuilds the MACD movement into synthetic Heikin Ashi candles. The goal is to give a cleaner visual view of momentum direction, candle pressure, signal-line interaction, and possible exhaustion areas.
The indicator includes three display modes:
* Hybrid: shows the Heikin Ashi MACD candles with the histogram.
* MACD: focuses on the candle-style MACD structure.
* Histogram: focuses mainly on histogram expansion and contraction.
The blue candles represent bullish momentum pressure. The red candles represent bearish momentum pressure. The signal line can be used as a reference for momentum confirmation. When the Heikin Ashi MACD closes above the signal line, bullish pressure is improving. When it closes below the signal line, bearish pressure is increasing.
The upper red background bands mark extended bullish momentum areas where upside pressure may be stretched. The lower blue background bands mark extended bearish momentum areas where downside pressure may be stretched. These zones are not automatic reversal signals. They are visual areas where traders can watch for reaction, slowdown, or continuation.
The script also includes optional bar coloring modes:
* MidLine: colors bars based on whether the oscillator is above or below zero.
* Candles: colors bars based on the Heikin Ashi MACD candle direction.
* Signal Cross: colors bars based on the relationship between the HA MACD close and the signal line.
* Extremities: highlights potential extended momentum conditions.
Alerts are built around two main ideas:
1. Heikin Ashi MACD crossing the signal EMA.
2. Heikin Ashi MACD candle color changing from bearish to bullish or bullish to bearish.
To reduce weak signals, the alert module uses candle filters. It can ignore small, weak, or doji-like HA MACD candles. If tracking is enabled, a raw signal can remain pending until a valid candle confirms the move, instead of firing immediately on a weak candle.
Beginner example 1:
The oscillator has been red and below the signal line. A blue Heikin Ashi MACD candle appears and closes above the signal line. If the candle passes the body and range filters, the alert can mark a bullish momentum shift. A beginner can then check whether price is also reclaiming a support level, breaking a local structure, or moving with trend confirmation.
Beginner example 2:
The oscillator has been blue and above the signal line. A red Heikin Ashi MACD candle appears and closes below the signal line. If the move is confirmed by a valid candle, it can warn that bullish momentum is fading. This can help traders avoid late long entries or watch for a possible pullback.
Beginner example 3:
The oscillator reaches the upper red band and then starts printing weaker blue candles or flips red. This can suggest that upside momentum is losing strength. It does not mean price must reverse, but it gives a useful warning to slow down and check resistance, volume, and price structure.
Beginner example 4:
The oscillator reaches the lower blue band and then starts printing stronger blue candles or crosses above the signal line. This can suggest that downside pressure is weakening. It is usually safer to wait for price confirmation rather than entering only because the oscillator is in an extreme zone.
Suggested use:
HA Nemesis is best used as a momentum-reading tool. It can help identify when pressure is shifting, when momentum is stretched, and when a cleaner candle-based confirmation appears. It works well alongside support and resistance, trend direction, volume, or a higher-timeframe bias.
Useful settings:
* Use Hybrid mode for the most complete visual read.
* Use Histogram mode when you want a cleaner momentum-only view.
* Keep the weak candle filter enabled if you want fewer low-quality alerts.
* Increase the minimum body or range values to make alerts more selective.
* Use bar coloring only if you want the oscillator state reflected directly on price bars.
Limitations:
This indicator does not predict future price movement. Strong trends can remain extended for a long time, and crosses can fail during choppy markets. Alerts should be treated as momentum events, not as guaranteed buy or sell signals. Always combine the indicator with price action and proper risk management.
Instead of plotting a classic MACD only as two lines and a histogram, this script rebuilds the MACD movement into synthetic Heikin Ashi candles. The goal is to give a cleaner visual view of momentum direction, candle pressure, signal-line interaction, and possible exhaustion areas.
The indicator includes three display modes:
* Hybrid: shows the Heikin Ashi MACD candles with the histogram.
* MACD: focuses on the candle-style MACD structure.
* Histogram: focuses mainly on histogram expansion and contraction.
The blue candles represent bullish momentum pressure. The red candles represent bearish momentum pressure. The signal line can be used as a reference for momentum confirmation. When the Heikin Ashi MACD closes above the signal line, bullish pressure is improving. When it closes below the signal line, bearish pressure is increasing.
The upper red background bands mark extended bullish momentum areas where upside pressure may be stretched. The lower blue background bands mark extended bearish momentum areas where downside pressure may be stretched. These zones are not automatic reversal signals. They are visual areas where traders can watch for reaction, slowdown, or continuation.
The script also includes optional bar coloring modes:
* MidLine: colors bars based on whether the oscillator is above or below zero.
* Candles: colors bars based on the Heikin Ashi MACD candle direction.
* Signal Cross: colors bars based on the relationship between the HA MACD close and the signal line.
* Extremities: highlights potential extended momentum conditions.
Alerts are built around two main ideas:
1. Heikin Ashi MACD crossing the signal EMA.
2. Heikin Ashi MACD candle color changing from bearish to bullish or bullish to bearish.
To reduce weak signals, the alert module uses candle filters. It can ignore small, weak, or doji-like HA MACD candles. If tracking is enabled, a raw signal can remain pending until a valid candle confirms the move, instead of firing immediately on a weak candle.
Beginner example 1:
The oscillator has been red and below the signal line. A blue Heikin Ashi MACD candle appears and closes above the signal line. If the candle passes the body and range filters, the alert can mark a bullish momentum shift. A beginner can then check whether price is also reclaiming a support level, breaking a local structure, or moving with trend confirmation.
Beginner example 2:
The oscillator has been blue and above the signal line. A red Heikin Ashi MACD candle appears and closes below the signal line. If the move is confirmed by a valid candle, it can warn that bullish momentum is fading. This can help traders avoid late long entries or watch for a possible pullback.
Beginner example 3:
The oscillator reaches the upper red band and then starts printing weaker blue candles or flips red. This can suggest that upside momentum is losing strength. It does not mean price must reverse, but it gives a useful warning to slow down and check resistance, volume, and price structure.
Beginner example 4:
The oscillator reaches the lower blue band and then starts printing stronger blue candles or crosses above the signal line. This can suggest that downside pressure is weakening. It is usually safer to wait for price confirmation rather than entering only because the oscillator is in an extreme zone.
Suggested use:
HA Nemesis is best used as a momentum-reading tool. It can help identify when pressure is shifting, when momentum is stretched, and when a cleaner candle-based confirmation appears. It works well alongside support and resistance, trend direction, volume, or a higher-timeframe bias.
Useful settings:
* Use Hybrid mode for the most complete visual read.
* Use Histogram mode when you want a cleaner momentum-only view.
* Keep the weak candle filter enabled if you want fewer low-quality alerts.
* Increase the minimum body or range values to make alerts more selective.
* Use bar coloring only if you want the oscillator state reflected directly on price bars.
Limitations:
This indicator does not predict future price movement. Strong trends can remain extended for a long time, and crosses can fail during choppy markets. Alerts should be treated as momentum events, not as guaranteed buy or sell signals. Always combine the indicator with price action and proper risk management.
סקריפט קוד פתוח
ברוח האמיתית של TradingView, יוצר הסקריפט הזה הפך אותו לקוד פתוח, כך שסוחרים יוכלו לעיין בו ולאמת את פעולתו. כל הכבוד למחבר! אמנם ניתן להשתמש בו בחינם, אך זכור כי פרסום חוזר של הקוד כפוף ל־כללי הבית שלנו.

Light the candle that sleeps within you.
כתב ויתור
המידע והפרסומים אינם מיועדים להיות, ואינם מהווים, ייעוץ או המלצה פיננסית, השקעתית, מסחרית או מכל סוג אחר המסופקת או מאושרת על ידי TradingView. קרא עוד ב־תנאי השימוש.
סקריפט קוד פתוח
ברוח האמיתית של TradingView, יוצר הסקריפט הזה הפך אותו לקוד פתוח, כך שסוחרים יוכלו לעיין בו ולאמת את פעולתו. כל הכבוד למחבר! אמנם ניתן להשתמש בו בחינם, אך זכור כי פרסום חוזר של הקוד כפוף ל־כללי הבית שלנו.
Light the candle that sleeps within you.
כתב ויתור
המידע והפרסומים אינם מיועדים להיות, ואינם מהווים, ייעוץ או המלצה פיננסית, השקעתית, מסחרית או מכל סוג אחר המסופקת או מאושרת על ידי TradingView. קרא עוד ב־תנאי השימוש.