MHIDa Crest Volume-Climax Detector
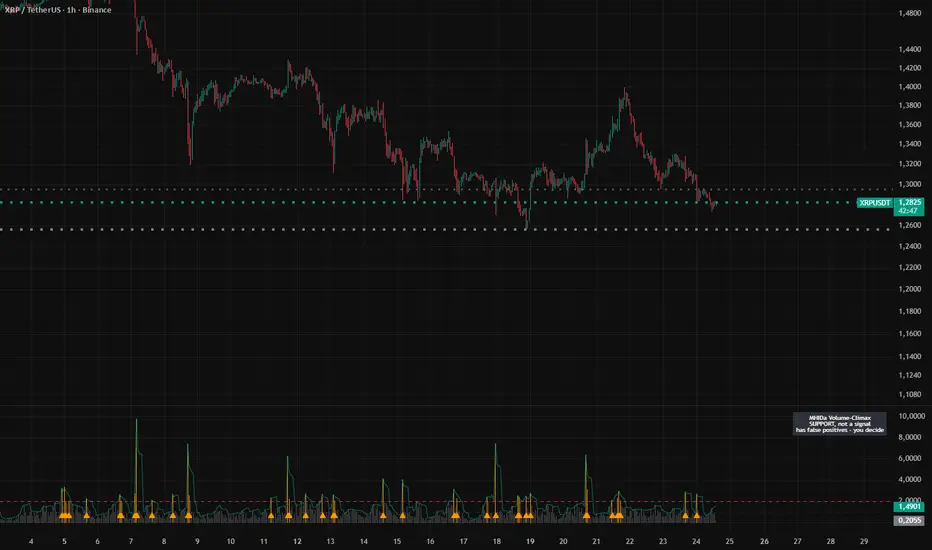
MHIDa Crest Volume-Climax Detector
WHAT IT DOES
This indicator measures the volume climax: how far the volume of the current bar (and, optionally, the highest volume of the last few bars) sits above its recent average. Volume spikes often show up around local tops, when a move becomes exhausted, so this is a context tool to help you read a possible crest. It does not place orders and it is not a trading signal or financial advice.
HOW IT IS CALCULATED
- Average volume = simple moving average of the previous N bars (default 20), excluding the current bar.
- Volume / average = current volume divided by that average. It is drawn as columns; the columns turn orange when the ratio is at or above the climax threshold.
- Peak / average = the highest volume over the last M bars (default 5) divided by the same average. It is drawn as a teal line and can be switched off.
- A dashed red line marks the climax threshold (default 2.0) and a dotted gray line marks 1.0 (volume equal to its average).
- A small orange triangle at the bottom of the pane marks the bars where the ratio crosses the threshold. Markers are drawn only on standard chart types.
- Everything uses closed bars up to the current one only: there is no look-ahead.
WHY THESE PARTS ARE TOGETHER
The single-bar ratio shows an instant spike. The recent-peak line keeps the memory of a spike for a few bars, so you can still see that a climax happened just before the current bar. Both use the same average so they are directly comparable.
HOW TO USE
The threshold and the lookbacks are starting points, not proven winning values. When you spot a possible top on the chart, look at this pane: a climax firing there is one more element for your own judgment, never the judgment itself. Raise the threshold to be more selective.
LIMITS (PLEASE READ)
This is a detector with false positives: breakouts, news, session opens and thin liquidity also spike volume, and many spikes are not tops. On its own it is not enough; combine it with structure, levels and context. No performance is promised.
INPUTS
Volume average lookback (bars), Climax threshold (volume / average), Recent peak window (bars), Also show climax on recent peak.
An alert condition is available for the bar on which the climax fires.
WHAT IT DOES
This indicator measures the volume climax: how far the volume of the current bar (and, optionally, the highest volume of the last few bars) sits above its recent average. Volume spikes often show up around local tops, when a move becomes exhausted, so this is a context tool to help you read a possible crest. It does not place orders and it is not a trading signal or financial advice.
HOW IT IS CALCULATED
- Average volume = simple moving average of the previous N bars (default 20), excluding the current bar.
- Volume / average = current volume divided by that average. It is drawn as columns; the columns turn orange when the ratio is at or above the climax threshold.
- Peak / average = the highest volume over the last M bars (default 5) divided by the same average. It is drawn as a teal line and can be switched off.
- A dashed red line marks the climax threshold (default 2.0) and a dotted gray line marks 1.0 (volume equal to its average).
- A small orange triangle at the bottom of the pane marks the bars where the ratio crosses the threshold. Markers are drawn only on standard chart types.
- Everything uses closed bars up to the current one only: there is no look-ahead.
WHY THESE PARTS ARE TOGETHER
The single-bar ratio shows an instant spike. The recent-peak line keeps the memory of a spike for a few bars, so you can still see that a climax happened just before the current bar. Both use the same average so they are directly comparable.
HOW TO USE
The threshold and the lookbacks are starting points, not proven winning values. When you spot a possible top on the chart, look at this pane: a climax firing there is one more element for your own judgment, never the judgment itself. Raise the threshold to be more selective.
LIMITS (PLEASE READ)
This is a detector with false positives: breakouts, news, session opens and thin liquidity also spike volume, and many spikes are not tops. On its own it is not enough; combine it with structure, levels and context. No performance is promised.
INPUTS
Volume average lookback (bars), Climax threshold (volume / average), Recent peak window (bars), Also show climax on recent peak.
An alert condition is available for the bar on which the climax fires.

כתב ויתור
המידע והפרסומים אינם מיועדים להיות, ואינם מהווים, ייעוץ או המלצה פיננסית, השקעתית, מסחרית או מכל סוג אחר המסופקת או מאושרת על ידי TradingView. קרא עוד ב־תנאי השימוש.
כתב ויתור
המידע והפרסומים אינם מיועדים להיות, ואינם מהווים, ייעוץ או המלצה פיננסית, השקעתית, מסחרית או מכל סוג אחר המסופקת או מאושרת על ידי TradingView. קרא עוד ב־תנאי השימוש.