OPEN-SOURCE SCRIPT
Fibonacci EMA RSI Engine [StrixEDGE]
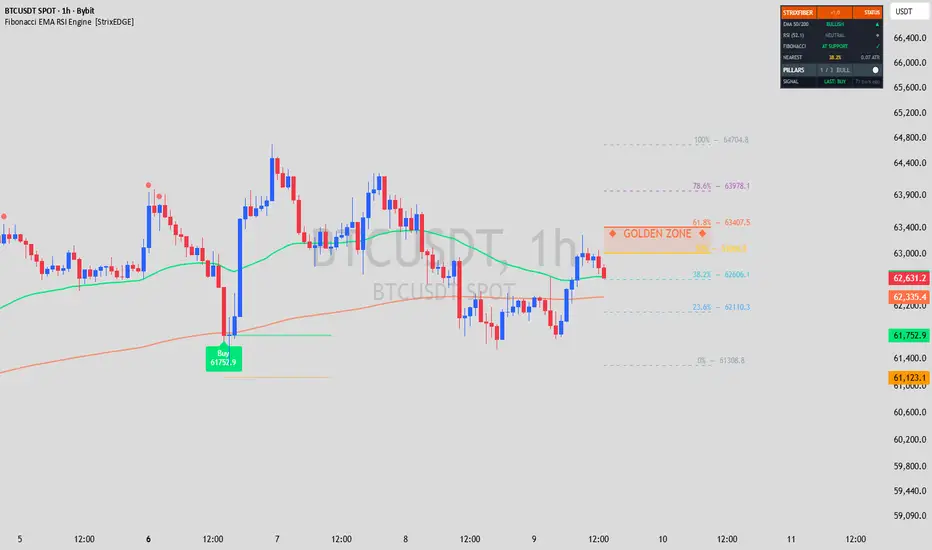
StrixFIBER is a three-pillar confluence indicator that combines automatic Fibonacci retracement levels, EMA 50/200 trend structure, and RSI overbought/oversold detection into a single chart overlay. Signals fire only when multiple pillars confirm the same direction, with separate labels for standard and strong (all-three) confluence.
━━━━━━━━━━━━━━━━━━━━━━━━━━━━━━━━━━
🔶 THE THREE PILLARS
PILLAR 1 — AUTO FIBONACCI
The indicator automatically calculates Fibonacci retracement levels (0%, 23.6%, 38.2%, 50%, 61.8%, 78.6%, 100%) from the highest high and lowest low over a configurable lookback period. All seven levels are plotted on the chart with price labels at the right edge.

The 50%–61.8% range is highlighted as the "Golden Zone" — the area where price most commonly finds support or resistance during healthy retracements. When price is within ATR proximity of a key Fibonacci level, the indicator scores it as "at support" or "at resistance" depending on price position relative to the 50% midpoint.

PILLAR 2 — EMA 50 / 200
The classic dual exponential moving average system. EMA 50 is colored green when above EMA 200 (bullish structure) and red when below (bearish structure). Golden Cross (EMA 50 crossing above EMA 200) and Death Cross (EMA 50 crossing below EMA 200) events are marked with diamond shapes on the chart.

The EMA pillar provides the trend context. Fibonacci support levels are more meaningful in a bullish EMA structure; resistance levels are more meaningful in a bearish structure.
PILLAR 3 — RSI OVERBOUGHT / OVERSOLD
RSI is calculated at a configurable length (default 14) with configurable OB/OS thresholds (default 70/30). The RSI line itself is not plotted (this is an overlay indicator), but OB and OS entries are marked as small colored circles above and below price bars.
OVERBOUGHT

OVERSOLD

The RSI pillar fires a bullish score when RSI recovers from oversold (crosses back above the OS threshold) and a bearish score when RSI drops from overbought (crosses back below the OB threshold). This captures the reversal moment, not just the extreme reading.
━━━━━━━━━━━━━━━━━━━━━━━━━━━━━━━━━━
🔶 CONFLUENCE LOGIC
Each pillar scores +1 (bullish), −1 (bearish), or 0 (neutral) independently. The scores are aggregated:
→ 3/3 Pillars = "Strong Buy" or "Strong Sell" — all three pillars fully aligned. Highest conviction.
BUY -
SELL -
→ 2/3 Pillars = "Buy" or "Sell" — two of three pillars agree. Standard conviction.
→ 1/3 Pillars = No signal by default (configurable).
The minimum number of pillars required for a signal is adjustable (1, 2, or 3). Default is 2.
Additional signal filtering:
→ Flip-Only Logic: After a Buy, the next signal must be a Sell (and vice versa). No consecutive same-direction signals.
→ Cooldown: Configurable minimum bars between signals (default 10).
━━━━━━━━━━━━━━━━━━━━━━━━━━━━━━━━━━
🔶 VISUAL FEATURES
Fibonacci Levels
→ All 7 standard levels plotted as colored lines (thicker for 50% and 61.8%)
→ Golden Zone (50–61.8%) highlighted with a translucent fill
→ Price labels at the right edge of each level showing the exact price value
EMA System
→ EMA 50 colored by trend direction (green above EMA 200, red below)
→ EMA 200 as a steady reference line
→ Golden Cross (GC) and Death Cross (DC) diamond markers
RSI Markers
→ Small green circles below bars when RSI enters oversold
→ Small red circles above bars when RSI enters overbought
→ RSI value displayed in the dashboard (not as a separate pane line)
Signals
→ Buy / Sell labels with exact entry price
→ "Strong Buy" / "Strong Sell" labels when all 3 pillars align (darker color for distinction)
→ Entry price horizontal line persists for 20 bars
→ ATR-based stop-loss level plotted below/above entry
Dashboard
→ EMA trend status with direction
→ RSI current value and zone (Overbought / Oversold / Neutral)
→ Fibonacci proximity status (At Support / At Resistance / Between)
→ Nearest Fibonacci level with distance in ATR units
→ Pillar confluence count and direction
→ Last signal direction and age (bars ago)
━━━━━━━━━━━━━━━━━━━━━━━━━━━━━━━━━━
🔶 SETTINGS GUIDE
Fibonacci
• Lookback Period (default 120) — Bars used for highest high / lowest low. Increase for wider retracement levels, decrease for tighter ones.
• Fibonacci Proximity (default 0.5 ATR) — How close price must be to a level to count as "at support/resistance." Lower = stricter.
EMA
• Fast EMA (default 50) — The responsive trend line.
• Slow EMA (default 200) — The structural trend anchor.
RSI
• Length (default 14) — Standard RSI lookback.
• Overbought (default 70) / Oversold (default 30) — Zone thresholds.
Signals
• Minimum Pillars (default 2) — Set to 3 for highest quality signals only.
• Cooldown (default 10 bars) — Minimum spacing between signals.
━━━━━━━━━━━━━━━━━━━━━━━━━━━━━━━━━━
🔶 WHAT MAKES THIS ORIGINAL
While Fibonacci, EMA, and RSI are individually common, StrixFIBER integrates them through a structured pillar scoring system with proximity-based Fibonacci detection, RSI recovery signals (not raw readings), and automatic signal strength classification. The confluence layer evaluates whether a Fibonacci level is meaningful (is the EMA structure supporting it? is momentum confirming it?) rather than displaying the three tools independently. The ATR-based proximity detection for Fibonacci levels, combined with the transition-based RSI scoring and flip-only signal enforcement, creates a framework that is more than the sum of its parts.
━━━━━━━━━━━━━━━━━━━━━━━━━━━━━━━━━━
🔶 RECOMMENDED USE
Designed for day trading on 15-minute to 1-hour charts across all markets: crypto, forex, stocks, indices, and commodities. Works well alongside StrixEDGE (trend confluence overlay) and StrixPULSE (pressure spectrum in a separate pane) for a complete multi-indicator setup.
━━━━━━━━━━━━━━━━━━━━━━━━━━━━━━━━━━
⚠️ DISCLAIMER
This indicator is a technical analysis tool, not financial advice. No indicator guarantees profitable outcomes. Past performance of any signal does not indicate future results. Always apply proper risk management and use this tool as one component of a complete trading plan.
━━━━━━━━━━━━━━━━━━━━━━━━━━━━━━━━━━
5 alert conditions: Buy Signal, Sell Signal, Any Signal, Golden Cross, Death Cross.
━━━━━━━━━━━━━━━━━━━━━━━━━━━━━━━━━━
🔶 THE THREE PILLARS
PILLAR 1 — AUTO FIBONACCI
The indicator automatically calculates Fibonacci retracement levels (0%, 23.6%, 38.2%, 50%, 61.8%, 78.6%, 100%) from the highest high and lowest low over a configurable lookback period. All seven levels are plotted on the chart with price labels at the right edge.
The 50%–61.8% range is highlighted as the "Golden Zone" — the area where price most commonly finds support or resistance during healthy retracements. When price is within ATR proximity of a key Fibonacci level, the indicator scores it as "at support" or "at resistance" depending on price position relative to the 50% midpoint.
PILLAR 2 — EMA 50 / 200
The classic dual exponential moving average system. EMA 50 is colored green when above EMA 200 (bullish structure) and red when below (bearish structure). Golden Cross (EMA 50 crossing above EMA 200) and Death Cross (EMA 50 crossing below EMA 200) events are marked with diamond shapes on the chart.
The EMA pillar provides the trend context. Fibonacci support levels are more meaningful in a bullish EMA structure; resistance levels are more meaningful in a bearish structure.
PILLAR 3 — RSI OVERBOUGHT / OVERSOLD
RSI is calculated at a configurable length (default 14) with configurable OB/OS thresholds (default 70/30). The RSI line itself is not plotted (this is an overlay indicator), but OB and OS entries are marked as small colored circles above and below price bars.
OVERBOUGHT
OVERSOLD
The RSI pillar fires a bullish score when RSI recovers from oversold (crosses back above the OS threshold) and a bearish score when RSI drops from overbought (crosses back below the OB threshold). This captures the reversal moment, not just the extreme reading.
━━━━━━━━━━━━━━━━━━━━━━━━━━━━━━━━━━
🔶 CONFLUENCE LOGIC
Each pillar scores +1 (bullish), −1 (bearish), or 0 (neutral) independently. The scores are aggregated:
→ 3/3 Pillars = "Strong Buy" or "Strong Sell" — all three pillars fully aligned. Highest conviction.
BUY -
SELL -
→ 2/3 Pillars = "Buy" or "Sell" — two of three pillars agree. Standard conviction.
→ 1/3 Pillars = No signal by default (configurable).
The minimum number of pillars required for a signal is adjustable (1, 2, or 3). Default is 2.
Additional signal filtering:
→ Flip-Only Logic: After a Buy, the next signal must be a Sell (and vice versa). No consecutive same-direction signals.
→ Cooldown: Configurable minimum bars between signals (default 10).
━━━━━━━━━━━━━━━━━━━━━━━━━━━━━━━━━━
🔶 VISUAL FEATURES
Fibonacci Levels
→ All 7 standard levels plotted as colored lines (thicker for 50% and 61.8%)
→ Golden Zone (50–61.8%) highlighted with a translucent fill
→ Price labels at the right edge of each level showing the exact price value
EMA System
→ EMA 50 colored by trend direction (green above EMA 200, red below)
→ EMA 200 as a steady reference line
→ Golden Cross (GC) and Death Cross (DC) diamond markers
RSI Markers
→ Small green circles below bars when RSI enters oversold
→ Small red circles above bars when RSI enters overbought
→ RSI value displayed in the dashboard (not as a separate pane line)
Signals
→ Buy / Sell labels with exact entry price
→ "Strong Buy" / "Strong Sell" labels when all 3 pillars align (darker color for distinction)
→ Entry price horizontal line persists for 20 bars
→ ATR-based stop-loss level plotted below/above entry
Dashboard
→ EMA trend status with direction
→ RSI current value and zone (Overbought / Oversold / Neutral)
→ Fibonacci proximity status (At Support / At Resistance / Between)
→ Nearest Fibonacci level with distance in ATR units
→ Pillar confluence count and direction
→ Last signal direction and age (bars ago)
━━━━━━━━━━━━━━━━━━━━━━━━━━━━━━━━━━
🔶 SETTINGS GUIDE
Fibonacci
• Lookback Period (default 120) — Bars used for highest high / lowest low. Increase for wider retracement levels, decrease for tighter ones.
• Fibonacci Proximity (default 0.5 ATR) — How close price must be to a level to count as "at support/resistance." Lower = stricter.
EMA
• Fast EMA (default 50) — The responsive trend line.
• Slow EMA (default 200) — The structural trend anchor.
RSI
• Length (default 14) — Standard RSI lookback.
• Overbought (default 70) / Oversold (default 30) — Zone thresholds.
Signals
• Minimum Pillars (default 2) — Set to 3 for highest quality signals only.
• Cooldown (default 10 bars) — Minimum spacing between signals.
━━━━━━━━━━━━━━━━━━━━━━━━━━━━━━━━━━
🔶 WHAT MAKES THIS ORIGINAL
While Fibonacci, EMA, and RSI are individually common, StrixFIBER integrates them through a structured pillar scoring system with proximity-based Fibonacci detection, RSI recovery signals (not raw readings), and automatic signal strength classification. The confluence layer evaluates whether a Fibonacci level is meaningful (is the EMA structure supporting it? is momentum confirming it?) rather than displaying the three tools independently. The ATR-based proximity detection for Fibonacci levels, combined with the transition-based RSI scoring and flip-only signal enforcement, creates a framework that is more than the sum of its parts.
━━━━━━━━━━━━━━━━━━━━━━━━━━━━━━━━━━
🔶 RECOMMENDED USE
Designed for day trading on 15-minute to 1-hour charts across all markets: crypto, forex, stocks, indices, and commodities. Works well alongside StrixEDGE (trend confluence overlay) and StrixPULSE (pressure spectrum in a separate pane) for a complete multi-indicator setup.
━━━━━━━━━━━━━━━━━━━━━━━━━━━━━━━━━━
⚠️ DISCLAIMER
This indicator is a technical analysis tool, not financial advice. No indicator guarantees profitable outcomes. Past performance of any signal does not indicate future results. Always apply proper risk management and use this tool as one component of a complete trading plan.
━━━━━━━━━━━━━━━━━━━━━━━━━━━━━━━━━━
5 alert conditions: Buy Signal, Sell Signal, Any Signal, Golden Cross, Death Cross.
סקריפט קוד פתוח
ברוח האמיתית של TradingView, יוצר הסקריפט הזה הפך אותו לקוד פתוח, כך שסוחרים יוכלו לעיין בו ולאמת את פעולתו. כל הכבוד למחבר! אמנם ניתן להשתמש בו בחינם, אך זכור כי פרסום חוזר של הקוד כפוף ל־כללי הבית שלנו.

✅MY Free Signals Telegram
t.me/StrixEdge
✅Website
strix-edge.com
t.me/StrixEdge
✅Website
strix-edge.com
כתב ויתור
המידע והפרסומים אינם מיועדים להיות, ואינם מהווים, ייעוץ או המלצה פיננסית, השקעתית, מסחרית או מכל סוג אחר המסופקת או מאושרת על ידי TradingView. קרא עוד ב־תנאי השימוש.
סקריפט קוד פתוח
ברוח האמיתית של TradingView, יוצר הסקריפט הזה הפך אותו לקוד פתוח, כך שסוחרים יוכלו לעיין בו ולאמת את פעולתו. כל הכבוד למחבר! אמנם ניתן להשתמש בו בחינם, אך זכור כי פרסום חוזר של הקוד כפוף ל־כללי הבית שלנו.
✅MY Free Signals Telegram
t.me/StrixEdge
✅Website
strix-edge.com
t.me/StrixEdge
✅Website
strix-edge.com
כתב ויתור
המידע והפרסומים אינם מיועדים להיות, ואינם מהווים, ייעוץ או המלצה פיננסית, השקעתית, מסחרית או מכל סוג אחר המסופקת או מאושרת על ידי TradingView. קרא עוד ב־תנאי השימוש.