OPEN-SOURCE SCRIPT
MTF LIVE SMA Heatmap
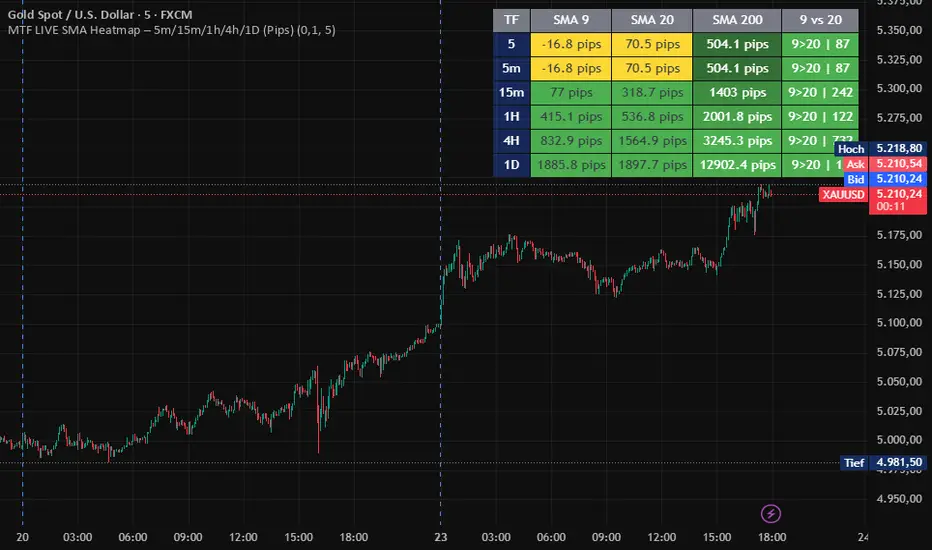
This tool displays a multi‑timeframe heatmap for SMA 9, SMA 20, and SMA 200.
It combines trend direction, pip distance, and market structure in a compact table.
Features
Pip distance between price and SMA (automatically calculated for each symbol)
Yellow highlight when price is between SMA 9 and SMA 20
Green when price is above both SMAs
Red when price is below both SMAs
SMA‑200 heatmap based on percentage distance (with neutral zone)
Trend comparison 9 vs 20 (9>20, 20>9, or neutral)
Additional row for the current timeframe
Supports Forex, Gold, Silver, Indices, Crypto, and Energies
Pip Engine
A universal pip engine automatically detects the correct pip size for each symbol
(e.g., XAU = 0.10, XAG = 0.01, BTC = 1.0, EURUSD = 0.0001, etc.).
Use Cases
Perfect for:
Trend filtering
Multi‑TF confirmation
Scalping / intraday trading
Identifying transition zones (yellow area)
SMA cluster analysis
9to20 Pip Distance
It combines trend direction, pip distance, and market structure in a compact table.
Features
Pip distance between price and SMA (automatically calculated for each symbol)
Yellow highlight when price is between SMA 9 and SMA 20
Green when price is above both SMAs
Red when price is below both SMAs
SMA‑200 heatmap based on percentage distance (with neutral zone)
Trend comparison 9 vs 20 (9>20, 20>9, or neutral)
Additional row for the current timeframe
Supports Forex, Gold, Silver, Indices, Crypto, and Energies
Pip Engine
A universal pip engine automatically detects the correct pip size for each symbol
(e.g., XAU = 0.10, XAG = 0.01, BTC = 1.0, EURUSD = 0.0001, etc.).
Use Cases
Perfect for:
Trend filtering
Multi‑TF confirmation
Scalping / intraday trading
Identifying transition zones (yellow area)
SMA cluster analysis
9to20 Pip Distance
סקריפט קוד פתוח
ברוח האמיתית של TradingView, יוצר הסקריפט הזה הפך אותו לקוד פתוח, כך שסוחרים יוכלו לעיין בו ולאמת את פעולתו. כל הכבוד למחבר! אמנם ניתן להשתמש בו בחינם, אך זכור כי פרסום חוזר של הקוד כפוף ל־כללי הבית שלנו.

כתב ויתור
המידע והפרסומים אינם מיועדים להיות, ואינם מהווים, ייעוץ או המלצה פיננסית, השקעתית, מסחרית או מכל סוג אחר המסופקת או מאושרת על ידי TradingView. קרא עוד ב־תנאי השימוש.
סקריפט קוד פתוח
ברוח האמיתית של TradingView, יוצר הסקריפט הזה הפך אותו לקוד פתוח, כך שסוחרים יוכלו לעיין בו ולאמת את פעולתו. כל הכבוד למחבר! אמנם ניתן להשתמש בו בחינם, אך זכור כי פרסום חוזר של הקוד כפוף ל־כללי הבית שלנו.
כתב ויתור
המידע והפרסומים אינם מיועדים להיות, ואינם מהווים, ייעוץ או המלצה פיננסית, השקעתית, מסחרית או מכל סוג אחר המסופקת או מאושרת על ידי TradingView. קרא עוד ב־תנאי השימוש.