OPEN-SOURCE SCRIPT
Nexus Global 15m ORB
Introduction
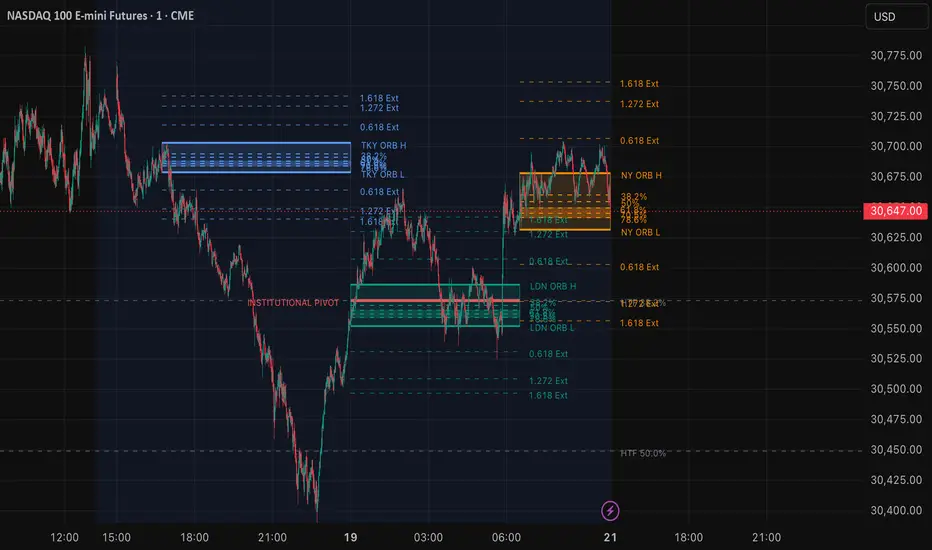
The Nexus Global 15m ORB indicator is a comprehensive opening range tool designed to map the initial 15-minute price action across the three major global trading sessions: Tokyo, London, and New York. Beyond simply marking the high and low of the opening range, this script integrates Fibonacci-based Optimal Trade Entry (OTE) zones, mathematical trend extensions, and Higher Timeframe (HTF) structural confluence to help traders identify high-probability reversal and continuation zones.
Core Concepts & What It Does
Opening Range Breakout (ORB) strategies rely on the volatility generated at the start of a trading session. The first 15 minutes often establish a support and resistance framework for the hours that follow. This indicator automatically detects these 15-minute windows and projects the range forward until the next session begins.
However, a standard ORB is often not enough to build a complete trading plan. To address this, the indicator incorporates:
- Internal Fibonacci Levels & OTE Zone: Calculates key retracement levels (38.2% and 50%) and highlights a specific Optimal Trade Entry (OTE) box between the 61.8% and 78.6% levels of the session's range.
- Session Trend Extensions: Projects standard Fibonacci extensions (0.618, 1.272, and 1.618) outward from the ORB high and low to serve as dynamic take-profit targets or exhaustion levels.
- HTF Institutional Pivots: Pulls structural swing highs and lows from a user-defined higher timeframe (e.g., 4-hour) and calculates its own macro Fibonacci levels. When these macro levels intersect with the micro 15m ORB range, the indicator highlights them as "Institutional Pivots."
How It Calculates (Underlying Logic)
- Session Tracking: Uses time() functions to detect the exact 15-minute timeframe of the Tokyo (0845-0900 JST), London (0800-0815 GMT), and New York (0930-0945 EST) opens. It dynamically tracks the high and low during this window and locks the values once the window closes.
- Internal Mathematics: The range size (rng) is calculated as ORB High - ORB Low. Internal levels are found by subtracting percentages of the range from the ORB High (e.g., ORB High - (rng * 0.5) for the 50% level).
- HTF Confluence: Utilizes request.security() alongside ta.highest() and ta.lowest() over a customizable lookback period to establish the macro structural range. It then checks if the macro 38.2%, 50%, or 61.8% levels fall sequentially inside the current active ORB boundaries, plotting them distinctly when true.
- Performance Optimization: To ensure the indicator does not cause chart lag (a common issue with heavy line/box drawing scripts), the drawing engine is restricted to update visual arrays strictly on barstate.islast, ensuring lightning-fast load times even on the 1-minute chart.*
How to Use It
- Breakout & Retest: Watch for price to break the ORB High or Low, and then wait for a retracement back to the 38.2% or 50% internal levels to join the trend toward the 1.272 or 1.618 extensions.
- OTE Reversals: If a false breakout (fake-out) occurs, look for price to return to the highlighted OTE Zone (61.8% - 78.6%). This zone often acts as a strong area of defense for institutional order flow, providing excellent risk-to-reward entries back toward the opposite side of the ORB.
- Institutional Pivots: When an HTF line populates inside the session range, treat it as a heavy magnet or resistance. Trades taken in confluence with these pivots carry a much higher structural weighting.
Originality & Usefulness
While there are many ORB tools on TradingView, the vast majority only display horizontal lines for the high and low. This script is highly original because it combines micro-session timing with macro-structural Fibonacci confluence. By mashing up session tracking with HTF swing analysis and deep optimization drawing methods, it provides a complete, lag-free institutional framework in a single indicator, saving traders from needing multiple overlapping scripts to achieve the same result.
The Nexus Global 15m ORB indicator is a comprehensive opening range tool designed to map the initial 15-minute price action across the three major global trading sessions: Tokyo, London, and New York. Beyond simply marking the high and low of the opening range, this script integrates Fibonacci-based Optimal Trade Entry (OTE) zones, mathematical trend extensions, and Higher Timeframe (HTF) structural confluence to help traders identify high-probability reversal and continuation zones.
Core Concepts & What It Does
Opening Range Breakout (ORB) strategies rely on the volatility generated at the start of a trading session. The first 15 minutes often establish a support and resistance framework for the hours that follow. This indicator automatically detects these 15-minute windows and projects the range forward until the next session begins.
However, a standard ORB is often not enough to build a complete trading plan. To address this, the indicator incorporates:
- Internal Fibonacci Levels & OTE Zone: Calculates key retracement levels (38.2% and 50%) and highlights a specific Optimal Trade Entry (OTE) box between the 61.8% and 78.6% levels of the session's range.
- Session Trend Extensions: Projects standard Fibonacci extensions (0.618, 1.272, and 1.618) outward from the ORB high and low to serve as dynamic take-profit targets or exhaustion levels.
- HTF Institutional Pivots: Pulls structural swing highs and lows from a user-defined higher timeframe (e.g., 4-hour) and calculates its own macro Fibonacci levels. When these macro levels intersect with the micro 15m ORB range, the indicator highlights them as "Institutional Pivots."
How It Calculates (Underlying Logic)
- Session Tracking: Uses time() functions to detect the exact 15-minute timeframe of the Tokyo (0845-0900 JST), London (0800-0815 GMT), and New York (0930-0945 EST) opens. It dynamically tracks the high and low during this window and locks the values once the window closes.
- Internal Mathematics: The range size (rng) is calculated as ORB High - ORB Low. Internal levels are found by subtracting percentages of the range from the ORB High (e.g., ORB High - (rng * 0.5) for the 50% level).
- HTF Confluence: Utilizes request.security() alongside ta.highest() and ta.lowest() over a customizable lookback period to establish the macro structural range. It then checks if the macro 38.2%, 50%, or 61.8% levels fall sequentially inside the current active ORB boundaries, plotting them distinctly when true.
- Performance Optimization: To ensure the indicator does not cause chart lag (a common issue with heavy line/box drawing scripts), the drawing engine is restricted to update visual arrays strictly on barstate.islast, ensuring lightning-fast load times even on the 1-minute chart.*
How to Use It
- Breakout & Retest: Watch for price to break the ORB High or Low, and then wait for a retracement back to the 38.2% or 50% internal levels to join the trend toward the 1.272 or 1.618 extensions.
- OTE Reversals: If a false breakout (fake-out) occurs, look for price to return to the highlighted OTE Zone (61.8% - 78.6%). This zone often acts as a strong area of defense for institutional order flow, providing excellent risk-to-reward entries back toward the opposite side of the ORB.
- Institutional Pivots: When an HTF line populates inside the session range, treat it as a heavy magnet or resistance. Trades taken in confluence with these pivots carry a much higher structural weighting.
Originality & Usefulness
While there are many ORB tools on TradingView, the vast majority only display horizontal lines for the high and low. This script is highly original because it combines micro-session timing with macro-structural Fibonacci confluence. By mashing up session tracking with HTF swing analysis and deep optimization drawing methods, it provides a complete, lag-free institutional framework in a single indicator, saving traders from needing multiple overlapping scripts to achieve the same result.
סקריפט קוד פתוח
ברוח האמיתית של TradingView, יוצר הסקריפט הזה הפך אותו לקוד פתוח, כך שסוחרים יוכלו לעיין בו ולאמת את פעולתו. כל הכבוד למחבר! אמנם ניתן להשתמש בו בחינם, אך זכור כי פרסום חוזר של הקוד כפוף ל־כללי הבית שלנו.

כתב ויתור
המידע והפרסומים אינם מיועדים להיות, ואינם מהווים, ייעוץ או המלצה פיננסית, השקעתית, מסחרית או מכל סוג אחר המסופקת או מאושרת על ידי TradingView. קרא עוד ב־תנאי השימוש.
סקריפט קוד פתוח
ברוח האמיתית של TradingView, יוצר הסקריפט הזה הפך אותו לקוד פתוח, כך שסוחרים יוכלו לעיין בו ולאמת את פעולתו. כל הכבוד למחבר! אמנם ניתן להשתמש בו בחינם, אך זכור כי פרסום חוזר של הקוד כפוף ל־כללי הבית שלנו.
כתב ויתור
המידע והפרסומים אינם מיועדים להיות, ואינם מהווים, ייעוץ או המלצה פיננסית, השקעתית, מסחרית או מכל סוג אחר המסופקת או מאושרת על ידי TradingView. קרא עוד ב־תנאי השימוש.