OPEN-SOURCE SCRIPT
Market Cap + Avg Traded Value In Crore
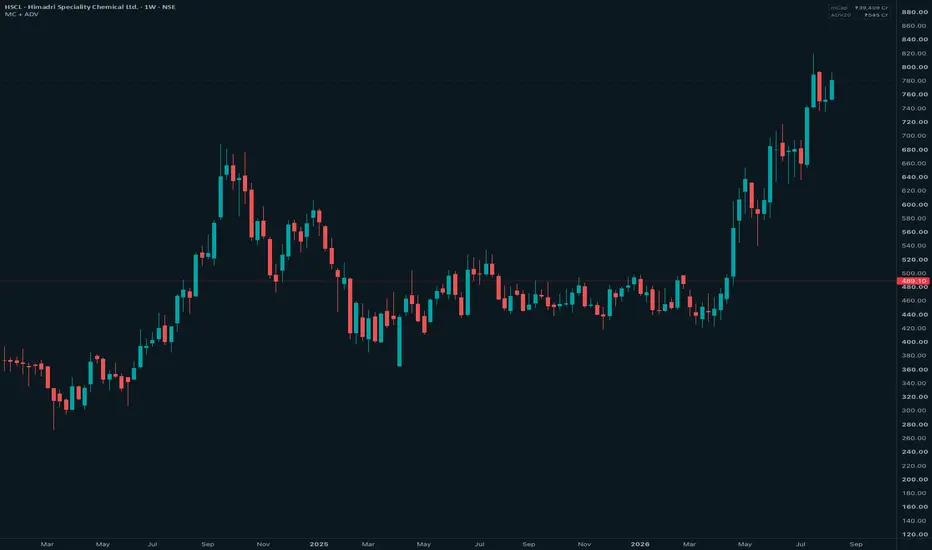
A minimal market overview indicator that displays two important stock metrics directly on the chart:
• Market Capitalization (₹ Crore)
• 20-Day Average Traded Value (₹ Crore)
Designed for quick stock analysis and liquidity assessment, especially for Indian equities.
Features:
✓ Market cap calculated dynamically using current price and shares outstanding
✓ 20-day average daily traded value calculated from daily data
✓ Works across intraday and higher timeframes
✓ Minimal floating table with customizable position
✓ Custom value color
✓ TradingView status line support for fast scanning
✓ Indian number formatting with Cr suffix
Average Traded Value (ADV) represents the average rupee value traded per day, helping traders compare liquidity across stocks regardless of share price.
Useful for:
• Stock screening
• Liquidity filtering
• Watchlist analysis
• Swing trading preparation
• Long-term investment research
This indicator is designed as a clean companion tool for traders who want essential stock information without cluttering their charts.
Note:
Market data availability depends on TradingView's supported financial data sources.
• Market Capitalization (₹ Crore)
• 20-Day Average Traded Value (₹ Crore)
Designed for quick stock analysis and liquidity assessment, especially for Indian equities.
Features:
✓ Market cap calculated dynamically using current price and shares outstanding
✓ 20-day average daily traded value calculated from daily data
✓ Works across intraday and higher timeframes
✓ Minimal floating table with customizable position
✓ Custom value color
✓ TradingView status line support for fast scanning
✓ Indian number formatting with Cr suffix
Average Traded Value (ADV) represents the average rupee value traded per day, helping traders compare liquidity across stocks regardless of share price.
Useful for:
• Stock screening
• Liquidity filtering
• Watchlist analysis
• Swing trading preparation
• Long-term investment research
This indicator is designed as a clean companion tool for traders who want essential stock information without cluttering their charts.
Note:
Market data availability depends on TradingView's supported financial data sources.
סקריפט קוד פתוח
ברוח האמיתית של TradingView, יוצר הסקריפט הזה הפך אותו לקוד פתוח, כך שסוחרים יוכלו לעיין בו ולאמת את פעולתו. כל הכבוד למחבר! אמנם ניתן להשתמש בו בחינם, אך זכור כי פרסום חוזר של הקוד כפוף ל־כללי הבית שלנו.

כתב ויתור
המידע והפרסומים אינם מיועדים להיות, ואינם מהווים, ייעוץ או המלצה פיננסית, השקעתית, מסחרית או מכל סוג אחר המסופקת או מאושרת על ידי TradingView. קרא עוד ב־תנאי השימוש.
סקריפט קוד פתוח
ברוח האמיתית של TradingView, יוצר הסקריפט הזה הפך אותו לקוד פתוח, כך שסוחרים יוכלו לעיין בו ולאמת את פעולתו. כל הכבוד למחבר! אמנם ניתן להשתמש בו בחינם, אך זכור כי פרסום חוזר של הקוד כפוף ל־כללי הבית שלנו.
כתב ויתור
המידע והפרסומים אינם מיועדים להיות, ואינם מהווים, ייעוץ או המלצה פיננסית, השקעתית, מסחרית או מכל סוג אחר המסופקת או מאושרת על ידי TradingView. קרא עוד ב־תנאי השימוש.