OPEN-SOURCE SCRIPT
RSI Master [SimpleAlgo]
█ THE RSI MASTER
RSI tells you a number. It doesn't tell you a price. You look down at the pane, see 63, and the question you actually have is the one it can't answer: how far does price have to go before this is overbought?
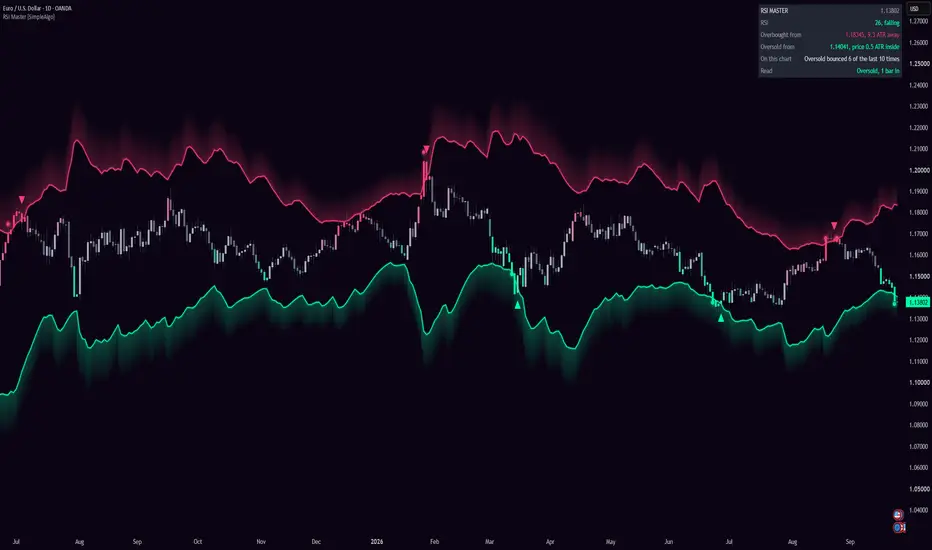
RSI Master answers it on the chart. Every bar, it solves the RSI formula backwards and finds the exact close that would put RSI at 70 on the next bar, and the exact close that would put it at 30. Those two prices are drawn as the edges of two zones: overbought above the first, oversold below the second. When price is inside a zone it is overbought or oversold, no pane needed, and the gap between price and a zone is the room it has left.

The candles carry the RSI value too. They stay a quiet grey through the middle of the range, warm toward the overbought colour as RSI climbs, cool toward the oversold colour as it falls, and light fully once price is inside a zone. A dot marks the first close into a zone and a small arrow marks the exit, which is the classic RSI signal. The panel in the corner says it in words: the RSI value, the price overbought starts from and how far away it is, the same for oversold, what happened on this chart the last ten times price reached a zone, and a one-line read. Four alerts cover the events.
⚪ The zones
The overbought zone is a band that is full at its edge and fades upward over about two ATRs. The oversold zone is its mirror below. The edges follow price, because the close needed to reach RSI 70 moves with every bar, so after a big up candle the overbought edge is closer than it was. That is not noise, it is the information.
⚪ What's different
An RSI in a pane shows you where momentum is. RSI Master shows you where it would have to go, in the only unit that matters at the moment of a trade: price. It is not an approximation and not a band fitted around price. It is the RSI formula run in reverse, and the price it names lands RSI exactly on the level.
█ HOW IT WORKS
⚪ 1. RSI
RSI is the standard Wilder RSI, 14 bars by default. Gains and losses are averaged with the same smoothing every charting platform uses, so the number matches the RSI in your pane:
Pine Script®
⚪ 2. The price behind a level
RSI next bar depends on today's averages and one unknown: tomorrow's move. So for any RSI level you can ask the formula which move would get there, and it has a closed-form answer. If the level is above where RSI sits, it takes a rise; if it is below, it takes a fall:
Pine Script®
That is the whole engine. Run it for 70 and you have the overbought edge; run it for 30 and you have the oversold edge. We checked it numerically: a close exactly at the price it names puts RSI on 70.00 on the next bar.
Because the edges are measured from each bar's close, they move with price. A short average keeps them calm without hiding the moves that matter:
Pine Script®
⚪ 3. The zones
Each zone is drawn from its edge outward, a little over two ATRs deep by default, full at the edge and fading away from price:
Pine Script®
The fade is just drawing. Overbought begins at the edge and continues upward forever; the band is there so the zone is visible without covering the chart.
⚪ 4. In and out
Price is in a zone when RSI is at or past the level. The first bar in is an entry, the first bar out is an exit:
Pine Script®
Entries get a dot at the candle's high or low. Exits get a small arrow, down out of overbought and up out of oversold. When price flickers in and out of a zone over a few bars, only the first exit gets an arrow, so a choppy edge doesn't turn into a row of them:
Pine Script®
⚪ 5. The record
Overbought means different things on different charts. On some, reaching it is where rallies die; on others, it is where they get going. So each entry into a zone is judged by what price did next, measured from the entry close in ATRs. An overbought entry reversed if price closed a full ATR lower before it closed a full ATR higher, and followed through if the opposite happened first:
Pine Script®
An entry that does neither within ten bars is dropped rather than guessed:
Pine Script®
The last ten verdicts for each zone are kept, and the panel shows the record for whichever zone is nearer: "Overbought reversed 7 of the last 10 times", or "Oversold bounced 4 of the last 10 times". When the record is lopsided, the read says so in words: "it tends to reverse here" at seven or more, "it tends to keep going here" at three or fewer.

⚪ 6. The candles
The candles show the RSI value between the zones. They stay a neutral grey through the middle of the range, with up candles a shade brighter than down candles, and start to take colour about a third of the way from 50 to a zone:
Pine Script®
From there the colour builds faster than it starts, so the chart stays calm until RSI is actually getting somewhere, and is fully lit inside a zone:
Pine Script®
Pine Script®
The candles replace your chart's candle colours while they are on. Turn them off in the settings to keep your own.
⚪ 7. The panel
The distance in the panel is the same number the chart draws:
Pine Script®
⚪ Repainting
RSI changes while a bar is open, so on the live bar the edges, the candle colour and a fresh entry or exit can move until the close. The panel says "confirms on close" next to any entry or exit that happened on the live bar. Once a bar closes, nothing about it changes: the edges, the dots, the arrows and the record are final. The record is only ever written on closed bars:
Pine Script®
█ WHY IT IS ORIGINAL
RSI is fifty years old and we have not changed it; that is the point. What is new is turning it inside out. Instead of asking what RSI is, the script asks what price would have to be, solves the formula for that price on every bar, and draws the answer on the chart as the two zones. The zones are exact, not fitted, and they move for a reason you can see: a big candle moves the price needed for the next one. On top of that sits a record kept per chart of what reaching a zone actually led to, read back in plain words, and candles that carry the RSI value so the number never has to be looked up. An RSI in a pane, a band drawn around price, and a candle colour keyed to RSI each exist on their own. The price behind the level, measured exactly and judged against the chart's own history, is what none of them give you.
█ HOW TO USE IT
⚪ Read the distance first
The most useful line in the panel is the one nobody had before: "2.8 ATR to overbought". A trade with room to run before momentum is stretched is a different trade from one that is a candle away from the zone. The edge on the chart is that same number drawn as a price, so you can set a target at it or decide not to chase into it.
⚪ Then the zone
Price inside the overbought zone is overbought by the exact definition you already use, 70 on a 14-bar RSI. The candles turn fully pink so you can't miss it, and the dot marks the bar it happened. Whether that means "sell" depends on the chart, which is what the record is for.
⚪ Then the record
If the panel says overbought reversed 8 of the last 10 times on this chart, fading the zone has been the right side lately. If it says 2 of the last 10, the zone has been a place rallies kept going, and the read will tell you it tends to keep going here. Take the number at face value and let it argue with your habit.
⚪ The arrow
The exit from a zone is the oldest RSI signal there is: momentum stretched, then let go. The arrow marks it on the chart. It is a description of what just happened, not an instruction; combine it with the record and the rest of your analysis.
⚪ Timeframes
Nothing in the script is tied to a timeframe. On a 5-minute chart the zones are a few points away and price visits them several times a session; on a daily chart they can be thousands of points away and the visits are weeks apart. The record is slower to fill on high timeframes, since it needs ten entries per zone to be worth much.

⚪ If you're new
Three sentences. The pink line is where overbought begins and the mint line is where oversold begins, in price, right now. Grey candles are the middle of the road; pink or mint ones are getting close, and fully lit ones are inside a zone. The panel tells you how far away each zone is and what this chart usually did the last ten times it got there.
None of this predicts where price goes. Overbought is a description of how far price has come, not a promise it will turn. Use it with your own analysis and manage your risk.
█ SETTINGS
⚪ RSI
⚪ Look
The rules behind the record are fixed: an entry is judged within ten bars, by a full ATR either way, and the last ten verdicts per zone are kept:
Pine Script®
Those numbers are right or wrong rather than a matter of taste, and we would rather you didn't have to think about them.
█ ALERTS
Set them to "Once per bar close". A zone entry on a live bar can still be undone before the close.
█ NOTES AND LIMITS
█ DISCLAIMER
This script is for education and information. It isn't financial advice, a recommendation to buy or sell anything, or a promise about what any market will do. Past behaviour of a market, a method or an indicator doesn't guarantee future results, and nothing on this chart replaces your own judgement. Trading involves risk and you are responsible for your decisions.
RSI tells you a number. It doesn't tell you a price. You look down at the pane, see 63, and the question you actually have is the one it can't answer: how far does price have to go before this is overbought?
RSI Master answers it on the chart. Every bar, it solves the RSI formula backwards and finds the exact close that would put RSI at 70 on the next bar, and the exact close that would put it at 30. Those two prices are drawn as the edges of two zones: overbought above the first, oversold below the second. When price is inside a zone it is overbought or oversold, no pane needed, and the gap between price and a zone is the room it has left.
The candles carry the RSI value too. They stay a quiet grey through the middle of the range, warm toward the overbought colour as RSI climbs, cool toward the oversold colour as it falls, and light fully once price is inside a zone. A dot marks the first close into a zone and a small arrow marks the exit, which is the classic RSI signal. The panel in the corner says it in words: the RSI value, the price overbought starts from and how far away it is, the same for oversold, what happened on this chart the last ten times price reached a zone, and a one-line read. Four alerts cover the events.
⚪ The zones
The overbought zone is a band that is full at its edge and fades upward over about two ATRs. The oversold zone is its mirror below. The edges follow price, because the close needed to reach RSI 70 moves with every bar, so after a big up candle the overbought edge is closer than it was. That is not noise, it is the information.
⚪ What's different
An RSI in a pane shows you where momentum is. RSI Master shows you where it would have to go, in the only unit that matters at the moment of a trade: price. It is not an approximation and not a band fitted around price. It is the RSI formula run in reverse, and the price it names lands RSI exactly on the level.
█ HOW IT WORKS
⚪ 1. RSI
RSI is the standard Wilder RSI, 14 bars by default. Gains and losses are averaged with the same smoothing every charting platform uses, so the number matches the RSI in your pane:
⚪ 2. The price behind a level
RSI next bar depends on today's averages and one unknown: tomorrow's move. So for any RSI level you can ask the formula which move would get there, and it has a closed-form answer. If the level is above where RSI sits, it takes a rise; if it is below, it takes a fall:
That is the whole engine. Run it for 70 and you have the overbought edge; run it for 30 and you have the oversold edge. We checked it numerically: a close exactly at the price it names puts RSI on 70.00 on the next bar.
Because the edges are measured from each bar's close, they move with price. A short average keeps them calm without hiding the moves that matter:
⚪ 3. The zones
Each zone is drawn from its edge outward, a little over two ATRs deep by default, full at the edge and fading away from price:
The fade is just drawing. Overbought begins at the edge and continues upward forever; the band is there so the zone is visible without covering the chart.
⚪ 4. In and out
Price is in a zone when RSI is at or past the level. The first bar in is an entry, the first bar out is an exit:
Entries get a dot at the candle's high or low. Exits get a small arrow, down out of overbought and up out of oversold. When price flickers in and out of a zone over a few bars, only the first exit gets an arrow, so a choppy edge doesn't turn into a row of them:
⚪ 5. The record
Overbought means different things on different charts. On some, reaching it is where rallies die; on others, it is where they get going. So each entry into a zone is judged by what price did next, measured from the entry close in ATRs. An overbought entry reversed if price closed a full ATR lower before it closed a full ATR higher, and followed through if the opposite happened first:
An entry that does neither within ten bars is dropped rather than guessed:
The last ten verdicts for each zone are kept, and the panel shows the record for whichever zone is nearer: "Overbought reversed 7 of the last 10 times", or "Oversold bounced 4 of the last 10 times". When the record is lopsided, the read says so in words: "it tends to reverse here" at seven or more, "it tends to keep going here" at three or fewer.
⚪ 6. The candles
The candles show the RSI value between the zones. They stay a neutral grey through the middle of the range, with up candles a shade brighter than down candles, and start to take colour about a third of the way from 50 to a zone:
From there the colour builds faster than it starts, so the chart stays calm until RSI is actually getting somewhere, and is fully lit inside a zone:
The candles replace your chart's candle colours while they are on. Turn them off in the settings to keep your own.
⚪ 7. The panel
- RSI: the value, and whether it is rising, falling or flat over the last three bars.
- Overbought from: the price the overbought zone starts at, and how far away it is in ATRs, or how deep inside it price already is.
- Oversold from: the same for oversold.
- On this chart: the record for the nearer zone, out of the last ten entries.
- Read: one line. "Room to run, 2.8 ATR to overbought", "Knocking on overbought", "Overbought, 3 bars in", "Left oversold 2 bars ago", with the chart's tendency added when the record is lopsided.
The distance in the panel is the same number the chart draws:
⚪ Repainting
RSI changes while a bar is open, so on the live bar the edges, the candle colour and a fresh entry or exit can move until the close. The panel says "confirms on close" next to any entry or exit that happened on the live bar. Once a bar closes, nothing about it changes: the edges, the dots, the arrows and the record are final. The record is only ever written on closed bars:
█ WHY IT IS ORIGINAL
RSI is fifty years old and we have not changed it; that is the point. What is new is turning it inside out. Instead of asking what RSI is, the script asks what price would have to be, solves the formula for that price on every bar, and draws the answer on the chart as the two zones. The zones are exact, not fitted, and they move for a reason you can see: a big candle moves the price needed for the next one. On top of that sits a record kept per chart of what reaching a zone actually led to, read back in plain words, and candles that carry the RSI value so the number never has to be looked up. An RSI in a pane, a band drawn around price, and a candle colour keyed to RSI each exist on their own. The price behind the level, measured exactly and judged against the chart's own history, is what none of them give you.
█ HOW TO USE IT
⚪ Read the distance first
The most useful line in the panel is the one nobody had before: "2.8 ATR to overbought". A trade with room to run before momentum is stretched is a different trade from one that is a candle away from the zone. The edge on the chart is that same number drawn as a price, so you can set a target at it or decide not to chase into it.
⚪ Then the zone
Price inside the overbought zone is overbought by the exact definition you already use, 70 on a 14-bar RSI. The candles turn fully pink so you can't miss it, and the dot marks the bar it happened. Whether that means "sell" depends on the chart, which is what the record is for.
⚪ Then the record
If the panel says overbought reversed 8 of the last 10 times on this chart, fading the zone has been the right side lately. If it says 2 of the last 10, the zone has been a place rallies kept going, and the read will tell you it tends to keep going here. Take the number at face value and let it argue with your habit.
⚪ The arrow
The exit from a zone is the oldest RSI signal there is: momentum stretched, then let go. The arrow marks it on the chart. It is a description of what just happened, not an instruction; combine it with the record and the rest of your analysis.
⚪ Timeframes
Nothing in the script is tied to a timeframe. On a 5-minute chart the zones are a few points away and price visits them several times a session; on a daily chart they can be thousands of points away and the visits are weeks apart. The record is slower to fill on high timeframes, since it needs ten entries per zone to be worth much.
⚪ If you're new
Three sentences. The pink line is where overbought begins and the mint line is where oversold begins, in price, right now. Grey candles are the middle of the road; pink or mint ones are getting close, and fully lit ones are inside a zone. The panel tells you how far away each zone is and what this chart usually did the last ten times it got there.
None of this predicts where price goes. Overbought is a description of how far price has come, not a promise it will turn. Use it with your own analysis and manage your risk.
█ SETTINGS
⚪ RSI
- Length: 14 by default, the same as your pane.
- Overbought and Oversold: 70 and 30 by default. Move them and the zones move with them.
- Smoothing (bars): how calm the zone edges are. 3 by default. Lower is more exact and more jagged on fast charts; higher is smoother and a bar or two behind.
⚪ Look
- Theme: Neon, Classic, Aurora, Ice, or Custom with your own overbought and oversold colours.
- Brightness: 1 to 5, for your screen and background.
- Zone depth (ATR): how far the zone's glow reaches past its edge. Drawing only; the zone itself has no far edge.
- RSI candles: on by default. Off keeps your own candle colours.
- Midline (RSI 50): the price that would put RSI exactly at 50, as a dotted line. Off by default.
- Entry dots and Exit arrows: on by default.
- Panel: position and size.
The rules behind the record are fixed: an entry is judged within ten bars, by a full ATR either way, and the last ten verdicts per zone are kept:
Those numbers are right or wrong rather than a matter of taste, and we would rather you didn't have to think about them.
█ ALERTS
- Overbought: price closed into the overbought zone.
- Left overbought: price left it.
- Oversold: price closed into the oversold zone.
- Left oversold: price left it.
Set them to "Once per bar close". A zone entry on a live bar can still be undone before the close.
█ NOTES AND LIMITS
- The edge is the close needed on the next bar, measured from this bar's close. It is exact for one bar ahead, not a level that holds for the week. That is why it moves.
- A big candle moves the edges. After a large up candle, overbought is closer; after a large down candle, further away. The edges kink where the candles are big. Smoothing softens this at the cost of lag.
- Closes count, wicks don't. A wick poking into a zone is not an entry; RSI is a close-to-close measure and so is this.
- The record needs ten entries per zone to mean much, and it is the last ten only. On a daily chart that can be a year of history. Read the count next to the number.
- The record judges an entry by what happened within ten bars. A reversal that came on bar twelve is not counted; it is dropped, not scored against the zone.
- Zone depth is drawing. Price three ATRs past the edge is still overbought; it is just past the glow.
- RSI candles replace your candle colours while they are on, and up and down candles are told apart by brightness rather than colour. If you rely on green and red, turn them off.
- On symbols with very few bars of history, the zones exist from the first bar but the record is empty until the first entries have been judged.
█ DISCLAIMER
This script is for education and information. It isn't financial advice, a recommendation to buy or sell anything, or a promise about what any market will do. Past behaviour of a market, a method or an indicator doesn't guarantee future results, and nothing on this chart replaces your own judgement. Trading involves risk and you are responsible for your decisions.
סקריפט קוד פתוח
ברוח האמיתית של TradingView, יוצר הסקריפט הזה הפך אותו לקוד פתוח, כך שסוחרים יוכלו לעיין בו ולאמת את פעולתו. כל הכבוד למחבר! אמנם ניתן להשתמש בו בחינם, אך זכור כי פרסום חוזר של הקוד כפוף ל־כללי הבית שלנו.

Access our exclusive invite-only scripts: simplealgo.io
Join our discord: discord.gg/simplealgo
Join our discord: discord.gg/simplealgo
כתב ויתור
המידע והפרסומים אינם מיועדים להיות, ואינם מהווים, ייעוץ או המלצה פיננסית, השקעתית, מסחרית או מכל סוג אחר המסופקת או מאושרת על ידי TradingView. קרא עוד ב־תנאי השימוש.
סקריפט קוד פתוח
ברוח האמיתית של TradingView, יוצר הסקריפט הזה הפך אותו לקוד פתוח, כך שסוחרים יוכלו לעיין בו ולאמת את פעולתו. כל הכבוד למחבר! אמנם ניתן להשתמש בו בחינם, אך זכור כי פרסום חוזר של הקוד כפוף ל־כללי הבית שלנו.
Access our exclusive invite-only scripts: simplealgo.io
Join our discord: discord.gg/simplealgo
Join our discord: discord.gg/simplealgo
כתב ויתור
המידע והפרסומים אינם מיועדים להיות, ואינם מהווים, ייעוץ או המלצה פיננסית, השקעתית, מסחרית או מכל סוג אחר המסופקת או מאושרת על ידי TradingView. קרא עוד ב־תנאי השימוש.