Chart Pattern Blueprint [Quantum Algo]
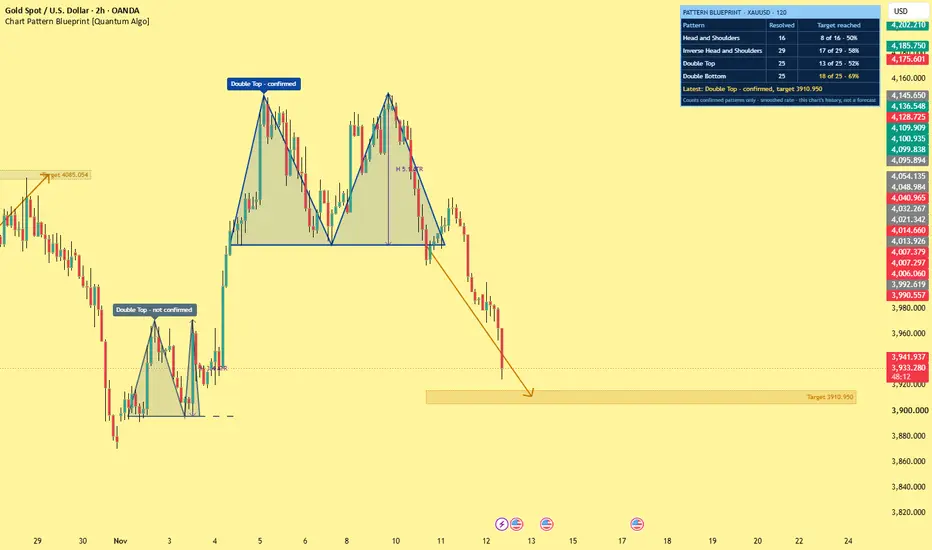
Chart Pattern Blueprint [Quantum Algo]
═══════════════════════════════════════════════
🔶 OVERVIEW
Chart Pattern Blueprint automatically detects four classical reversal chart patterns — the Head and Shoulders pattern, the Inverse Head and Shoulders, the Double Top pattern and the Double Bottom — and draws each one the way an engineer would draw it: a filled outline of the pattern, the neckline, a dimension line that measures the pattern height, and the measured-move target projected from the neckline break.
Every pattern then moves through a visible lifecycle on the chart — forming, confirmed, target reached, failed or expired — and a title block in the corner keeps a plain count of how often each pattern type has reached its target on the symbol and timeframe you are looking at. The tool does not tell you that a pattern will work. It shows you the pattern, the textbook target, and the record.
═══════════════════════════════════════════════
🔶 WHAT IS A HEAD AND SHOULDERS PATTERN?
A Head and Shoulders pattern is a reversal formation made of three peaks: a left shoulder, a higher head, and a right shoulder at roughly the height of the left one. The two lows between the peaks define the neckline. The pattern is considered complete only when price closes below the neckline. The Inverse Head and Shoulders is the same structure upside down, forming after a decline and completing on a close above the neckline.
═══════════════════════════════════════════════
🔶 WHAT IS A DOUBLE TOP PATTERN?
A Double Top is two peaks at nearly the same price separated by a pullback. The low of that pullback is the neckline, and the pattern completes on a close below it. A Double Bottom is the mirror image: two lows at nearly the same price, completing on a close above the high between them.
═══════════════════════════════════════════════
🔶 WHAT IS THE MEASURED MOVE?
The classical price objective for these patterns is the measured move: take the height of the pattern (from its extreme to the neckline) and project it from the neckline in the direction of the break. The dimension line on each drawing shows that height in Average True Range units, and the target box shows where the projection lands.
═══════════════════════════════════════════════
🔶 WHY IS THIS ORIGINAL?
1. Blueprint rendering. Each pattern is drawn as a filled technical outline with a neckline, a double-headed dimension line labeled with the pattern height, an arrow projecting the measured move and a target box — a complete, self-explaining drawing instead of a label on a candle.
2. A visible lifecycle. A pattern is first drawn as forming, in blueprint ink. It becomes confirmed only when a bar closes beyond the neckline. It then resolves as target reached, failed (price closed back beyond the failure level) or expired (the time window ran out), and the drawing is recolored to show which. Patterns that never break their neckline are marked not confirmed and are not counted.
3. An outcome record per pattern type. The title block counts, for each of the four patterns, how many confirmed patterns have resolved on this chart and how many of them reached the measured-move target, with a smoothed rate so that two or three early results cannot produce an extreme percentage.
4. Geometry rules stated in volatility units. Minimum pattern height is measured in Average True Range, peak equality, shoulder symmetry and neckline tilt are measured as shares of the pattern height, and a lead-in swing is required so that the pattern is reversing a real move. All of these are inputs.
5. Sloped necklines. Head and Shoulders necklines are drawn through the two actual reaction points and may slope; the break, the target and the dimension line all follow the sloped line.
═══════════════════════════════════════════════
🔶 HOW IT WORKS
— Swings. Confirmed swing highs and lows are collected into an alternating sequence. A swing is confirmed a fixed number of bars after it forms (the Swing Length), so a pattern is evaluated only on closed, confirmed data.
— Head and Shoulders test. The last five swings are tested: the middle swing must exceed both outer swings; the shoulders must each stand at least a quarter of the pattern height beyond the neckline and be within the symmetry tolerance of each other; the two neckline points must be within the tilt tolerance; and the swing before the left shoulder must lie beyond the neckline on the trend side.
— Double Top and Double Bottom test. The last three swings are tested: the two extremes must be within the equality tolerance, the pattern must be at least the minimum height, and the swing before the first extreme must lie beyond the neckline on the trend side.
— Confirmation. A forming pattern is confirmed when a bar closes beyond the neckline by the break buffer. It is discarded if a bar closes beyond the pattern extreme first, or if the break does not arrive within the waiting window.
— Resolution. After confirmation the target is the neckline at the break plus or minus the pattern height times the target multiple. The pattern resolves as target reached when price trades at the target, as failed when a bar closes back beyond the failure level (the right shoulder for Head and Shoulders, the pattern extreme for double patterns), or as expired when the time window ends.
— Statistics. Only confirmed patterns that have resolved are counted. The displayed rate is (targets reached + 2) / (resolved + 4).
Detection, confirmation and resolution are evaluated on confirmed bars and do not repaint. Because a swing needs the Swing Length to be confirmed, a pattern appears that many bars after its last swing — this delay is inherent to the method and is not hidden. No higher-timeframe data is requested.
═══════════════════════════════════════════════
🔶 HOW TO USE IT
— Treat a forming pattern as a heads-up, not a signal. The classical rule is that the pattern does not exist until the neckline breaks; the tool follows that rule and so should you.
— Read the dimension line before the target. A pattern a few Average True Ranges tall has a nearby target; a tall pattern has a distant one. The target box shows the level and the time allowed.
— Check the title block for the pattern type in front of you. If this symbol and timeframe has a short or poor record for that pattern, weigh it accordingly. A dash means there is no resolved history yet.
— Use the failure level as the pattern's own invalidation: a close back beyond it means the classical setup is no longer valid.
— Raise the Swing Length to find larger patterns and lower it for smaller ones. Works on any market and timeframe on standard candlestick charts.
═══════════════════════════════════════════════
🔶 SETTINGS
— Patterns: toggle each family, Swing Length, minimum pattern height, maximum pattern width.
— Geometry Tolerances: peak equality for double patterns; shoulder symmetry and neckline tilt for Head and Shoulders.
— Confirmation And Target: neckline break buffer, target multiple, waiting window, time allowed to reach the target, number of patterns kept on the chart.
— Visuals: blueprint ink, dimension line, target and outcome colors.
— Title Block: visibility, position, text size.
═══════════════════════════════════════════════
🔶 ALERTS
— Pattern Forming — a pattern shape completed and is waiting for a neckline break.
— Bullish Pattern Confirmed / Bearish Pattern Confirmed — a bar closed beyond the neckline.
— Pattern Target Reached — a confirmed pattern reached its measured-move target.
— Pattern Failed — a confirmed pattern closed back beyond its failure level.
═══════════════════════════════════════════════
🔶 FAQ
Q: Does it repaint?
A: No. Swings, patterns, confirmations and outcomes are all evaluated on confirmed bars. A pattern is drawn a Swing Length after its last swing because that is when the swing is confirmed; it is never drawn retroactively earlier than that. While a pattern is still forming, a new higher or lower final swing can update its outline — that is the pattern itself changing, and it is shown as forming for exactly that reason.
Q: Why did a pattern turn gray and say "not confirmed"?
A: Price either closed beyond the pattern extreme or did not break the neckline within the waiting window. By the classical definition the pattern never completed, so it is not counted in the record.
Q: What do the numbers in the title block mean?
A: For each pattern type: how many confirmed patterns have resolved on this chart, how many reached the measured-move target, and a smoothed percentage. They describe this chart's loaded history only. They are not a forecast and say nothing about other symbols or timeframes.
Q: Why does the target use exactly one pattern height?
A: That is the classical measured move. The multiple is an input, so you can test a more conservative or more ambitious objective and see how the record changes.
Q: Which chart types is it for?
A: Standard candlestick or bar charts. It is not intended for Heikin Ashi, Renko, Kagi, point and figure, line break or range charts, where synthetic prices would distort the swings and outcomes.
═══════════════════════════════════════════════
🔶 CREDITS
The Head and Shoulders, Double Top and Double Bottom patterns and the measured-move objective come from classical technical analysis, described by Richard W. Schabacker (Technical Analysis and Stock Market Profits, 1932) and by Robert D. Edwards and John Magee (Technical Analysis of Stock Trends, 1948). The practice of recording pattern outcomes statistically follows Thomas N. Bulkowski (Encyclopedia of Chart Patterns). The Average True Range is by J. Welles Wilder Jr. (1978). Swing pivots are standard charting technique, and additive (Laplace) smoothing is classical statistics. The geometry rules, lifecycle engine, blueprint rendering, outcome statistics and all code in this script are original work. No third-party or open-source script code was reused.
═══════════════════════════════════════════════
🔶 LIMITATIONS
— Pattern recognition is rule-based. A formation a human would accept may be rejected by the tolerances, and the reverse; adjust the tolerances to your own definition.
— Patterns are confirmed with a delay equal to the Swing Length, and a neckline may already be broken when the pattern is first drawn.
— The outcome record depends on the history loaded on the chart and on your settings; small samples are unreliable even after smoothing.
— When the target and the failure level are both touched inside one bar, the tool cannot know which came first and records the target.
— Only four reversal patterns are covered. Continuation patterns such as flags, triangles and wedges are not detected.
═══════════════════════════════════════════════
🔶 DISCLAIMER
This indicator is a research and charting tool provided for educational purposes. It is not financial advice, and nothing it displays is a recommendation to buy or sell any asset. Past pattern outcomes do not guarantee future results. Trading involves substantial risk of loss. Always do your own analysis and manage risk responsibly.
═══════════════════════════════════════════════
🔶 OVERVIEW
Chart Pattern Blueprint automatically detects four classical reversal chart patterns — the Head and Shoulders pattern, the Inverse Head and Shoulders, the Double Top pattern and the Double Bottom — and draws each one the way an engineer would draw it: a filled outline of the pattern, the neckline, a dimension line that measures the pattern height, and the measured-move target projected from the neckline break.
Every pattern then moves through a visible lifecycle on the chart — forming, confirmed, target reached, failed or expired — and a title block in the corner keeps a plain count of how often each pattern type has reached its target on the symbol and timeframe you are looking at. The tool does not tell you that a pattern will work. It shows you the pattern, the textbook target, and the record.
═══════════════════════════════════════════════
🔶 WHAT IS A HEAD AND SHOULDERS PATTERN?
A Head and Shoulders pattern is a reversal formation made of three peaks: a left shoulder, a higher head, and a right shoulder at roughly the height of the left one. The two lows between the peaks define the neckline. The pattern is considered complete only when price closes below the neckline. The Inverse Head and Shoulders is the same structure upside down, forming after a decline and completing on a close above the neckline.
═══════════════════════════════════════════════
🔶 WHAT IS A DOUBLE TOP PATTERN?
A Double Top is two peaks at nearly the same price separated by a pullback. The low of that pullback is the neckline, and the pattern completes on a close below it. A Double Bottom is the mirror image: two lows at nearly the same price, completing on a close above the high between them.
═══════════════════════════════════════════════
🔶 WHAT IS THE MEASURED MOVE?
The classical price objective for these patterns is the measured move: take the height of the pattern (from its extreme to the neckline) and project it from the neckline in the direction of the break. The dimension line on each drawing shows that height in Average True Range units, and the target box shows where the projection lands.
═══════════════════════════════════════════════
🔶 WHY IS THIS ORIGINAL?
1. Blueprint rendering. Each pattern is drawn as a filled technical outline with a neckline, a double-headed dimension line labeled with the pattern height, an arrow projecting the measured move and a target box — a complete, self-explaining drawing instead of a label on a candle.
2. A visible lifecycle. A pattern is first drawn as forming, in blueprint ink. It becomes confirmed only when a bar closes beyond the neckline. It then resolves as target reached, failed (price closed back beyond the failure level) or expired (the time window ran out), and the drawing is recolored to show which. Patterns that never break their neckline are marked not confirmed and are not counted.
3. An outcome record per pattern type. The title block counts, for each of the four patterns, how many confirmed patterns have resolved on this chart and how many of them reached the measured-move target, with a smoothed rate so that two or three early results cannot produce an extreme percentage.
4. Geometry rules stated in volatility units. Minimum pattern height is measured in Average True Range, peak equality, shoulder symmetry and neckline tilt are measured as shares of the pattern height, and a lead-in swing is required so that the pattern is reversing a real move. All of these are inputs.
5. Sloped necklines. Head and Shoulders necklines are drawn through the two actual reaction points and may slope; the break, the target and the dimension line all follow the sloped line.
═══════════════════════════════════════════════
🔶 HOW IT WORKS
— Swings. Confirmed swing highs and lows are collected into an alternating sequence. A swing is confirmed a fixed number of bars after it forms (the Swing Length), so a pattern is evaluated only on closed, confirmed data.
— Head and Shoulders test. The last five swings are tested: the middle swing must exceed both outer swings; the shoulders must each stand at least a quarter of the pattern height beyond the neckline and be within the symmetry tolerance of each other; the two neckline points must be within the tilt tolerance; and the swing before the left shoulder must lie beyond the neckline on the trend side.
— Double Top and Double Bottom test. The last three swings are tested: the two extremes must be within the equality tolerance, the pattern must be at least the minimum height, and the swing before the first extreme must lie beyond the neckline on the trend side.
— Confirmation. A forming pattern is confirmed when a bar closes beyond the neckline by the break buffer. It is discarded if a bar closes beyond the pattern extreme first, or if the break does not arrive within the waiting window.
— Resolution. After confirmation the target is the neckline at the break plus or minus the pattern height times the target multiple. The pattern resolves as target reached when price trades at the target, as failed when a bar closes back beyond the failure level (the right shoulder for Head and Shoulders, the pattern extreme for double patterns), or as expired when the time window ends.
— Statistics. Only confirmed patterns that have resolved are counted. The displayed rate is (targets reached + 2) / (resolved + 4).
Detection, confirmation and resolution are evaluated on confirmed bars and do not repaint. Because a swing needs the Swing Length to be confirmed, a pattern appears that many bars after its last swing — this delay is inherent to the method and is not hidden. No higher-timeframe data is requested.
═══════════════════════════════════════════════
🔶 HOW TO USE IT
— Treat a forming pattern as a heads-up, not a signal. The classical rule is that the pattern does not exist until the neckline breaks; the tool follows that rule and so should you.
— Read the dimension line before the target. A pattern a few Average True Ranges tall has a nearby target; a tall pattern has a distant one. The target box shows the level and the time allowed.
— Check the title block for the pattern type in front of you. If this symbol and timeframe has a short or poor record for that pattern, weigh it accordingly. A dash means there is no resolved history yet.
— Use the failure level as the pattern's own invalidation: a close back beyond it means the classical setup is no longer valid.
— Raise the Swing Length to find larger patterns and lower it for smaller ones. Works on any market and timeframe on standard candlestick charts.
═══════════════════════════════════════════════
🔶 SETTINGS
— Patterns: toggle each family, Swing Length, minimum pattern height, maximum pattern width.
— Geometry Tolerances: peak equality for double patterns; shoulder symmetry and neckline tilt for Head and Shoulders.
— Confirmation And Target: neckline break buffer, target multiple, waiting window, time allowed to reach the target, number of patterns kept on the chart.
— Visuals: blueprint ink, dimension line, target and outcome colors.
— Title Block: visibility, position, text size.
═══════════════════════════════════════════════
🔶 ALERTS
— Pattern Forming — a pattern shape completed and is waiting for a neckline break.
— Bullish Pattern Confirmed / Bearish Pattern Confirmed — a bar closed beyond the neckline.
— Pattern Target Reached — a confirmed pattern reached its measured-move target.
— Pattern Failed — a confirmed pattern closed back beyond its failure level.
═══════════════════════════════════════════════
🔶 FAQ
Q: Does it repaint?
A: No. Swings, patterns, confirmations and outcomes are all evaluated on confirmed bars. A pattern is drawn a Swing Length after its last swing because that is when the swing is confirmed; it is never drawn retroactively earlier than that. While a pattern is still forming, a new higher or lower final swing can update its outline — that is the pattern itself changing, and it is shown as forming for exactly that reason.
Q: Why did a pattern turn gray and say "not confirmed"?
A: Price either closed beyond the pattern extreme or did not break the neckline within the waiting window. By the classical definition the pattern never completed, so it is not counted in the record.
Q: What do the numbers in the title block mean?
A: For each pattern type: how many confirmed patterns have resolved on this chart, how many reached the measured-move target, and a smoothed percentage. They describe this chart's loaded history only. They are not a forecast and say nothing about other symbols or timeframes.
Q: Why does the target use exactly one pattern height?
A: That is the classical measured move. The multiple is an input, so you can test a more conservative or more ambitious objective and see how the record changes.
Q: Which chart types is it for?
A: Standard candlestick or bar charts. It is not intended for Heikin Ashi, Renko, Kagi, point and figure, line break or range charts, where synthetic prices would distort the swings and outcomes.
═══════════════════════════════════════════════
🔶 CREDITS
The Head and Shoulders, Double Top and Double Bottom patterns and the measured-move objective come from classical technical analysis, described by Richard W. Schabacker (Technical Analysis and Stock Market Profits, 1932) and by Robert D. Edwards and John Magee (Technical Analysis of Stock Trends, 1948). The practice of recording pattern outcomes statistically follows Thomas N. Bulkowski (Encyclopedia of Chart Patterns). The Average True Range is by J. Welles Wilder Jr. (1978). Swing pivots are standard charting technique, and additive (Laplace) smoothing is classical statistics. The geometry rules, lifecycle engine, blueprint rendering, outcome statistics and all code in this script are original work. No third-party or open-source script code was reused.
═══════════════════════════════════════════════
🔶 LIMITATIONS
— Pattern recognition is rule-based. A formation a human would accept may be rejected by the tolerances, and the reverse; adjust the tolerances to your own definition.
— Patterns are confirmed with a delay equal to the Swing Length, and a neckline may already be broken when the pattern is first drawn.
— The outcome record depends on the history loaded on the chart and on your settings; small samples are unreliable even after smoothing.
— When the target and the failure level are both touched inside one bar, the tool cannot know which came first and records the target.
— Only four reversal patterns are covered. Continuation patterns such as flags, triangles and wedges are not detected.
═══════════════════════════════════════════════
🔶 DISCLAIMER
This indicator is a research and charting tool provided for educational purposes. It is not financial advice, and nothing it displays is a recommendation to buy or sell any asset. Past pattern outcomes do not guarantee future results. Trading involves substantial risk of loss. Always do your own analysis and manage risk responsibly.

The institutional Edge: Indicators, Strategies & a Free Academy. quantum-algo.com
All content provided by Quantum Algo is for informational & educational purposes only.
All content provided by Quantum Algo is for informational & educational purposes only.
כתב ויתור
המידע והפרסומים אינם מיועדים להיות, ואינם מהווים, ייעוץ או המלצה פיננסית, השקעתית, מסחרית או מכל סוג אחר המסופקת או מאושרת על ידי TradingView. קרא עוד ב־תנאי השימוש.
The institutional Edge: Indicators, Strategies & a Free Academy. quantum-algo.com
All content provided by Quantum Algo is for informational & educational purposes only.
All content provided by Quantum Algo is for informational & educational purposes only.
כתב ויתור
המידע והפרסומים אינם מיועדים להיות, ואינם מהווים, ייעוץ או המלצה פיננסית, השקעתית, מסחרית או מכל סוג אחר המסופקת או מאושרת על ידי TradingView. קרא עוד ב־תנאי השימוש.