Trend Exhaustion & Continuation Map [BullByte]
More exclusive indicators from BullByte
Subscribe to Ultimate Arsenal for $199.00/month to get exclusive indicators by this author. You pay right on TradingView and can use them on your charts straight away.
Explore Ultimate ArsenalTrend Exhaustion & Continuation Map [BullByte] is a price-action indicator for trend development, pullbacks, continuation, exhaustion, protected-structure failure and market balance. It connects volatility-scaled displacement, breakout structure, directional efficiency, accepted-close progress and pullback-reclaim logic.
It helps traders assess a leg's development, accepted progress, pullback/continuation conditions and weakening structure. It is a market-context tool, not a standalone buy/sell system.
---
OVERVIEW AND DESIGN PURPOSE
A strong candle does not automatically establish a durable trend; a pullback is not automatically a reversal, and exhaustion does not guarantee a trend has ended. The indicator describes a leg's changing condition rather than predicting the next candle.
Three directional phases describe development:
• DRIVE - qualifying displacement, a preceding-range break and sufficient directional efficiency.
• FORMING - additional accepted closing progress beyond the confirmed birth close.
• TREND - a larger favourable extension plus the minimum completed-bar requirement.
The model also tracks pullback, giveback, recovery, continuation, exhaustion, structural failure, balance and balance release.
---
WHY A TRADER MAY USE IT
The challenge is often not spotting one strong candle; it is judging what happens after it. Has price made enough accepted progress to call the leg more mature? Is a pullback still contained by the original structure? Has a local reclaim qualified a continuation event? Is the move stalling, entering balance, or losing the level that defined the broader leg?
The map gives those questions separate, inspectable conditions. It is intended to support chart analysis, not replace market context or risk management. It does not decide whether a trade should be taken, and a displayed event is not an instruction to enter or exit.
---
WHY THESE COMPONENTS WORK TOGETHER
Displacement measures whether price travelled far enough; a preceding-range breakout tests structure; directional efficiency compares net displacement with the close-to-close path; and the movement scale adapts thresholds to typical price movement. Accepted-close progress distinguishes closing progress from a wick. Primary protected structure defines broader-leg failure, while pullback depth plus local reclaim qualify continuation. Balance uses range width, low directional efficiency, centring and persistence. The oscillator, drawings, scanner and alerts all use this same state engine.
This is a purpose-built price-state model, not a mash-up that simply stacks unrelated RSI, MACD, moving-average or other standard indicator plots. Its components serve one connected purpose: describing the development and possible failure of a directional leg.
---
HOW THE MODEL WORKS
The indicator follows a directional leg through its development, retracements, continuation attempts, exhaustion and possible structural failure. Each state describes a different aspect of price behaviour: a strong candle is not automatically a trend, a pullback is not automatically a reversal, and an exhaustion warning does not predict what happens next.
---
OVERVIEW: FOLLOWING A DIRECTIONAL LEG

1 - DRIVE BIRTH
A bullish or bearish drive qualifies only when several conditions agree. Price must show sufficient net displacement over the configured window, close beyond a preceding breakout reference by the required clearance, meet the directional-efficiency threshold, and close in the direction of travel. The engine also requires sufficient preceding history within the current segment. One large candle alone is not enough.
With the default settings, the displacement and breakout-reference windows are both four bars. Minimum birth displacement is 0.85 movement-scale units, directional efficiency is 0.32, and breakout clearance is 0.12 units.
A confirmed birth records the leg's birth close, freezes its movement scale, establishes its primary protected high or low, and starts its envelope. The frozen scale provides a consistent reference for measuring subsequent progress and retracement.
2 - FORMING AND TREND
DRIVE, FORMING and TREND describe the development of a directional leg. They are not trade-quality grades, confidence scores or entry instructions.
Phase advancement depends on favourable accepted-close progress from the confirmed birth close, measured using the movement scale frozen at birth. Accepted progress requires a new favourable closing extreme; a wick alone cannot promote the phase.
With the default settings, FORMING requires 0.50 scale units of favourable extension. TREND requires 2.0 units and at least three completed leg bars. The effective TREND threshold is kept above the FORMING threshold.
Elapsed time alone cannot promote DRIVE to FORMING or FORMING to TREND. The leg must achieve the required price progress.
3 - PULLBACK, GIVEBACK AND RECOVERY
These three concepts are related, but they are not interchangeable.
PULLBACK describes price moving against an active leg after a best accepted close has been established. It is a developing condition, not proof that the original leg has failed.
GIVEBACK measures how far the current close has retraced from the best accepted close, expressed in movement-scale units. The grey field below zero in the oscillator displays this retracement. With the default settings, the GIVEBACK phase begins at 0.35 scale units of retracement.
RECOVERY describes a developing response back toward the active leg's direction after GIVEBACK has begun. It is not a continuation trigger by itself.
A pullback can resolve in several ways. Accepted progress may resume; a sufficiently deep pullback followed by a local reclaim may qualify a continuation event; the move may stall and produce an exhaustion warning; or the primary protected structure may eventually fail. The model does not assume which outcome will follow.
CLOSE-UP: PULLBACK, GIVEBACK AND COUNTERTREND BOUNCE

This closer view shows how price retraces from a previous accepted close while the oscillator's grey field measures giveback. The sharp upward reaction within the later bearish leg is a countertrend bounce, not proof of a new bullish leg. A bounce alone does not confirm continuation, and the scanner's current state should be checked before describing a recovery as a confirmed model state.
4 - CONTINUATION TRIGGER
A continuation event requires a meaningful pullback followed by a confirmed close through a completed local reference in the active direction.
With the default settings, pullback depth must reach at least 0.25 movement-scale units. The local reclaim reference uses the preceding two bars, excluding the current candle. A bullish continuation requires a close above the preceding local high; a bearish continuation requires a close below the preceding local low.
Continuation is separate from phase advancement. It can qualify during DRIVE or FORMING, before the leg reaches TREND, provided the pullback and reclaim requirements are satisfied.
A continuation trigger identifies a confirmed price condition, not a complete trading plan. It does not guarantee follow-through or prescribe an entry, stop-loss, target or position size. It also does not move the primary protected high or low: that broader-leg reference remains anchored at the original leg's birth.
5 - EXHAUSTION WATCH
Exhaustion can occur during DRIVE, FORMING or TREND. It is a warning about weakening accepted progress, not a forecast of reversal.
The model requires sufficient giveback plus evidence of either a failed extension attempt or a sustained lack of new accepted progress.
The default giveback threshold is 0.40 movement-scale units during DRIVE and 0.70 units during FORMING or TREND. The failed-extension route uses a separate 0.05-unit buffer. The alternative stall route requires two bars without new accepted progress, alongside the applicable giveback threshold.
When the conditions qualify, the warning is latched rather than repeated as a fresh event on every bar. It rearms only after favourable accepted progress reaches the configured 0.75-unit threshold beyond the close recorded when the warning occurred.
An exhaustion warning does not mean the market must reverse. Price can continue in the same direction, pause, recover or eventually lose its protected structure. Multiple warnings may appear during a sustained move and should not be interpreted as independent calls for a market top or bottom.
6 - PRIMARY PROTECTED STRUCTURE AND REVERSAL CONFIRMATION
At leg birth, a bullish leg records a primary protected low and a bearish leg records a primary protected high. Each reference is derived from preceding bars inside the current segment. The default initial protected-structure window is four bars.
The primary reference stays anchored at birth. A later continuation trigger does not replace it with the most recent pullback extreme. This helps prevent a small counter-swing from automatically invalidating the broader directional leg.
A bullish structure is marked failed when a confirmed close falls below its primary protected low. A bearish structure is marked failed when a confirmed close rises above its primary protected high. Structure failure ends the old directional context, but does not by itself guarantee a successful opposite trend.
The default Opposite-Leg Confirmation mode is Structure Confirmed. An opposing drive must meet the normal drive conditions, agree with the protected-structure break, and satisfy an additional 0.30 movement-scale units of displacement. With the default birth threshold of 0.85 units, the total displacement requirement is 1.15 units, alongside the other drive and structural conditions.
If the primary structure fails before an opposing leg qualifies, the engine enters transition and expects the opposite direction. In this mode, it does not immediately restart the failed leg in its old direction. Balance may still be accepted during the transition.
The alternative Early Displacement mode permits a qualifying opposite drive to replace the active leg sooner, without waiting for the primary structure break and without the extra reversal-displacement buffer. It can recognise turns earlier, but may also produce more short-lived changes in choppy conditions.
Anchoring the primary protected level helps preserve broader-leg context through smaller counter-swings, but it can delay reversal recognition when the original level is far away. Neither confirmation mode is optimal for every market condition.
7 - BALANCE AND RELEASE
Balance is more than a small candle, a narrow range or a period in which price merely appears to move sideways. The model requires sufficient segment-local history, minimum range width relative to the movement scale, limited net displacement relative to the close-to-close path, a close reasonably near the range centre, and persistence across consecutive confirmed bars.
The defaults are a 12-bar observation window, 2.0 movement-scale units of minimum range width, 0.24 maximum directional efficiency, and four consecutive qualifying bars. After balance is accepted, its boundaries are stored. The grey fill becomes more prominent after eight bars by default; this visual emphasis is separate from the balance-acceptance requirement.
A confirmed close beyond a stored balance boundary by the configured release buffer releases the balance state. The default buffer is 0.10 movement-scale units. Release returns the model to directional qualification; the boundary break alone does not establish a new trend. A new leg must still satisfy its applicable conditions.
---
MOVEMENT SCALE
Thresholds are expressed in typical-movement units, not raw prices. The default, Median True Range (Gap-Filtered), uses a 20-sample lookback; a detected intraday gap bar contributes its high-low range instead of the full session jump. Median Close Travel measures typical absolute close-to-close movement and excludes samples spanning detected chart-time gaps. These are alternative movement measures, not trend signals. The selected scale is frozen at leg birth. Until a median is available, the current bar's range is used as a fallback. Results depend on symbol, timeframe, history and inputs.
---
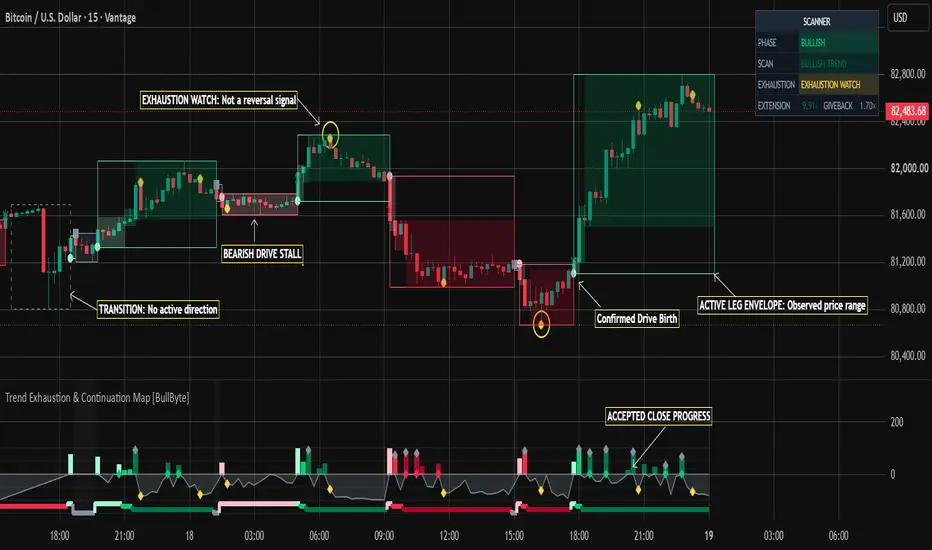
READING THE PRICE-CHART DRAWINGS
OUTER ENVELOPE - The frame records the observed high-low range of the active leg or accepted balance. It expands as additional bars contribute. It is not a projected range, stop-loss or target.
DIRECTIONAL PHASE BANDS - Inner fills show the range built during each phase; a completed band is preserved when a new phase begins. Bullish DRIVE/FORMING/TREND use light mint/green/deep green; bearish DRIVE/FORMING/TREND use light pink/red/deep red. Balance and transition use grey. Colour changes describe classification, not future strength.
TRANSITION ENVELOPE - A hollow dashed grey frame can appear after protected-structure failure or balance release when no new directional leg has qualified. It preserves context without showing the old direction as active. It is not a directional forecast.
PRICE-CHART MARKERS - Small bullish/bearish circles mark confirmed drive births. A translucent diamond can show a provisional birth during Live Preview; it may disappear before the candle closes. An X marks protected-structure failure, a grey square marks balance formation, and a yellow marker marks exhaustion. Continuation markers appear in the oscillator pane, where bullish and bearish events use their respective directional colours.
---
OSCILLATOR PANE: HOW TO READ IT
The lower pane represents accepted progress, giveback and the active phase. It is not an RSI-style overbought/oversold oscillator, a probability model or a buy/sell score.
ACCEPTED CLOSE EXTENSION - Positive columns show qualifying close movement transformed into bounded intensity. On the birth bar, the column uses that candle's close change from the previous bar, scaled by the movement yardstick; it does not plot the full multi-bar displacement test that qualified the birth. On later bars, a column appears when the close makes new favourable accepted progress beyond the previous best accepted close. The 100 reference is an intensity ceiling, not probability or return. No column does not automatically mean bearish pressure; it means no new qualifying accepted extension is shown.
GIVEBACK FIELD - The grey area below zero shows the distance from the best accepted close to the current close in movement-scale units. More-negative values indicate a larger retracement, not an independent oversold signal.
PHASE TRACK - The stepped track near the bottom of the pane identifies DRIVE, FORMING, TREND or BALANCE by its level, colour and direction. These are categorical display positions, not a numerical strength scale.
EVENT DIAMONDS - Grey marks accepted-progress milestones, directional diamonds at the baseline mark confirmed continuation, and yellow marks exhaustion. Use them with the chart and scanner; none is an order instruction.
---
THE SCANNER
PHASE - Confirmed direction: BULLISH, BEARISH or NEUTRAL. Balance appears as NEUTRAL here and is named in SCAN.
SCAN - Current condition, such as BULLISH DRIVE/FORMING/TREND, bearish equivalents, BALANCE, SCANNING or TRANSITION. Live Preview can show a provisional birth condition. Hover over SCAN for the latest confirmed event.
EXHAUSTION - Pullback state or latched warning, including NONE, PULLBACK ACTIVE, GIVEBACK, RECOVERY, DRIVE STALL, EXHAUSTION WATCH, STRUCTURE FAILED or BALANCE. A latched warning takes priority.
EXTENSION - Directional distance from the confirmed birth close, in scale units; it can be negative if price crosses the birth close against the active direction.
GIVEBACK - Distance from the best accepted close to the current close, in scale units. The × symbol is a movement-scale multiple, not a return multiplier, equity percentage or unrealised profit.
---
CONSOLIDATED EXAMPLE
Consider a hypothetical bullish sequence on a standard candlestick chart.
1 - A close above the preceding breakout reference, with sufficient displacement and efficiency, confirms bullish DRIVE.
2 - Accepted closes reach FORMING; greater extension plus the minimum bar count can establish TREND.
3 - A pullback expands giveback, but does not automatically make the leg bearish.
4 - After sufficient pullback depth, a close above the local reference high confirms bullish continuation. The pullback extreme does not replace the primary protected low.
5 - Sufficient giveback plus failed-extension or stall evidence can produce a latched exhaustion warning.
6 - A confirmed close below the original protected low fails bullish structure. In Structure Confirmed mode, a bearish replacement must meet the drive and added-displacement requirements; otherwise the engine stays in transition or can accept balance.
7 - A wide, inefficient, centred range that persists can become balance. Release returns the model to scanning; a boundary break alone is not a mature trend.
The bearish sequence uses the inverse logic. This example is illustrative only; it is not a recorded trade, backtest, or claim about accuracy.
---
REAL-CHART EXAMPLE: S&P 500 ON THE 5-MINUTE CHART
This example shows how Trend Exhaustion & Continuation Map follows a market through a sustained decline, a pause, a bullish recovery, a second advance, and a later bearish move.

1 - The initial selloff
Price establishes a bearish leg and moves substantially lower. Yellow exhaustion markers appear during the decline, identifying conditions associated with stalled or failed progress. However, the selloff continues. An exhaustion warning is not a prediction of a bottom.
2 - Balance after the decline
After the selloff, price settles into the solid grey balance envelope. The model has accepted a range that meets its width, efficiency, centring, and persistence requirements. Balance describes the current market condition; it does not predict the next breakout direction.
3 - The bullish recovery
A qualifying bullish drive follows the accepted balance. Price advances within the green leg envelope. As favourable closing progress increases, the model can advance from DRIVE to FORMING and then TREND. These phase changes depend on price progress, not simply on the passage of time.
4 - A second bullish leg
A brief accepted balance is followed by another qualifying bullish drive. The new green envelope records a separate leg rather than extending the previous one. This illustrates the distinction between a balance release and confirmation of a new directional leg.
5 - The opposing bearish leg
After the bullish advance, a bearish drive qualifies and price moves lower within the red envelope. The model distinguishes a qualifying opposing leg from an ordinary countertrend pullback, using its protected-structure and reversal-confirmation rules.
6 - The latest exhaustion warning
At the right side of the chart, the scanner reports BEARISH TREND and EXHAUSTION WATCH. A yellow marker near the later low indicates that the configured exhaustion conditions have been met. The bearish leg may continue, stabilise, or develop into a different qualifying state; the warning does not determine which outcome follows.
WHAT TO TAKE FROM THIS EXAMPLE
The indicator separates directional progress, exhaustion, balance, and new-leg qualification into distinct states. This helps traders interpret changing price behaviour without assuming that an exhaustion warning guarantees reversal or that a confirmed drive guarantees follow-through.
This is an illustration of the indicator on the displayed S&P 500 chart, not a backtest, trade recommendation, or claim of future performance.
---
SETTINGS AND DEFAULTS
The settings are available in the indicator's Settings panel. Inputs are hidden from the chart status line and Data Window to reduce clutter.
01 - Segment Boundaries: Gap reset is enabled by default at 3.0 chart-bar durations; it applies only intraday. Completed drawings remain.
02 - Movement Scale: Median True Range (Gap-Filtered) is default; Median Close Travel is the alternative. Lookback: 20 samples.
03 - Leg Detection: Displacement and breakout windows: four bars; birth displacement: 0.85 units; directional efficiency: 0.32; initial protected-structure window: four bars; breakout clearance: 0.12 units; opposite-leg mode: Structure Confirmed; added reversal displacement: 0.30 units. These are model thresholds, not universal constants.
04 - Phase Transitions: FORMING extension: 0.50 units; TREND extension: 2.0 units; minimum leg bars before TREND: three.
05 - Exhaustion: DRIVE giveback: 0.40 units; FORMING/TREND giveback: 0.70; failed-extension buffer: 0.05; stall requirement: two bars; rearming progress: 0.75 units.
06 - Continuation Scan: Local reclaim: two preceding bars; minimum pullback: 0.25 units; GIVEBACK phase threshold: 0.35; progress milestone: 1.0 unit.
07 - Balance: Observation window: 12 bars; maximum efficiency: 0.24; minimum width: 2.0 units; persistence: four bars; release buffer: 0.10 units; established-balance emphasis: eight bars.
08 - Visual System: Controls drawing retention, price/pane markers, giveback field and display mode. Live Preview can show provisional open-candle visuals; Confirmed Only holds display to completed-bar information. Confirmed event rules and alert timing are unchanged.
09 - Confirmed Alerts: Enables the consolidated alert and selects drive-birth, phase, continuation, warning/failure and balance event groups.
10 - Scanner: Controls scanner visibility and position.
Defaults are a starting point, not a claim of optimal performance. Test settings on the instruments and timeframes you use.
---
ALERT SETUP
Create one TradingView alert for this indicator and select "Any alert() function call". In Settings, enable confirmed alerts and select the event groups you want.
The available groups cover drive births, FORMING/TREND transitions, long/short continuation triggers, exhaustion warnings, protected-structure failures, balance formation and balance release. Enabled events occurring on the same confirmed candle are combined into one message with the symbol, timeframe, closing price and event names.
Alerts are generated on confirmed real-time bar closes. Historical markers are not replayed as historical alert notifications. Live Preview is visual only and is not a confirmed alert. If you change the event-group settings, recreate the alert so it uses the intended configuration.
---
TIMEFRAMES, CHART TYPES AND LIMITATIONS
The model is designed around intraday directional legs and session boundaries. It can run on other standard time-based candlestick resolutions, but event frequency and meaning vary by symbol, timeframe, session and volatility. There is no universally optimal timeframe established by this script. Use standard candles when evaluating its price events; Heikin Ashi, Renko and other synthetic chart types can produce a different event sequence because their displayed prices may be transformed.
The indicator does not detect or draw conventional order blocks (OB), fair value gaps (FVG), liquidity sweeps, volume imbalances, supply/demand zones or dedicated BOS/CHOCH patterns. Its prior-range break and protected-structure events are not specialised implementations of those separate concepts.
This indicator does not execute orders or provide complete entries, stops, targets or position sizing. It does not model volume confirmation, order-book data, news, fundamentals, commissions, slippage, execution quality or account-level risk. Accepted-progress intensity is not confidence, win probability or expected return.
---
DISCLAIMER
Trend Exhaustion & Continuation Map [BullByte] is an analytical charting tool for educational and research purposes. It is not investment advice, a recommendation to buy or sell any financial instrument, or an automated trading system.
No accuracy rate, win rate, return or profitability is claimed. A confirmed event means only that the configured conditions were satisfied on the relevant bar. It does not establish that a trade would be profitable or that price will continue in the indicated direction.
False starts, failed continuation attempts, further retracements after exhaustion and structural changes are possible. The primary protected level remains anchored at leg birth; this helps the leg tolerate smaller counter-swings but can delay reversal recognition when the original level is far away. Early Displacement mode favours earlier recognition at the cost of potentially more short-lived flips in choppy markets.
Users are responsible for validating the tool on relevant data and for all trading and investment decisions.
The goal is to separate leg birth, accepted progress, maturity, pullback, continuation, exhaustion, balance and failure into readable states. Treat each event as information - not a promise of what price must do next.
It helps traders assess a leg's development, accepted progress, pullback/continuation conditions and weakening structure. It is a market-context tool, not a standalone buy/sell system.
---
OVERVIEW AND DESIGN PURPOSE
A strong candle does not automatically establish a durable trend; a pullback is not automatically a reversal, and exhaustion does not guarantee a trend has ended. The indicator describes a leg's changing condition rather than predicting the next candle.
Three directional phases describe development:
• DRIVE - qualifying displacement, a preceding-range break and sufficient directional efficiency.
• FORMING - additional accepted closing progress beyond the confirmed birth close.
• TREND - a larger favourable extension plus the minimum completed-bar requirement.
The model also tracks pullback, giveback, recovery, continuation, exhaustion, structural failure, balance and balance release.
---
WHY A TRADER MAY USE IT
The challenge is often not spotting one strong candle; it is judging what happens after it. Has price made enough accepted progress to call the leg more mature? Is a pullback still contained by the original structure? Has a local reclaim qualified a continuation event? Is the move stalling, entering balance, or losing the level that defined the broader leg?
The map gives those questions separate, inspectable conditions. It is intended to support chart analysis, not replace market context or risk management. It does not decide whether a trade should be taken, and a displayed event is not an instruction to enter or exit.
---
WHY THESE COMPONENTS WORK TOGETHER
Displacement measures whether price travelled far enough; a preceding-range breakout tests structure; directional efficiency compares net displacement with the close-to-close path; and the movement scale adapts thresholds to typical price movement. Accepted-close progress distinguishes closing progress from a wick. Primary protected structure defines broader-leg failure, while pullback depth plus local reclaim qualify continuation. Balance uses range width, low directional efficiency, centring and persistence. The oscillator, drawings, scanner and alerts all use this same state engine.
This is a purpose-built price-state model, not a mash-up that simply stacks unrelated RSI, MACD, moving-average or other standard indicator plots. Its components serve one connected purpose: describing the development and possible failure of a directional leg.
---
HOW THE MODEL WORKS
The indicator follows a directional leg through its development, retracements, continuation attempts, exhaustion and possible structural failure. Each state describes a different aspect of price behaviour: a strong candle is not automatically a trend, a pullback is not automatically a reversal, and an exhaustion warning does not predict what happens next.
---
OVERVIEW: FOLLOWING A DIRECTIONAL LEG
1 - DRIVE BIRTH
A bullish or bearish drive qualifies only when several conditions agree. Price must show sufficient net displacement over the configured window, close beyond a preceding breakout reference by the required clearance, meet the directional-efficiency threshold, and close in the direction of travel. The engine also requires sufficient preceding history within the current segment. One large candle alone is not enough.
With the default settings, the displacement and breakout-reference windows are both four bars. Minimum birth displacement is 0.85 movement-scale units, directional efficiency is 0.32, and breakout clearance is 0.12 units.
A confirmed birth records the leg's birth close, freezes its movement scale, establishes its primary protected high or low, and starts its envelope. The frozen scale provides a consistent reference for measuring subsequent progress and retracement.
2 - FORMING AND TREND
DRIVE, FORMING and TREND describe the development of a directional leg. They are not trade-quality grades, confidence scores or entry instructions.
Phase advancement depends on favourable accepted-close progress from the confirmed birth close, measured using the movement scale frozen at birth. Accepted progress requires a new favourable closing extreme; a wick alone cannot promote the phase.
With the default settings, FORMING requires 0.50 scale units of favourable extension. TREND requires 2.0 units and at least three completed leg bars. The effective TREND threshold is kept above the FORMING threshold.
Elapsed time alone cannot promote DRIVE to FORMING or FORMING to TREND. The leg must achieve the required price progress.
3 - PULLBACK, GIVEBACK AND RECOVERY
These three concepts are related, but they are not interchangeable.
PULLBACK describes price moving against an active leg after a best accepted close has been established. It is a developing condition, not proof that the original leg has failed.
GIVEBACK measures how far the current close has retraced from the best accepted close, expressed in movement-scale units. The grey field below zero in the oscillator displays this retracement. With the default settings, the GIVEBACK phase begins at 0.35 scale units of retracement.
RECOVERY describes a developing response back toward the active leg's direction after GIVEBACK has begun. It is not a continuation trigger by itself.
A pullback can resolve in several ways. Accepted progress may resume; a sufficiently deep pullback followed by a local reclaim may qualify a continuation event; the move may stall and produce an exhaustion warning; or the primary protected structure may eventually fail. The model does not assume which outcome will follow.
CLOSE-UP: PULLBACK, GIVEBACK AND COUNTERTREND BOUNCE
This closer view shows how price retraces from a previous accepted close while the oscillator's grey field measures giveback. The sharp upward reaction within the later bearish leg is a countertrend bounce, not proof of a new bullish leg. A bounce alone does not confirm continuation, and the scanner's current state should be checked before describing a recovery as a confirmed model state.
4 - CONTINUATION TRIGGER
A continuation event requires a meaningful pullback followed by a confirmed close through a completed local reference in the active direction.
With the default settings, pullback depth must reach at least 0.25 movement-scale units. The local reclaim reference uses the preceding two bars, excluding the current candle. A bullish continuation requires a close above the preceding local high; a bearish continuation requires a close below the preceding local low.
Continuation is separate from phase advancement. It can qualify during DRIVE or FORMING, before the leg reaches TREND, provided the pullback and reclaim requirements are satisfied.
A continuation trigger identifies a confirmed price condition, not a complete trading plan. It does not guarantee follow-through or prescribe an entry, stop-loss, target or position size. It also does not move the primary protected high or low: that broader-leg reference remains anchored at the original leg's birth.
5 - EXHAUSTION WATCH
Exhaustion can occur during DRIVE, FORMING or TREND. It is a warning about weakening accepted progress, not a forecast of reversal.
The model requires sufficient giveback plus evidence of either a failed extension attempt or a sustained lack of new accepted progress.
The default giveback threshold is 0.40 movement-scale units during DRIVE and 0.70 units during FORMING or TREND. The failed-extension route uses a separate 0.05-unit buffer. The alternative stall route requires two bars without new accepted progress, alongside the applicable giveback threshold.
When the conditions qualify, the warning is latched rather than repeated as a fresh event on every bar. It rearms only after favourable accepted progress reaches the configured 0.75-unit threshold beyond the close recorded when the warning occurred.
An exhaustion warning does not mean the market must reverse. Price can continue in the same direction, pause, recover or eventually lose its protected structure. Multiple warnings may appear during a sustained move and should not be interpreted as independent calls for a market top or bottom.
6 - PRIMARY PROTECTED STRUCTURE AND REVERSAL CONFIRMATION
At leg birth, a bullish leg records a primary protected low and a bearish leg records a primary protected high. Each reference is derived from preceding bars inside the current segment. The default initial protected-structure window is four bars.
The primary reference stays anchored at birth. A later continuation trigger does not replace it with the most recent pullback extreme. This helps prevent a small counter-swing from automatically invalidating the broader directional leg.
A bullish structure is marked failed when a confirmed close falls below its primary protected low. A bearish structure is marked failed when a confirmed close rises above its primary protected high. Structure failure ends the old directional context, but does not by itself guarantee a successful opposite trend.
The default Opposite-Leg Confirmation mode is Structure Confirmed. An opposing drive must meet the normal drive conditions, agree with the protected-structure break, and satisfy an additional 0.30 movement-scale units of displacement. With the default birth threshold of 0.85 units, the total displacement requirement is 1.15 units, alongside the other drive and structural conditions.
If the primary structure fails before an opposing leg qualifies, the engine enters transition and expects the opposite direction. In this mode, it does not immediately restart the failed leg in its old direction. Balance may still be accepted during the transition.
The alternative Early Displacement mode permits a qualifying opposite drive to replace the active leg sooner, without waiting for the primary structure break and without the extra reversal-displacement buffer. It can recognise turns earlier, but may also produce more short-lived changes in choppy conditions.
Anchoring the primary protected level helps preserve broader-leg context through smaller counter-swings, but it can delay reversal recognition when the original level is far away. Neither confirmation mode is optimal for every market condition.
7 - BALANCE AND RELEASE
Balance is more than a small candle, a narrow range or a period in which price merely appears to move sideways. The model requires sufficient segment-local history, minimum range width relative to the movement scale, limited net displacement relative to the close-to-close path, a close reasonably near the range centre, and persistence across consecutive confirmed bars.
The defaults are a 12-bar observation window, 2.0 movement-scale units of minimum range width, 0.24 maximum directional efficiency, and four consecutive qualifying bars. After balance is accepted, its boundaries are stored. The grey fill becomes more prominent after eight bars by default; this visual emphasis is separate from the balance-acceptance requirement.
A confirmed close beyond a stored balance boundary by the configured release buffer releases the balance state. The default buffer is 0.10 movement-scale units. Release returns the model to directional qualification; the boundary break alone does not establish a new trend. A new leg must still satisfy its applicable conditions.
---
MOVEMENT SCALE
Thresholds are expressed in typical-movement units, not raw prices. The default, Median True Range (Gap-Filtered), uses a 20-sample lookback; a detected intraday gap bar contributes its high-low range instead of the full session jump. Median Close Travel measures typical absolute close-to-close movement and excludes samples spanning detected chart-time gaps. These are alternative movement measures, not trend signals. The selected scale is frozen at leg birth. Until a median is available, the current bar's range is used as a fallback. Results depend on symbol, timeframe, history and inputs.
---
READING THE PRICE-CHART DRAWINGS
OUTER ENVELOPE - The frame records the observed high-low range of the active leg or accepted balance. It expands as additional bars contribute. It is not a projected range, stop-loss or target.
DIRECTIONAL PHASE BANDS - Inner fills show the range built during each phase; a completed band is preserved when a new phase begins. Bullish DRIVE/FORMING/TREND use light mint/green/deep green; bearish DRIVE/FORMING/TREND use light pink/red/deep red. Balance and transition use grey. Colour changes describe classification, not future strength.
TRANSITION ENVELOPE - A hollow dashed grey frame can appear after protected-structure failure or balance release when no new directional leg has qualified. It preserves context without showing the old direction as active. It is not a directional forecast.
PRICE-CHART MARKERS - Small bullish/bearish circles mark confirmed drive births. A translucent diamond can show a provisional birth during Live Preview; it may disappear before the candle closes. An X marks protected-structure failure, a grey square marks balance formation, and a yellow marker marks exhaustion. Continuation markers appear in the oscillator pane, where bullish and bearish events use their respective directional colours.
---
OSCILLATOR PANE: HOW TO READ IT
The lower pane represents accepted progress, giveback and the active phase. It is not an RSI-style overbought/oversold oscillator, a probability model or a buy/sell score.
ACCEPTED CLOSE EXTENSION - Positive columns show qualifying close movement transformed into bounded intensity. On the birth bar, the column uses that candle's close change from the previous bar, scaled by the movement yardstick; it does not plot the full multi-bar displacement test that qualified the birth. On later bars, a column appears when the close makes new favourable accepted progress beyond the previous best accepted close. The 100 reference is an intensity ceiling, not probability or return. No column does not automatically mean bearish pressure; it means no new qualifying accepted extension is shown.
GIVEBACK FIELD - The grey area below zero shows the distance from the best accepted close to the current close in movement-scale units. More-negative values indicate a larger retracement, not an independent oversold signal.
PHASE TRACK - The stepped track near the bottom of the pane identifies DRIVE, FORMING, TREND or BALANCE by its level, colour and direction. These are categorical display positions, not a numerical strength scale.
EVENT DIAMONDS - Grey marks accepted-progress milestones, directional diamonds at the baseline mark confirmed continuation, and yellow marks exhaustion. Use them with the chart and scanner; none is an order instruction.
---
THE SCANNER
PHASE - Confirmed direction: BULLISH, BEARISH or NEUTRAL. Balance appears as NEUTRAL here and is named in SCAN.
SCAN - Current condition, such as BULLISH DRIVE/FORMING/TREND, bearish equivalents, BALANCE, SCANNING or TRANSITION. Live Preview can show a provisional birth condition. Hover over SCAN for the latest confirmed event.
EXHAUSTION - Pullback state or latched warning, including NONE, PULLBACK ACTIVE, GIVEBACK, RECOVERY, DRIVE STALL, EXHAUSTION WATCH, STRUCTURE FAILED or BALANCE. A latched warning takes priority.
EXTENSION - Directional distance from the confirmed birth close, in scale units; it can be negative if price crosses the birth close against the active direction.
GIVEBACK - Distance from the best accepted close to the current close, in scale units. The × symbol is a movement-scale multiple, not a return multiplier, equity percentage or unrealised profit.
---
CONSOLIDATED EXAMPLE
Consider a hypothetical bullish sequence on a standard candlestick chart.
1 - A close above the preceding breakout reference, with sufficient displacement and efficiency, confirms bullish DRIVE.
2 - Accepted closes reach FORMING; greater extension plus the minimum bar count can establish TREND.
3 - A pullback expands giveback, but does not automatically make the leg bearish.
4 - After sufficient pullback depth, a close above the local reference high confirms bullish continuation. The pullback extreme does not replace the primary protected low.
5 - Sufficient giveback plus failed-extension or stall evidence can produce a latched exhaustion warning.
6 - A confirmed close below the original protected low fails bullish structure. In Structure Confirmed mode, a bearish replacement must meet the drive and added-displacement requirements; otherwise the engine stays in transition or can accept balance.
7 - A wide, inefficient, centred range that persists can become balance. Release returns the model to scanning; a boundary break alone is not a mature trend.
The bearish sequence uses the inverse logic. This example is illustrative only; it is not a recorded trade, backtest, or claim about accuracy.
---
REAL-CHART EXAMPLE: S&P 500 ON THE 5-MINUTE CHART
This example shows how Trend Exhaustion & Continuation Map follows a market through a sustained decline, a pause, a bullish recovery, a second advance, and a later bearish move.
1 - The initial selloff
Price establishes a bearish leg and moves substantially lower. Yellow exhaustion markers appear during the decline, identifying conditions associated with stalled or failed progress. However, the selloff continues. An exhaustion warning is not a prediction of a bottom.
2 - Balance after the decline
After the selloff, price settles into the solid grey balance envelope. The model has accepted a range that meets its width, efficiency, centring, and persistence requirements. Balance describes the current market condition; it does not predict the next breakout direction.
3 - The bullish recovery
A qualifying bullish drive follows the accepted balance. Price advances within the green leg envelope. As favourable closing progress increases, the model can advance from DRIVE to FORMING and then TREND. These phase changes depend on price progress, not simply on the passage of time.
4 - A second bullish leg
A brief accepted balance is followed by another qualifying bullish drive. The new green envelope records a separate leg rather than extending the previous one. This illustrates the distinction between a balance release and confirmation of a new directional leg.
5 - The opposing bearish leg
After the bullish advance, a bearish drive qualifies and price moves lower within the red envelope. The model distinguishes a qualifying opposing leg from an ordinary countertrend pullback, using its protected-structure and reversal-confirmation rules.
6 - The latest exhaustion warning
At the right side of the chart, the scanner reports BEARISH TREND and EXHAUSTION WATCH. A yellow marker near the later low indicates that the configured exhaustion conditions have been met. The bearish leg may continue, stabilise, or develop into a different qualifying state; the warning does not determine which outcome follows.
WHAT TO TAKE FROM THIS EXAMPLE
The indicator separates directional progress, exhaustion, balance, and new-leg qualification into distinct states. This helps traders interpret changing price behaviour without assuming that an exhaustion warning guarantees reversal or that a confirmed drive guarantees follow-through.
This is an illustration of the indicator on the displayed S&P 500 chart, not a backtest, trade recommendation, or claim of future performance.
---
SETTINGS AND DEFAULTS
The settings are available in the indicator's Settings panel. Inputs are hidden from the chart status line and Data Window to reduce clutter.
01 - Segment Boundaries: Gap reset is enabled by default at 3.0 chart-bar durations; it applies only intraday. Completed drawings remain.
02 - Movement Scale: Median True Range (Gap-Filtered) is default; Median Close Travel is the alternative. Lookback: 20 samples.
03 - Leg Detection: Displacement and breakout windows: four bars; birth displacement: 0.85 units; directional efficiency: 0.32; initial protected-structure window: four bars; breakout clearance: 0.12 units; opposite-leg mode: Structure Confirmed; added reversal displacement: 0.30 units. These are model thresholds, not universal constants.
04 - Phase Transitions: FORMING extension: 0.50 units; TREND extension: 2.0 units; minimum leg bars before TREND: three.
05 - Exhaustion: DRIVE giveback: 0.40 units; FORMING/TREND giveback: 0.70; failed-extension buffer: 0.05; stall requirement: two bars; rearming progress: 0.75 units.
06 - Continuation Scan: Local reclaim: two preceding bars; minimum pullback: 0.25 units; GIVEBACK phase threshold: 0.35; progress milestone: 1.0 unit.
07 - Balance: Observation window: 12 bars; maximum efficiency: 0.24; minimum width: 2.0 units; persistence: four bars; release buffer: 0.10 units; established-balance emphasis: eight bars.
08 - Visual System: Controls drawing retention, price/pane markers, giveback field and display mode. Live Preview can show provisional open-candle visuals; Confirmed Only holds display to completed-bar information. Confirmed event rules and alert timing are unchanged.
09 - Confirmed Alerts: Enables the consolidated alert and selects drive-birth, phase, continuation, warning/failure and balance event groups.
10 - Scanner: Controls scanner visibility and position.
Defaults are a starting point, not a claim of optimal performance. Test settings on the instruments and timeframes you use.
---
ALERT SETUP
Create one TradingView alert for this indicator and select "Any alert() function call". In Settings, enable confirmed alerts and select the event groups you want.
The available groups cover drive births, FORMING/TREND transitions, long/short continuation triggers, exhaustion warnings, protected-structure failures, balance formation and balance release. Enabled events occurring on the same confirmed candle are combined into one message with the symbol, timeframe, closing price and event names.
Alerts are generated on confirmed real-time bar closes. Historical markers are not replayed as historical alert notifications. Live Preview is visual only and is not a confirmed alert. If you change the event-group settings, recreate the alert so it uses the intended configuration.
---
TIMEFRAMES, CHART TYPES AND LIMITATIONS
The model is designed around intraday directional legs and session boundaries. It can run on other standard time-based candlestick resolutions, but event frequency and meaning vary by symbol, timeframe, session and volatility. There is no universally optimal timeframe established by this script. Use standard candles when evaluating its price events; Heikin Ashi, Renko and other synthetic chart types can produce a different event sequence because their displayed prices may be transformed.
The indicator does not detect or draw conventional order blocks (OB), fair value gaps (FVG), liquidity sweeps, volume imbalances, supply/demand zones or dedicated BOS/CHOCH patterns. Its prior-range break and protected-structure events are not specialised implementations of those separate concepts.
This indicator does not execute orders or provide complete entries, stops, targets or position sizing. It does not model volume confirmation, order-book data, news, fundamentals, commissions, slippage, execution quality or account-level risk. Accepted-progress intensity is not confidence, win probability or expected return.
---
DISCLAIMER
Trend Exhaustion & Continuation Map [BullByte] is an analytical charting tool for educational and research purposes. It is not investment advice, a recommendation to buy or sell any financial instrument, or an automated trading system.
No accuracy rate, win rate, return or profitability is claimed. A confirmed event means only that the configured conditions were satisfied on the relevant bar. It does not establish that a trade would be profitable or that price will continue in the indicated direction.
False starts, failed continuation attempts, further retracements after exhaustion and structural changes are possible. The primary protected level remains anchored at leg birth; this helps the leg tolerate smaller counter-swings but can delay reversal recognition when the original level is far away. Early Displacement mode favours earlier recognition at the cost of potentially more short-lived flips in choppy markets.
Users are responsible for validating the tool on relevant data and for all trading and investment decisions.
The goal is to separate leg birth, accepted progress, maturity, pullback, continuation, exhaustion, balance and failure into readable states. Treat each event as information - not a promise of what price must do next.

💎 BullByte Top Tools | Paid Space : in.tradingview.com/spaces/BullByte/
💬 Join the community: Telegram
t.me/BullByteTradingLab
⚡FOLLOW for New Indicator releases!
💬 Join the community: Telegram
t.me/BullByteTradingLab
⚡FOLLOW for New Indicator releases!
כתב ויתור
המידע והפרסומים אינם מיועדים להיות, ואינם מהווים, ייעוץ או המלצה פיננסית, השקעתית, מסחרית או מכל סוג אחר המסופקת או מאושרת על ידי TradingView. קרא עוד ב־תנאי השימוש.
💎 BullByte Top Tools | Paid Space : in.tradingview.com/spaces/BullByte/
💬 Join the community: Telegram
t.me/BullByteTradingLab
⚡FOLLOW for New Indicator releases!
💬 Join the community: Telegram
t.me/BullByteTradingLab
⚡FOLLOW for New Indicator releases!
כתב ויתור
המידע והפרסומים אינם מיועדים להיות, ואינם מהווים, ייעוץ או המלצה פיננסית, השקעתית, מסחרית או מכל סוג אחר המסופקת או מאושרת על ידי TradingView. קרא עוד ב־תנאי השימוש.