OPEN-SOURCE SCRIPT
Hash Auto Fibonacci
## Overview
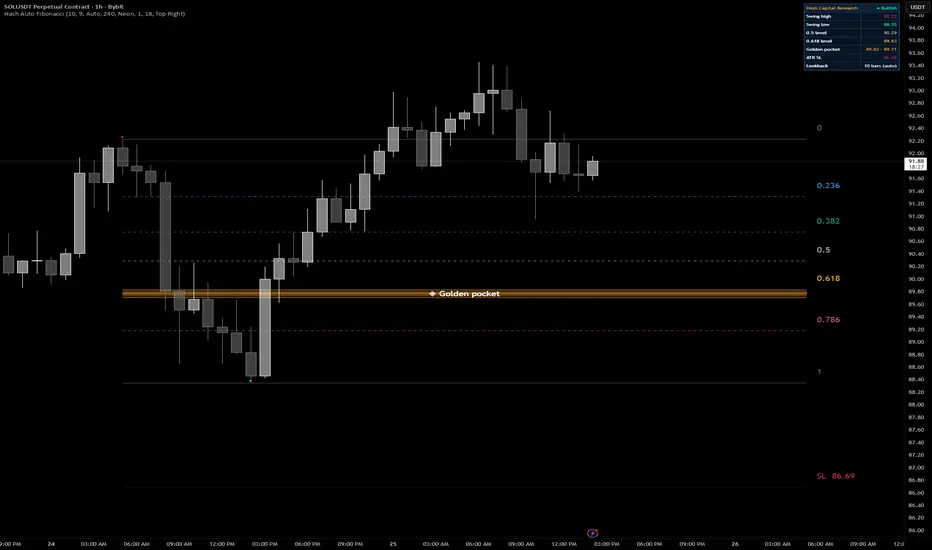
Hash Auto Fibonacci eliminates the most time-consuming part of Fibonacci trading — drawing the levels yourself. Drop it on any chart and it automatically detects the most recent significant swing high and swing low, then instantly draws a complete Fibonacci retracement web anchored to those pivots. No manual drawing, no subjectivity, no missed setups.
Built for active traders who use Fibonacci as a core part of their strategy, this tool is engineered to keep up with fast-moving markets through a volatility-adaptive detection engine, a highlighted Golden Pocket zone, a built-in stop-loss reference, and optional multi-timeframe confirmation.
## Key Features
**Automatic Swing Detection**
The indicator uses a pivot-based algorithm to identify swing highs and lows in real time. A pink dot marks the swing high and a green dot marks the swing low on the chart — always showing only the current active pair, never cluttering your screen with historical markers.
**Dynamic Lookback Engine**
Rather than using a fixed lookback period, Hash Auto Fibonacci automatically adjusts its sensitivity based on current market volatility. During high-volatility conditions (fast trending moves, breakouts), the lookback shortens to detect swings quickly. During low-volatility conditions (consolidation, ranging markets), it lengthens to filter out noise and identify only meaningful pivots. This is calculated using the ratio of a 50-period ATR to a 10-period ATR, scaled by a user-adjustable multiplier. You can also switch to a fixed manual lookback at any time.
**Fibonacci Retracement Levels**
The following retracement levels are drawn automatically:
- 0 (swing high anchor)
- 0.236
- 0.382
- 0.5
- 0.618
- 0.65
- 0.786
- 1.0 (swing low anchor)
Optional extension levels (1.272, 1.618, 2.618) can be enabled for targets beyond the swing low.
**The Golden Pocket Zone**
The 0.618–0.65 confluence zone is highlighted as a gradient-filled amber band directly on the chart. This region — known as the Golden Pocket — is widely regarded as the highest-probability reversal zone within any Fibonacci retracement. The zone enforces an ATR-based minimum thickness so it remains visible even on assets with small absolute price ranges.
**ATR Stop-Loss Reference**
A dashed red line is automatically drawn below the swing low (bullish setup) or above the swing high (bearish setup) at a distance of 2× ATR-10. This gives a data-driven starting point for your stop-loss placement without requiring a separate indicator.
**Multi-Timeframe Confirmation**
When the current chart's swing pivot aligns within 0.5% of a confirmed pivot on a higher timeframe (default: 4H), the entire Fibonacci web is visually upgraded — lines become bolder, a confirmation badge appears, and an alert can be triggered. MTF-confirmed webs represent structurally significant levels that multiple timeframes agree on, which historically carry more weight as support and resistance.
**Direction Detection**
The indicator automatically determines whether the current setup is bullish (retracing upward from a low) or bearish (retracing downward from a high) by comparing which pivot — the high or the low — was confirmed most recently. You can override this manually if needed.
**Info Dashboard**
A clean navy dashboard in the corner of your chart displays:
- Current swing high and swing low prices
- 0.5 and 0.618 Fibonacci levels
- Golden Pocket price range
- Suggested ATR-based stop-loss price
- Active lookback period (and whether it's dynamic or manual)
---
## How To Use
**Basic setup**
Add the indicator to any chart. It works on all timeframes and all assets — crypto, stocks, forex, futures. The Fibonacci web draws automatically. The Golden Pocket zone is the primary area to watch for price reactions.
**Reading the chart**
- Price pulling back into the Golden Pocket (0.618–0.65 zone) in a bullish setup is the classic high-probability long entry zone
- Price rejecting from the Golden Pocket in a bearish setup is a potential short entry or profit-taking zone
- The 0.5 level acts as the midpoint — a close above (bullish) or below (bearish) confirms continuation of the retracement
- The 0.786 level is deep — a sweep past this level often signals the retracement is becoming a full reversal
**Using the stop-loss line**
The dashed red SL line is a reference, not a guaranteed stop placement. Use it as a starting point and adjust to your own risk tolerance. On volatile assets, consider placing your stop slightly beyond it to avoid wicks triggering your exit prematurely.
**Multi-timeframe confirmation**
When the ◆ MTF badge appears, the swing that anchors the current web also exists on the higher timeframe. These setups tend to produce cleaner reactions at Fibonacci levels because they represent areas where both short-term and institutional timeframe participants are watching the same price zone.
**Alerts**
Five alert conditions are available:
- New swing high detected
- New swing low detected
- MTF confirmation active
- Price entering the Golden Pocket
- Price at the 0.382 level
- Price at the 0.786 level
Set these in the Alerts panel to get notified without watching the chart constantly.
---
## Settings Reference
**Swing Detection**
| Setting | Default | Description |
|---|---|---|
| Dynamic lookback | On | Automatically adjusts pivot sensitivity based on volatility |
| Manual lookback | 10 | Fixed lookback used when dynamic mode is off |
| Dynamic multiplier | 9 | Controls the average lookback length in dynamic mode |
| Direction mode | Auto | Auto, Bullish, or Bearish override |
| Show swing markers | On | Displays pivot dots on the chart |
**Multi-Timeframe Confirmation**
| Setting | Default | Description |
|---|---|---|
| MTF confirmation | On | Enables higher timeframe pivot alignment check |
| HTF timeframe | 240 (4H) | The timeframe used for confirmation pivots |
**Fibonacci Levels**
| Setting | Default | Description |
|---|---|---|
| Retracement levels | On | Draws the standard 0–1 retracement web |
| Extension levels | Off | Adds 1.272, 1.618, 2.618 extension targets |
| Ratio labels | On | Shows ratio numbers next to each level |
| Golden Pocket zone | On | Highlights the 0.618–0.65 zone |
| ATR stop-loss line | On | Draws the 2× ATR stop reference |
**Info Table**
| Setting | Default | Description |
|---|---|---|
| Show info table | On | Displays the dashboard |
| Position | Top Right | Corner placement of the dashboard |
---
## Notes
- This indicator is an overlay — it draws directly on the price chart
- Works on all timeframes, all markets, and all asset classes available on TradingView
- The dynamic lookback is calibrated on BTC/USDT 1H data and performs well across most liquid crypto and equity instruments
- Past Fibonacci levels do not guarantee future price reactions — use this tool as part of a broader trading system, not as a standalone signal
- This indicator does not repaint. Swing pivots are confirmed before being drawn and are not subject to change after confirmation
---
## By Hash Capital Research
Hash Auto Fibonacci eliminates the most time-consuming part of Fibonacci trading — drawing the levels yourself. Drop it on any chart and it automatically detects the most recent significant swing high and swing low, then instantly draws a complete Fibonacci retracement web anchored to those pivots. No manual drawing, no subjectivity, no missed setups.
Built for active traders who use Fibonacci as a core part of their strategy, this tool is engineered to keep up with fast-moving markets through a volatility-adaptive detection engine, a highlighted Golden Pocket zone, a built-in stop-loss reference, and optional multi-timeframe confirmation.
## Key Features
**Automatic Swing Detection**
The indicator uses a pivot-based algorithm to identify swing highs and lows in real time. A pink dot marks the swing high and a green dot marks the swing low on the chart — always showing only the current active pair, never cluttering your screen with historical markers.
**Dynamic Lookback Engine**
Rather than using a fixed lookback period, Hash Auto Fibonacci automatically adjusts its sensitivity based on current market volatility. During high-volatility conditions (fast trending moves, breakouts), the lookback shortens to detect swings quickly. During low-volatility conditions (consolidation, ranging markets), it lengthens to filter out noise and identify only meaningful pivots. This is calculated using the ratio of a 50-period ATR to a 10-period ATR, scaled by a user-adjustable multiplier. You can also switch to a fixed manual lookback at any time.
**Fibonacci Retracement Levels**
The following retracement levels are drawn automatically:
- 0 (swing high anchor)
- 0.236
- 0.382
- 0.5
- 0.618
- 0.65
- 0.786
- 1.0 (swing low anchor)
Optional extension levels (1.272, 1.618, 2.618) can be enabled for targets beyond the swing low.
**The Golden Pocket Zone**
The 0.618–0.65 confluence zone is highlighted as a gradient-filled amber band directly on the chart. This region — known as the Golden Pocket — is widely regarded as the highest-probability reversal zone within any Fibonacci retracement. The zone enforces an ATR-based minimum thickness so it remains visible even on assets with small absolute price ranges.
**ATR Stop-Loss Reference**
A dashed red line is automatically drawn below the swing low (bullish setup) or above the swing high (bearish setup) at a distance of 2× ATR-10. This gives a data-driven starting point for your stop-loss placement without requiring a separate indicator.
**Multi-Timeframe Confirmation**
When the current chart's swing pivot aligns within 0.5% of a confirmed pivot on a higher timeframe (default: 4H), the entire Fibonacci web is visually upgraded — lines become bolder, a confirmation badge appears, and an alert can be triggered. MTF-confirmed webs represent structurally significant levels that multiple timeframes agree on, which historically carry more weight as support and resistance.
**Direction Detection**
The indicator automatically determines whether the current setup is bullish (retracing upward from a low) or bearish (retracing downward from a high) by comparing which pivot — the high or the low — was confirmed most recently. You can override this manually if needed.
**Info Dashboard**
A clean navy dashboard in the corner of your chart displays:
- Current swing high and swing low prices
- 0.5 and 0.618 Fibonacci levels
- Golden Pocket price range
- Suggested ATR-based stop-loss price
- Active lookback period (and whether it's dynamic or manual)
---
## How To Use
**Basic setup**
Add the indicator to any chart. It works on all timeframes and all assets — crypto, stocks, forex, futures. The Fibonacci web draws automatically. The Golden Pocket zone is the primary area to watch for price reactions.
**Reading the chart**
- Price pulling back into the Golden Pocket (0.618–0.65 zone) in a bullish setup is the classic high-probability long entry zone
- Price rejecting from the Golden Pocket in a bearish setup is a potential short entry or profit-taking zone
- The 0.5 level acts as the midpoint — a close above (bullish) or below (bearish) confirms continuation of the retracement
- The 0.786 level is deep — a sweep past this level often signals the retracement is becoming a full reversal
**Using the stop-loss line**
The dashed red SL line is a reference, not a guaranteed stop placement. Use it as a starting point and adjust to your own risk tolerance. On volatile assets, consider placing your stop slightly beyond it to avoid wicks triggering your exit prematurely.
**Multi-timeframe confirmation**
When the ◆ MTF badge appears, the swing that anchors the current web also exists on the higher timeframe. These setups tend to produce cleaner reactions at Fibonacci levels because they represent areas where both short-term and institutional timeframe participants are watching the same price zone.
**Alerts**
Five alert conditions are available:
- New swing high detected
- New swing low detected
- MTF confirmation active
- Price entering the Golden Pocket
- Price at the 0.382 level
- Price at the 0.786 level
Set these in the Alerts panel to get notified without watching the chart constantly.
---
## Settings Reference
**Swing Detection**
| Setting | Default | Description |
|---|---|---|
| Dynamic lookback | On | Automatically adjusts pivot sensitivity based on volatility |
| Manual lookback | 10 | Fixed lookback used when dynamic mode is off |
| Dynamic multiplier | 9 | Controls the average lookback length in dynamic mode |
| Direction mode | Auto | Auto, Bullish, or Bearish override |
| Show swing markers | On | Displays pivot dots on the chart |
**Multi-Timeframe Confirmation**
| Setting | Default | Description |
|---|---|---|
| MTF confirmation | On | Enables higher timeframe pivot alignment check |
| HTF timeframe | 240 (4H) | The timeframe used for confirmation pivots |
**Fibonacci Levels**
| Setting | Default | Description |
|---|---|---|
| Retracement levels | On | Draws the standard 0–1 retracement web |
| Extension levels | Off | Adds 1.272, 1.618, 2.618 extension targets |
| Ratio labels | On | Shows ratio numbers next to each level |
| Golden Pocket zone | On | Highlights the 0.618–0.65 zone |
| ATR stop-loss line | On | Draws the 2× ATR stop reference |
**Info Table**
| Setting | Default | Description |
|---|---|---|
| Show info table | On | Displays the dashboard |
| Position | Top Right | Corner placement of the dashboard |
---
## Notes
- This indicator is an overlay — it draws directly on the price chart
- Works on all timeframes, all markets, and all asset classes available on TradingView
- The dynamic lookback is calibrated on BTC/USDT 1H data and performs well across most liquid crypto and equity instruments
- Past Fibonacci levels do not guarantee future price reactions — use this tool as part of a broader trading system, not as a standalone signal
- This indicator does not repaint. Swing pivots are confirmed before being drawn and are not subject to change after confirmation
---
## By Hash Capital Research
סקריפט קוד פתוח
ברוח האמיתית של TradingView, יוצר הסקריפט הזה הפך אותו לקוד פתוח, כך שסוחרים יוכלו לעיין בו ולאמת את פעולתו. כל הכבוד למחבר! אמנם ניתן להשתמש בו בחינם, אך זכור כי פרסום חוזר של הקוד כפוף ל־כללי הבית שלנו.

Quant research firm developing proprietary indicators, trading automation, and risk frameworks for digital & macro markets.
כתב ויתור
המידע והפרסומים אינם מיועדים להיות, ואינם מהווים, ייעוץ או המלצה פיננסית, השקעתית, מסחרית או מכל סוג אחר המסופקת או מאושרת על ידי TradingView. קרא עוד ב־תנאי השימוש.
סקריפט קוד פתוח
ברוח האמיתית של TradingView, יוצר הסקריפט הזה הפך אותו לקוד פתוח, כך שסוחרים יוכלו לעיין בו ולאמת את פעולתו. כל הכבוד למחבר! אמנם ניתן להשתמש בו בחינם, אך זכור כי פרסום חוזר של הקוד כפוף ל־כללי הבית שלנו.
Quant research firm developing proprietary indicators, trading automation, and risk frameworks for digital & macro markets.
כתב ויתור
המידע והפרסומים אינם מיועדים להיות, ואינם מהווים, ייעוץ או המלצה פיננסית, השקעתית, מסחרית או מכל סוג אחר המסופקת או מאושרת על ידי TradingView. קרא עוד ב־תנאי השימוש.