Stochastic Momentum Index (SMI) Signals + Stats [ForexCracked]
🔵 OVERVIEW
The Stochastic Momentum Index shows where the close sits inside the recent range. This version also shows what its turns have done on the chart in front of you.
The SMI line itself is William Blau's formula, and TradingView ships a built-in version of it. This script is about what happens after the line turns. Every signal gets a plan, every plan is followed to its outcome, and the same plan is also opened on every bar of the chart and counted the same way. That last comparison is the reason the script exists: it shows whether SMI timing did better than entering anywhere.
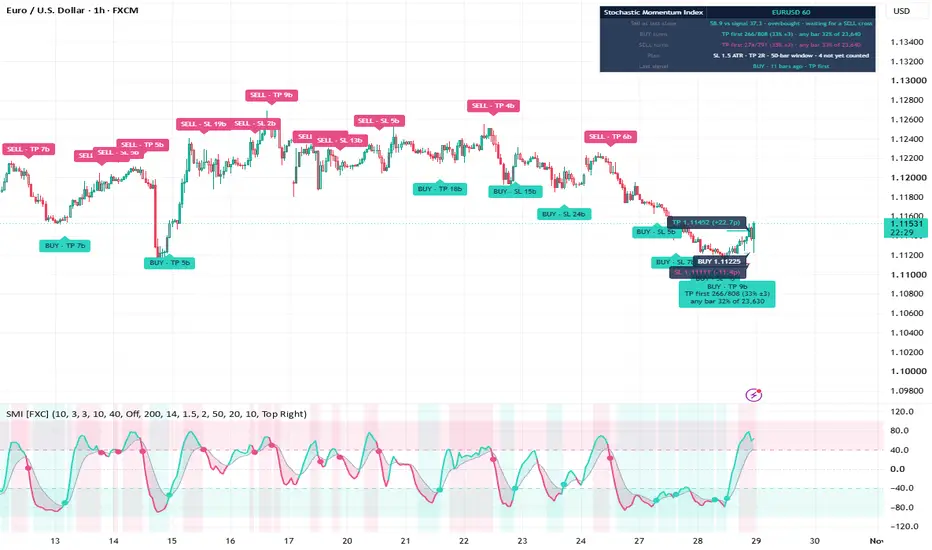
The SMI stays in its own pane, with its signal line and the overbought and oversold zones at plus and minus 40. When it turns back through its signal line after a trip into a zone, a BUY or SELL prints on the price candle with an entry, a stop and a target attached.
We ran it on three years of EURUSD 1-hour bars at the default settings. BUY turns reached their target first 217 times out of 677, 32 percent, give or take 4 points. The same plan opened on any bar did it 32 percent of the time, out of 19,933 plans. On that chart the SMI turn added nothing over entering anywhere, and the newest label shows it at a glance: "TP first 217/677 (32% ±4)" above "any bar 32% of 19,933". Your symbol, your timeframe and your data feed will give their own numbers.
🔵 THE SMI
William Blau's SMI is a refinement of the stochastic. Instead of measuring the close against the bottom of the high-low range, it measures the close against the middle of it, then smooths that distance and the range itself twice with EMAs. The result runs from minus 100 to plus 100 and reads zero when the close sits in the middle of the range. Defaults here are a %K length of 10, smoothing of 3 and 3, and a 10-bar EMA signal line.
🔵 WHEN A SIGNAL PRINTS
A BUY prints on the first closed bar where the SMI crosses above its signal line, once the SMI has closed at minus 40 or lower and before it gets back to zero. SELL is the mirror image at plus 40. So every BUY prints with the SMI still below zero, and every SELL with it above zero.
That cross uses up the setup even when the trend filter blocks the signal, and any later close inside the zone sets it up again. While a side is set up and waiting for its cross, the SMI pane is shaded teal for BUY or pink for SELL. Signals are read on closed bars only and do not move once printed.
The optional trend filter keeps BUY signals above a chart-timeframe EMA and SELL signals below it, or the reverse if you want to study counter-trend turns.
🔵 THE PLAN ON PRICE
Every signal gets the same kind of plan: entry at the signal close, stop 1.5 ATR away, and a target at twice the stop distance. The ATR multiple and the reward to risk are both editable. The newest plan is drawn as three lines. The entry line shows its price, and the stop and target lines show their price and their distance from the entry (pips on forex, price units elsewhere). While the plan is open, the lines reach into the empty space right of the last bar. Once the stop or the target is touched, or the window runs out, they end at that bar.
🔵 HOW AN OUTCOME IS COUNTED
From the bar after the signal, the script watches for the first touch of the stop or the target. A bar that opens beyond the target counts as target first. Any other bar that touches both lines counts as stop first, the conservative reading. If neither line is touched within 50 bars, the plan counts as neither and its label reads "none in 50b".
The outcome is added to the signal label as soon as it happens, for example "BUY · TP 14b" (target first, 14 bars after the signal). The plan only joins the counts when its 50 bars are up, so quick outcomes and slow ones are counted on the same terms. The counts start at the first bar your chart loads, so they can shift a little after a reload. Plans are drawn and followed on standard bar and candle charts only, because Heikin Ashi and similar chart types do not trade at the prices they draw.
🔵 THE COMPARISON THAT KEEPS IT HONEST
A turn signal only earns attention if it does better than entering anywhere. So the script also opens the same plan on every closed bar, with the same stop, target, window and trend filter, and counts those plans exactly the same way. Both figures print on the newest label and in the panel.
The ± next to a signal figure is a rough 95 percent noise band for a sample that size. A gap between the two figures that sits inside it is luck, not timing. As a guide, the band is about 21 points with 20 signals, 9 with 100 and 3 with 700. Signals overlap too: most of them start while the previous plan on that side is still running, so neither figure is a set of independent trades.
With the target at twice the stop, one target for every two stops is roughly break-even before spreads and costs. Hover a label to see its TP first and SL first counts for that check.
🔵 WHAT IS ON THE CHART
In the SMI pane:
• The SMI, teal while it is above its signal line and pink below, with the gap shaded
• The signal line, the zero line, and the overbought and oversold zones
• A light background while a side is set up and waiting for its cross
• A dot on the SMI wherever a BUY or SELL printed
On price:
• Candles coloured by the SMI: teal above zero, pink below, faded while the SMI is on the other side of its signal line. A BUY usually prints on a faded pink candle, because the SMI is still below zero but has just turned up through its signal line
• BUY and SELL labels on the signal candles. The newest carries the counted figures, older ones keep their outcome, and hovering any label shows its plan and the figures as they stood. About the newest 500 labels are kept; older signals keep their pane dot
• The newest plan: entry, stop and target lines with their prices and distances
• A panel with the SMI at the last close, which side is waiting for a cross, both sides' counts with the any-bar figures, the plan settings and the last signal
• The trend EMA, when the filter is on
🔵 WHAT THIS IS NOT
It is not a strategy and it places no orders. There is no divergence detection, no higher-timeframe reading and no blend of several oscillators: one oscillator, the SMI, and the work goes into measuring its turns. It does not map liquidity, order blocks or market structure.
🔵 HOW TO USE
• Read the newest label first. Trust a gap between the two figures only when it is wider than the ± band. Anything smaller is normal luck.
• Change one setting at a time and watch both figures. The any-bar figure moves with the stop, the target and the filter too, which keeps the comparison fair. A gap found by trying many settings on old bars is partly luck and tends to shrink on new ones.
• Try the trend filter as a test. Switch it on and see whether with-trend turns pull away from the any-bar figure on your symbol, or just ride the same drift.
• A side prints only its sample size until 20 of its plans have been counted, so a figure built on six signals never passes for one built on two hundred.
🔵 SETTINGS
• SMI: %K length 10, smoothing 3 and 3, signal line 10, zone level 40
• Signals: trend filter (off, with the trend, against the trend), its EMA length 200, labels on or off
• Plan and record: ATR length 14, stop 1.5 x ATR, reward to risk 2, outcome window 50 bars, minimum n 20, the any-bar comparison and the newest plan on or off
• Style: candle colouring, how far the plan projects right, the panel and its position, colours
Works on any symbol and any timeframe. Everything is calculated on the chart's own timeframe.
🔵 ALERTS
• SMI BUY turn and SMI SELL turn, each on the closing bar
• SMI any turn
• Any alert() function call: the same signals, with the plan's entry, stop and target in the message on standard charts
Set alerts to fire once per bar close.
⚠️ DISCLAIMER
Crossing the signal line out of a zone is a classic way to read the SMI. The plan, the outcome record and the any-bar comparison are written from scratch for this script.
The figures count what plans did after past signals on this chart. They are not predictions: whatever a side did over its last 700 signals, the next one can go either way. Results vary by symbol, timeframe and settings, and small samples say little, which is why each side's figure carries its count, its n and its noise band, and no percentage prints below the minimum. The BUY and SELL labels mark SMI turns under the rules above; they are not recommendations to trade. Spreads, slippage and your own execution change real results. Shared for educational and research purposes. Not financial advice.
The Stochastic Momentum Index shows where the close sits inside the recent range. This version also shows what its turns have done on the chart in front of you.
The SMI line itself is William Blau's formula, and TradingView ships a built-in version of it. This script is about what happens after the line turns. Every signal gets a plan, every plan is followed to its outcome, and the same plan is also opened on every bar of the chart and counted the same way. That last comparison is the reason the script exists: it shows whether SMI timing did better than entering anywhere.
The SMI stays in its own pane, with its signal line and the overbought and oversold zones at plus and minus 40. When it turns back through its signal line after a trip into a zone, a BUY or SELL prints on the price candle with an entry, a stop and a target attached.
We ran it on three years of EURUSD 1-hour bars at the default settings. BUY turns reached their target first 217 times out of 677, 32 percent, give or take 4 points. The same plan opened on any bar did it 32 percent of the time, out of 19,933 plans. On that chart the SMI turn added nothing over entering anywhere, and the newest label shows it at a glance: "TP first 217/677 (32% ±4)" above "any bar 32% of 19,933". Your symbol, your timeframe and your data feed will give their own numbers.
🔵 THE SMI
William Blau's SMI is a refinement of the stochastic. Instead of measuring the close against the bottom of the high-low range, it measures the close against the middle of it, then smooths that distance and the range itself twice with EMAs. The result runs from minus 100 to plus 100 and reads zero when the close sits in the middle of the range. Defaults here are a %K length of 10, smoothing of 3 and 3, and a 10-bar EMA signal line.
🔵 WHEN A SIGNAL PRINTS
A BUY prints on the first closed bar where the SMI crosses above its signal line, once the SMI has closed at minus 40 or lower and before it gets back to zero. SELL is the mirror image at plus 40. So every BUY prints with the SMI still below zero, and every SELL with it above zero.
That cross uses up the setup even when the trend filter blocks the signal, and any later close inside the zone sets it up again. While a side is set up and waiting for its cross, the SMI pane is shaded teal for BUY or pink for SELL. Signals are read on closed bars only and do not move once printed.
The optional trend filter keeps BUY signals above a chart-timeframe EMA and SELL signals below it, or the reverse if you want to study counter-trend turns.
🔵 THE PLAN ON PRICE
Every signal gets the same kind of plan: entry at the signal close, stop 1.5 ATR away, and a target at twice the stop distance. The ATR multiple and the reward to risk are both editable. The newest plan is drawn as three lines. The entry line shows its price, and the stop and target lines show their price and their distance from the entry (pips on forex, price units elsewhere). While the plan is open, the lines reach into the empty space right of the last bar. Once the stop or the target is touched, or the window runs out, they end at that bar.
🔵 HOW AN OUTCOME IS COUNTED
From the bar after the signal, the script watches for the first touch of the stop or the target. A bar that opens beyond the target counts as target first. Any other bar that touches both lines counts as stop first, the conservative reading. If neither line is touched within 50 bars, the plan counts as neither and its label reads "none in 50b".
The outcome is added to the signal label as soon as it happens, for example "BUY · TP 14b" (target first, 14 bars after the signal). The plan only joins the counts when its 50 bars are up, so quick outcomes and slow ones are counted on the same terms. The counts start at the first bar your chart loads, so they can shift a little after a reload. Plans are drawn and followed on standard bar and candle charts only, because Heikin Ashi and similar chart types do not trade at the prices they draw.
🔵 THE COMPARISON THAT KEEPS IT HONEST
A turn signal only earns attention if it does better than entering anywhere. So the script also opens the same plan on every closed bar, with the same stop, target, window and trend filter, and counts those plans exactly the same way. Both figures print on the newest label and in the panel.
The ± next to a signal figure is a rough 95 percent noise band for a sample that size. A gap between the two figures that sits inside it is luck, not timing. As a guide, the band is about 21 points with 20 signals, 9 with 100 and 3 with 700. Signals overlap too: most of them start while the previous plan on that side is still running, so neither figure is a set of independent trades.
With the target at twice the stop, one target for every two stops is roughly break-even before spreads and costs. Hover a label to see its TP first and SL first counts for that check.
🔵 WHAT IS ON THE CHART
In the SMI pane:
• The SMI, teal while it is above its signal line and pink below, with the gap shaded
• The signal line, the zero line, and the overbought and oversold zones
• A light background while a side is set up and waiting for its cross
• A dot on the SMI wherever a BUY or SELL printed
On price:
• Candles coloured by the SMI: teal above zero, pink below, faded while the SMI is on the other side of its signal line. A BUY usually prints on a faded pink candle, because the SMI is still below zero but has just turned up through its signal line
• BUY and SELL labels on the signal candles. The newest carries the counted figures, older ones keep their outcome, and hovering any label shows its plan and the figures as they stood. About the newest 500 labels are kept; older signals keep their pane dot
• The newest plan: entry, stop and target lines with their prices and distances
• A panel with the SMI at the last close, which side is waiting for a cross, both sides' counts with the any-bar figures, the plan settings and the last signal
• The trend EMA, when the filter is on
🔵 WHAT THIS IS NOT
It is not a strategy and it places no orders. There is no divergence detection, no higher-timeframe reading and no blend of several oscillators: one oscillator, the SMI, and the work goes into measuring its turns. It does not map liquidity, order blocks or market structure.
🔵 HOW TO USE
• Read the newest label first. Trust a gap between the two figures only when it is wider than the ± band. Anything smaller is normal luck.
• Change one setting at a time and watch both figures. The any-bar figure moves with the stop, the target and the filter too, which keeps the comparison fair. A gap found by trying many settings on old bars is partly luck and tends to shrink on new ones.
• Try the trend filter as a test. Switch it on and see whether with-trend turns pull away from the any-bar figure on your symbol, or just ride the same drift.
• A side prints only its sample size until 20 of its plans have been counted, so a figure built on six signals never passes for one built on two hundred.
🔵 SETTINGS
• SMI: %K length 10, smoothing 3 and 3, signal line 10, zone level 40
• Signals: trend filter (off, with the trend, against the trend), its EMA length 200, labels on or off
• Plan and record: ATR length 14, stop 1.5 x ATR, reward to risk 2, outcome window 50 bars, minimum n 20, the any-bar comparison and the newest plan on or off
• Style: candle colouring, how far the plan projects right, the panel and its position, colours
Works on any symbol and any timeframe. Everything is calculated on the chart's own timeframe.
🔵 ALERTS
• SMI BUY turn and SMI SELL turn, each on the closing bar
• SMI any turn
• Any alert() function call: the same signals, with the plan's entry, stop and target in the message on standard charts
Set alerts to fire once per bar close.
⚠️ DISCLAIMER
Crossing the signal line out of a zone is a classic way to read the SMI. The plan, the outcome record and the any-bar comparison are written from scratch for this script.
The figures count what plans did after past signals on this chart. They are not predictions: whatever a side did over its last 700 signals, the next one can go either way. Results vary by symbol, timeframe and settings, and small samples say little, which is why each side's figure carries its count, its n and its noise band, and no percentage prints below the minimum. The BUY and SELL labels mark SMI turns under the rules above; they are not recommendations to trade. Spreads, slippage and your own execution change real results. Shared for educational and research purposes. Not financial advice.

⚜️ Free TG Channel : t.me/fxcracked_backup
⚜️ Free Forex EAs, MT4 indicators, and Forex strategies to automate trades and boost profits. Perfect tools for traders of all levels! - forexcracked.com/
⚜️ Free Forex EAs, MT4 indicators, and Forex strategies to automate trades and boost profits. Perfect tools for traders of all levels! - forexcracked.com/
כתב ויתור
המידע והפרסומים אינם מיועדים להיות, ואינם מהווים, ייעוץ או המלצה פיננסית, השקעתית, מסחרית או מכל סוג אחר המסופקת או מאושרת על ידי TradingView. קרא עוד ב־תנאי השימוש.
⚜️ Free TG Channel : t.me/fxcracked_backup
⚜️ Free Forex EAs, MT4 indicators, and Forex strategies to automate trades and boost profits. Perfect tools for traders of all levels! - forexcracked.com/
⚜️ Free Forex EAs, MT4 indicators, and Forex strategies to automate trades and boost profits. Perfect tools for traders of all levels! - forexcracked.com/
כתב ויתור
המידע והפרסומים אינם מיועדים להיות, ואינם מהווים, ייעוץ או המלצה פיננסית, השקעתית, מסחרית או מכל סוג אחר המסופקת או מאושרת על ידי TradingView. קרא עוד ב־תנאי השימוש.