OPEN-SOURCE SCRIPT
מעודכן [blackcat] L1 Close Histogram Oscillator
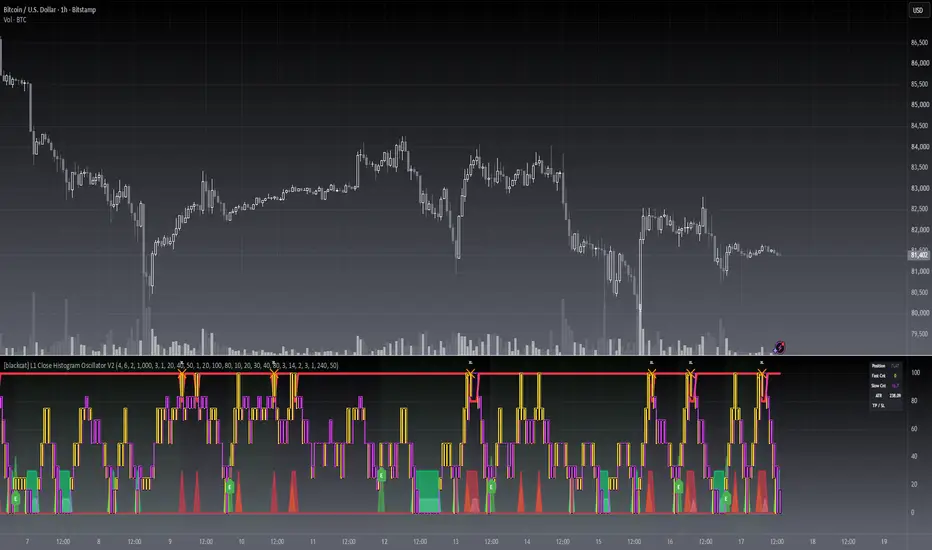
Level: 1
Background
A histogram is a special chart that is applied to statistical data that is divided into numerically ordered groups. For example groups with close relationships in the vicinity like "Close-ref(Close ,1)", "Close-ref(Close,2)" and so on. A histogram provides a snapshot of all the data so that you can quickly get an overview of the historical data, especially its general shape.In a histogram, the bars are linked - in contrast to a bar chart for categorical data, in which the bars represent categories that are in no particular order and are separated. The height of each bar in a histogram indicates either the number of individuals (called the frequency) in each group or the percentage of individuals (the relative frequency) in each group. Each individual in the data set falls into exactly one bar.
Function
L2 Close Histogram Oscillator is a novel overbought and oversold indicator that estimate the trend state by counting a specific bar relationship nearby. Once nearby bars reach consensus, it may spread to global quickly. The reason why I got this inspiration is because I have been engaged in the research of blockchain consensus mechanism. The market is a complex system, and its consensus depends on the common human characteristics: greed and fear. The trend of the market often also conforms to sociological characteristics. Maybe it's a bit complicated for me to say that. However, if you understand the principle of the spread of rumors and viruses, you can understand the situation where some individuals in the market have local consensus and gradually spread to the overall situation. This is the process of trend formation.
Key Signal
fastcounter --> fast close histogram counters
slowcounter --> slow close histogram counters
attention --> bottom price appears, with height of 10 in white
readybuy --> a small position buy opportunity after first bottom detected, with height of 20 in yellow
buylow --> a small position buy at low price, with height of 30 in lime
longentry --> a confirmed long entry signal by close histogram counter, with height of 40 in green
risk --> oscillator top is reached and trend reversal may happen, with height drop from 100 to 80 in red
Pros and Cons
Pros:
1. since this is based on consensus formation principle, i think this is a leading indicator by spreading local consensus to global
2. it is an oscillator, overbought and oversold can be easily observed.
Cons:
1. the model is not complex enough to depict market behavior exactly.
2. sideways and chop market will make this indicator's output hard to read.
Remarks
This is rare! I combined my previous theory of developing cellular automata with the market to produce such a weird indicator. I hope to inspire everyone and study market behavior in a deeper level.
Readme
In real life, I am a prolific inventor. I have successfully applied for more than 60 international and regional patents in the past 12 years. But in the past two years or so, I have tried to transfer my creativity to the development of trading strategies. Tradingview is the ideal platform for me. I am selecting and contributing some of the hundreds of scripts to publish in Tradingview community. Welcome everyone to interact with me to discuss these interesting pine scripts.
The scripts posted are categorized into 5 levels according to my efforts or manhours put into these works.
Level 1 : interesting script snippets or distinctive improvement from classic indicators or strategy. Level 1 scripts can usually appear in more complex indicators as a function module or element.
Level 2 : composite indicator/strategy. By selecting or combining several independent or dependent functions or sub indicators in proper way, the composite script exhibits a resonance phenomenon which can filter out noise or fake trading signal to enhance trading confidence level.
Level 3 : comprehensive indicator/strategy. They are simple trading systems based on my strategies. They are commonly containing several or all of entry signal, close signal, stop loss, take profit, re-entry, risk management, and position sizing techniques. Even some interesting fundamental and mass psychological aspects are incorporated.
Level 4 : script snippets or functions that do not disclose source code. Interesting element that can reveal market laws and work as raw material for indicators and strategies. If you find Level 1~2 scripts are helpful, Level 4 is a private version that took me far more efforts to develop.
Level 5 : indicator/strategy that do not disclose source code. private version of Level 3 script with my accumulated script processing skills or a large number of custom functions. I had a private function library built in past two years. Level 5 scripts use many of them to achieve private trading strategy.
הערות שחרור
In order to obey the House Rule, remove the irrelevant MA Cross display.הערות שחרור
b]OVERVIEW The [blackcat] L1 Close Histogram Oscillator tracks price momentum via dual counters derived from closing price trends, generating actionable signals across distinct risk/reward zones. This non-overlay indicator combines histogram analysis with persistent entry validation.
FEATURES
Dual Momentum Counters:
FASTCOUNTER: 4-period close-up ratio normalized to % scale
SLOWCOUNTER: 6-period close-up ratio normalized to % scale
Multi-Zone Alerts:
▪ Attention Zone (white) – extreme bearish alignment (both counters at 0%)
▪ Ready Buy Zone (yellow) – bullish divergence (FASTCOUNTER=0/SLOWCOUNTER>20%)
▪ Buy Low Confirmation (lime green) – transitional bullish pattern
▪ Long Entry Signal (green) – validated by 3-bar persistence check
Risk Meter: Red dynamic line spikes at ≥80%/≥80% counter saturation
Visual Architecture:
• Stepped line profiles for core counters
• Composite candlestick overlay contrasting counters
• Color-coded area plots for decision zones
HOW TO USE
Monitor FAST/SLOW counter progression for momentum shifts
Prioritize entries when GREEN zone activation aligns with: ✓ Coinciding crossover events (fast/level or slow/threshold) ✓ Post-persistence confirmation
Avoid positions when RED risk meter exceeds 80 threshold
Use white/yellow zones to identify short-term turning points
LIMITATIONS
• Fixed input parameters (lookbacks/histogram logic cannot be adjusted)
• Relies on prior session continuity (gap days impact accuracy)
• Lag susceptibility during rapid trend reversals
• Non-adaptive thresholds requiring manual context adjustment
הערות שחרור
█ OVERVIEWThe L1 Close Histogram Oscillator is a momentum-style pane indicator that
measures how often the closing price stays above a recent reference close,
turning that ratio into fast and slow counters with graded warning zones.
It delivers confirmed long and short entry signals, signal-based exits,
ATR-based take-profit/stop-loss reference levels, and a full alert suite.
█ CONCEPTS
The script computes two counters: a fast counter over a short lookback and
a slow counter over a longer lookback. Each counter expresses the percentage
of bars on which the close exceeded a reference close from N bars back.
Readings near 0 indicate persistent weakness; readings near 100 indicate
persistent strength.
Key principles:
• Graded zones: weakness (Attention, Ready Buy, Buy Low) builds a ladder
toward a long entry; strength (Attention, Ready Sell, Sell High) mirrors
it toward a short entry
• Entry confirmation: crossover/crossunder events are filtered by a
persistence check so only confirmed sequences trigger
• Position awareness: a state machine tracks long/short/flat, enforces
same-bar exclusivity (exits take precedence), and applies a cooldown
• Volvency-adaptive risk: take-profit and stop-loss distances scale with ATR
█ HOW TO USE
1 — Add the indicator to any chart (works on all timeframes; 15m and above
is recommended to reduce noise)
2 — Start with the default settings; all thresholds are exposed as inputs
and keep their original values by default
3 — Read signals from labels, the colored zone areas, and the dashboard
table; optionally enable alerts from the indicator's alert menu
Input Parameters
• L1 Algorithm: Fast Counter Length (4), Slow Counter Length (6),
Reference Close Lookback (2), Threshold Check Lookback (1000),
Signal Persistence Bars (3)
• Signal Thresholds: Fast Cross Level (1), Slow Cross Level (20),
Slow Max on Fast Cross (40), Fast Max on Slow Cross (50),
Buy-Low Lower/Upper Bound (1/20), Risk Fast/Slow Level (100/80)
• Level Values: height of each zone band — Attention (10), Ready-Buy (20),
Buy-Low (30), Entry (40), Risk (80)
• Signal Governance: Enable Short Signals, Same-bar Entry/Exit
Exclusivity, Cooldown Bars (3)
• Risk Management: Show ATR TP/SL Levels, ATR Length (14),
Stop Loss (2.0xATR), Take Profit (3.0xATR)
• Re-entry: Enable Re-entry (off), Anchor Window Bars (1) — after an exit,
a close breaking the exit-bar extreme re-arms an entry
• MTF Gate: Enable HTF Direction Gate (off), HTF Period (240),
HTF EMA Length (50) — higher-timeframe direction filter using a
zero-repaint security call
• Visual: Show Signal Labels, Show Position Background, Show Dashboard
█ FEATURES
• Symmetric long/short signal generation with a single on/off switch
• Position state machine with edge-triggered, cooldown-limited signals
• ATR-based TP/SL reference levels plotted while a position is active
• Label system (E/S/XL/XS/RL/RS), position background tint, and a
live status dashboard
• Eight alert conditions plus dynamic price-tagged alert messages
• Every new mechanism is toggleable with defaults that preserve the
original indicator's behavior
█ SIGNALS
Visual Elements
• E (green, below): confirmed long entry
• S (red, above): confirmed short entry
• XL / XS (orange cross): long/short exit
• RL / RS (teal/maroon): optional re-entry breakout
• White / yellow / lime area bands: Attention, Ready Buy, Buy Low zones
• Orange / red area bands: Attention Short, Ready Sell, Sell High zones
• Red Risk line: elevated-risk marker at the Risk level
• Yellow / fuchsia step lines: fast and slow counters; the L1 candle
body colors by which counter leads
• Teal / red lines: active take-profit / stop-loss reference levels
█ IMPLEMENTATION NOTES
Built with Pine Script v6. All ta.* functions (crossover, crossunder, ATR,
highest/lowest) are evaluated on every bar and their results are stored in
global variables before use in conditions, keeping history consistent.
The optional higher-timeframe gate reads confirmed HTF data only
(barmerge.lookahead_on with [1] reference) to avoid repainting.
█ LIMITATIONS
• Counter-based signals can whipsaw in choppy, range-bound markets
• Best suited for trending instruments; patience in flat regimes is advised
• TP/SL levels are reference lines for discretionary use — this is an
indicator, not an automated strategy
• Not recommended below the 5-minute timeframe
█ NOTES
• Original algorithm and authorship: blackcat1402 (MPL 2.0)
• This V2 release adds short-side symmetry, exits, ATR risk levels,
signal governance, visualization, and alerts; the original counter
formulas are preserved unchanged
════════════════════════════════════════════════════════════════════════
For questions or feedback, please use the comments section below.
Feel free to use and modify — attribution appreciated.
סקריפט קוד פתוח
ברוח האמיתית של TradingView, יוצר הסקריפט הזה הפך אותו לקוד פתוח, כך שסוחרים יוכלו לעיין בו ולאמת את פעולתו. כל הכבוד למחבר! אמנם ניתן להשתמש בו בחינם, אך זכור כי פרסום חוזר של הקוד כפוף ל־כללי הבית שלנו.

Don't miss out! The first and most important thing to do is to join my Discord chat now! Click here to start your adventure: discord.com/invite/ZTGpQJq My new github for more pine development soon: github.com/wxt-coder
כתב ויתור
המידע והפרסומים אינם מיועדים להיות, ואינם מהווים, ייעוץ או המלצה פיננסית, השקעתית, מסחרית או מכל סוג אחר המסופקת או מאושרת על ידי TradingView. קרא עוד ב־תנאי השימוש.
סקריפט קוד פתוח
ברוח האמיתית של TradingView, יוצר הסקריפט הזה הפך אותו לקוד פתוח, כך שסוחרים יוכלו לעיין בו ולאמת את פעולתו. כל הכבוד למחבר! אמנם ניתן להשתמש בו בחינם, אך זכור כי פרסום חוזר של הקוד כפוף ל־כללי הבית שלנו.
Don't miss out! The first and most important thing to do is to join my Discord chat now! Click here to start your adventure: discord.com/invite/ZTGpQJq My new github for more pine development soon: github.com/wxt-coder
כתב ויתור
המידע והפרסומים אינם מיועדים להיות, ואינם מהווים, ייעוץ או המלצה פיננסית, השקעתית, מסחרית או מכל סוג אחר המסופקת או מאושרת על ידי TradingView. קרא עוד ב־תנאי השימוש.