J - 200sma Band Tracker
(2022)
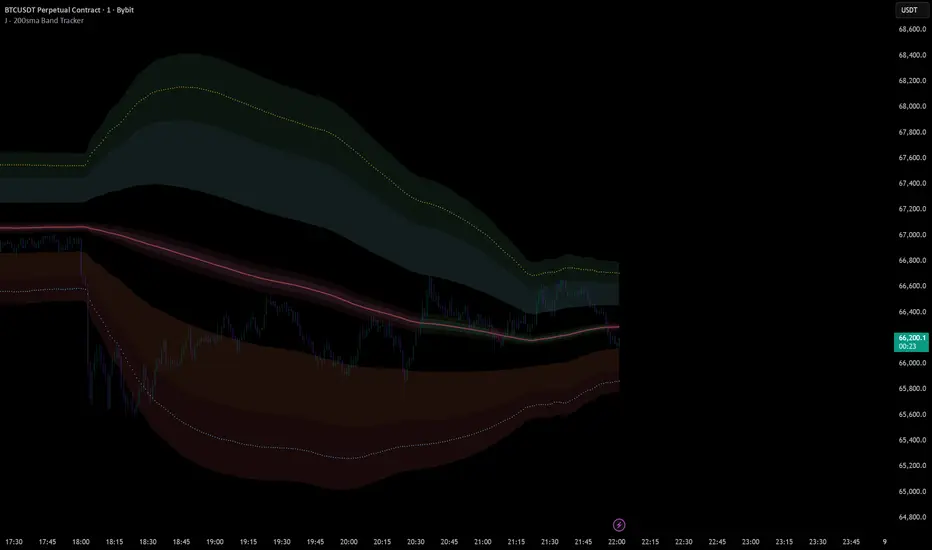
A Bollinger Band-based overlay that tracks price equilibrium using a 200 SMA as its core.
It layers multiple standard deviation bands (1–3σ) to highlight overbought/oversold zones, a narrow band to show tight consolidation, and an inner band to visualize micro price positioning.
A Bollinger Band-based overlay that tracks price equilibrium using a 200 SMA as its core.
It layers multiple standard deviation bands (1–3σ) to highlight overbought/oversold zones, a narrow band to show tight consolidation, and an inner band to visualize micro price positioning.

No courses, don't sell signals — just my own edge, stats public: jalgo.ca/
כתב ויתור
המידע והפרסומים אינם מיועדים להיות, ואינם מהווים, ייעוץ או המלצה פיננסית, השקעתית, מסחרית או מכל סוג אחר המסופקת או מאושרת על ידי TradingView. קרא עוד ב־תנאי השימוש.
כתב ויתור
המידע והפרסומים אינם מיועדים להיות, ואינם מהווים, ייעוץ או המלצה פיננסית, השקעתית, מסחרית או מכל סוג אחר המסופקת או מאושרת על ידי TradingView. קרא עוד ב־תנאי השימוש.