Albrecht Edge - Sessions
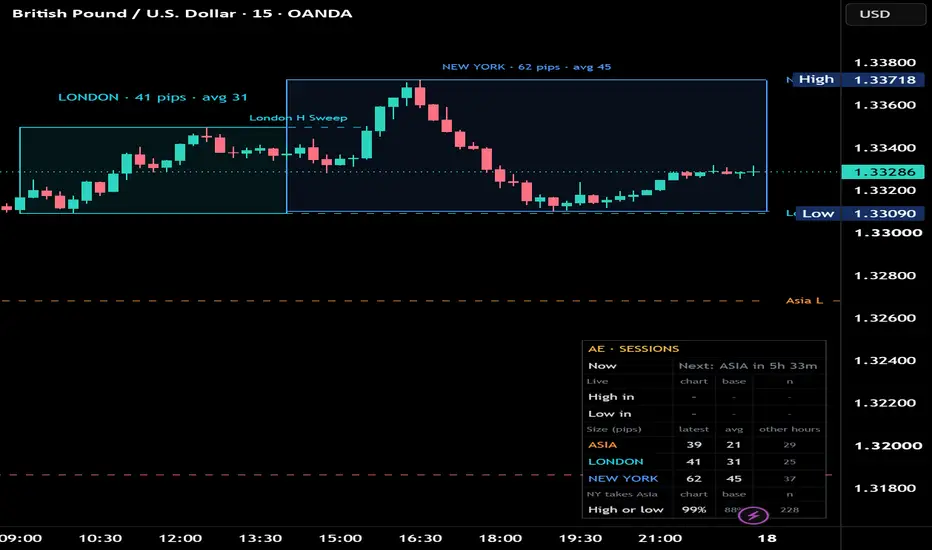
Trading sessions of Asia, London and New York as boxes, with their highs and lows as levels and a small set of statistics. Session times follow the exchange time zones, so daylight saving time is handled automatically wherever you are. Every number on the chart is measured on the history of the chart you are looking at.
SESSIONS
- Asia 09:00-15:00 Tokyo time, London from 08:00 London time until 08:00 New York time, New York 08:00-17:00 New York time or the US cash session 09:30-16:00 (on 1h charts the cash session includes the 09:00 bar).
- Optional custom session in a selectable time zone; windows across midnight are supported. The custom session is drawn and measured for its size only.
- Each box shows the session name and its size: in pips (forex) or price points, as a percentage above or below the average session of its kind, or as a percentage of the daily ATR. The average is the median of past sessions of the same kind on this chart, so single news days do not distort it.
- Unusual sessions stand out: the biggest 10% get a thick frame, the quietest 10% a dotted frame, measured against past sessions of the same kind (from 20 sessions on).
- Box styles: frame, filled, or filled with frame.
LEVELS
- High and low of the most recent sessions, extended until price trades beyond them.
- Previous day high (green) and low (red). Highs or lows of the days before stay as well while they are untaken and close to the newest one (within 0.3 daily ATR, up to 3 days back), labeled with their age, for example PDH 2.
- When a level is taken, its line runs up to the bar that took it and ends in its name with Sweep or Break, written just above (highs) or below (lows) the line. Sweep: the bar closed back inside. Break: the bar closed beyond the level. Both are set when the bar has closed. Levels at nearly the same price share one name, for example "PDH · NY H Sweep".
- Untaken levels carry their name at the right edge of the chart.
LIVE (while a session runs)
- Live statistics for Asia and New York: how often, on this chart, the session high (low) reached so far was still the high (low) at the session end. Shown next to a base: windows of the same length at other hours of the day. If the difference to the base is within two standard errors, or fewer than 30 sessions are available, the value is shown with ≈ in grey, because it is not distinguishable from noise.
- End zone (optional, off by default): a dotted zone around the running session. In at least 80% of past sessions on this chart, price did not move further beyond the range so far than this zone by the session end.
DASHBOARD
- The running session with progress and time left, or the next session with a countdown.
- Session sizes: latest, average and other hours (windows of the same length at all other hours of the day), so you can see whether a session really moves more than the rest of the day on this market.
- New York takes the Asia high or low: how often on this chart, next to the base.
- Full or Compact layout (made for phones), any position, three text sizes.
STYLE
- Automatic light and dark colors, based on the chart background. Colors you change stay as you set them.
- The texts above the boxes and the Sweep / Break marks size themselves to the room on the chart: when you zoom out they get smaller instead of covering each other.
- Optional candle colors: inside a session, candles get stronger the more of the session's typical range has been used; outside the sessions they are faded.
ALERTS
Session start and level taken (with Sweep or Break). Create one alert with the condition "Any alert() function call".
HOW IT WORKS
The script keeps the high and low of every 30-minute slot (1-hour slots on charts above 30 minutes). A session's size is its range over the slots it traded, divided by the daily ATR(14) of the previous finished day, so days of different volatility can be compared; averages are medians of these values. The base for every statistic is the same window length shifted by whole hours to the other hours of the day, so you see whether the session behaves differently from the rest of the day on this market or just like any other window of that length. The live statistics count, for every elapsed slot, how often the high or low reached so far held until the session end; the end zone is the 80% quantile of how far price moved beyond the range so far after that slot. Differences to the base count only when they exceed two standard errors (a sign test for the averages).
NOTES AND LIMITS
- Works on charts of 1 hour and lower.
- The statistics need past sessions: averages 5, frames and live statistics 20, the noise check 30. On low timeframes the chart loads fewer days of history; a higher timeframe gives more sessions. The dashboard shows a note while data is still being collected.
- All values describe how this market behaved on this chart in the past. They are not a forecast, and the indicator gives no buy or sell signals.
- Boxes, levels and Sweep / Break marks of finished sessions are drawn from closed bars and do not repaint. The daily ATR comes from the previous finished day. The running session, its live values and the level names at the right edge update in real time.
- Markets that close before the planned end of a session (stocks, some index CFDs) are measured over the hours they traded. Sessions with a trading break inside (for example a lunch break) are drawn but not measured, and sessions without trading on a market (for example Asia on a US stock) stay empty.
- History shows up to 30 days of boxes and levels; the statistics always use the full chart history.
SESSIONS
- Asia 09:00-15:00 Tokyo time, London from 08:00 London time until 08:00 New York time, New York 08:00-17:00 New York time or the US cash session 09:30-16:00 (on 1h charts the cash session includes the 09:00 bar).
- Optional custom session in a selectable time zone; windows across midnight are supported. The custom session is drawn and measured for its size only.
- Each box shows the session name and its size: in pips (forex) or price points, as a percentage above or below the average session of its kind, or as a percentage of the daily ATR. The average is the median of past sessions of the same kind on this chart, so single news days do not distort it.
- Unusual sessions stand out: the biggest 10% get a thick frame, the quietest 10% a dotted frame, measured against past sessions of the same kind (from 20 sessions on).
- Box styles: frame, filled, or filled with frame.
LEVELS
- High and low of the most recent sessions, extended until price trades beyond them.
- Previous day high (green) and low (red). Highs or lows of the days before stay as well while they are untaken and close to the newest one (within 0.3 daily ATR, up to 3 days back), labeled with their age, for example PDH 2.
- When a level is taken, its line runs up to the bar that took it and ends in its name with Sweep or Break, written just above (highs) or below (lows) the line. Sweep: the bar closed back inside. Break: the bar closed beyond the level. Both are set when the bar has closed. Levels at nearly the same price share one name, for example "PDH · NY H Sweep".
- Untaken levels carry their name at the right edge of the chart.
LIVE (while a session runs)
- Live statistics for Asia and New York: how often, on this chart, the session high (low) reached so far was still the high (low) at the session end. Shown next to a base: windows of the same length at other hours of the day. If the difference to the base is within two standard errors, or fewer than 30 sessions are available, the value is shown with ≈ in grey, because it is not distinguishable from noise.
- End zone (optional, off by default): a dotted zone around the running session. In at least 80% of past sessions on this chart, price did not move further beyond the range so far than this zone by the session end.
DASHBOARD
- The running session with progress and time left, or the next session with a countdown.
- Session sizes: latest, average and other hours (windows of the same length at all other hours of the day), so you can see whether a session really moves more than the rest of the day on this market.
- New York takes the Asia high or low: how often on this chart, next to the base.
- Full or Compact layout (made for phones), any position, three text sizes.
STYLE
- Automatic light and dark colors, based on the chart background. Colors you change stay as you set them.
- The texts above the boxes and the Sweep / Break marks size themselves to the room on the chart: when you zoom out they get smaller instead of covering each other.
- Optional candle colors: inside a session, candles get stronger the more of the session's typical range has been used; outside the sessions they are faded.
ALERTS
Session start and level taken (with Sweep or Break). Create one alert with the condition "Any alert() function call".
HOW IT WORKS
The script keeps the high and low of every 30-minute slot (1-hour slots on charts above 30 minutes). A session's size is its range over the slots it traded, divided by the daily ATR(14) of the previous finished day, so days of different volatility can be compared; averages are medians of these values. The base for every statistic is the same window length shifted by whole hours to the other hours of the day, so you see whether the session behaves differently from the rest of the day on this market or just like any other window of that length. The live statistics count, for every elapsed slot, how often the high or low reached so far held until the session end; the end zone is the 80% quantile of how far price moved beyond the range so far after that slot. Differences to the base count only when they exceed two standard errors (a sign test for the averages).
NOTES AND LIMITS
- Works on charts of 1 hour and lower.
- The statistics need past sessions: averages 5, frames and live statistics 20, the noise check 30. On low timeframes the chart loads fewer days of history; a higher timeframe gives more sessions. The dashboard shows a note while data is still being collected.
- All values describe how this market behaved on this chart in the past. They are not a forecast, and the indicator gives no buy or sell signals.
- Boxes, levels and Sweep / Break marks of finished sessions are drawn from closed bars and do not repaint. The daily ATR comes from the previous finished day. The running session, its live values and the level names at the right edge update in real time.
- Markets that close before the planned end of a session (stocks, some index CFDs) are measured over the hours they traded. Sessions with a trading break inside (for example a lunch break) are drawn but not measured, and sessions without trading on a market (for example Asia on a US stock) stay empty.
- History shows up to 30 days of boxes and levels; the statistics always use the full chart history.

כתב ויתור
המידע והפרסומים אינם מיועדים להיות, ואינם מהווים, ייעוץ או המלצה פיננסית, השקעתית, מסחרית או מכל סוג אחר המסופקת או מאושרת על ידי TradingView. קרא עוד ב־תנאי השימוש.
כתב ויתור
המידע והפרסומים אינם מיועדים להיות, ואינם מהווים, ייעוץ או המלצה פיננסית, השקעתית, מסחרית או מכל סוג אחר המסופקת או מאושרת על ידי TradingView. קרא עוד ב־תנאי השימוש.