מעודכן
Supply & Demand Zones XL
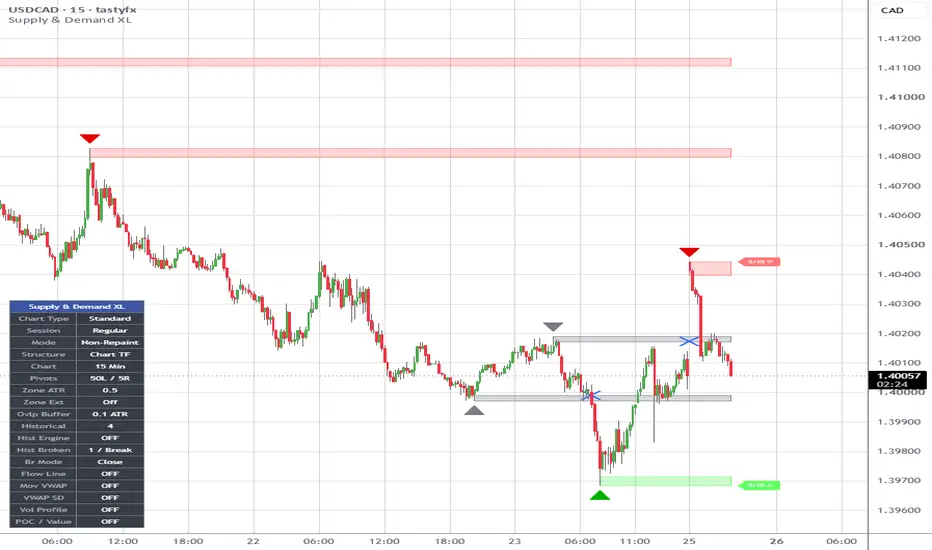
Description
Supply & Demand Zones XL is a non-repainting supply and demand indicator designed to model market structure with a focus on stability, clarity, and quantitative strength evaluation.
The script identifies supply and demand zones using pivot-based structure and sizes each zone dynamically using ATR, ensuring consistent scaling across different market conditions. Zones are extended forward in real time and maintained as either active or historical depending on user preference.
Each zone is scored using a composite strength model that incorporates volume participation, zone width efficiency, time in market, and touch frequency. The resulting strength rating is normalized to a simple X/10 format and displayed at the end of each zone for immediate readability.
A non-repainting mode ensures that zones are only confirmed after pivot completion, preventing forward-looking bias. An optional volume filter allows users to require above-average participation before a zone is formed.
The script includes logic to prevent redundant structure by disallowing overlapping zones of the same type while the current zone remains valid. Once a zone is broken, new zones are allowed to form, preserving structural continuity.
Zones are considered broken only on confirmed closes beyond their boundaries, not intrabar wicks. Broken zones are downgraded in strength and can be visually differentiated using customizable color controls. Users can independently control coloring for active and historical broken zones, as well as define separate colors for supply, demand, broken supply, and broken demand.
Historical zones can be toggled on or off, with optional strength labels, allowing users to balance context versus chart clarity.
The result is a structured, state-driven supply and demand model that avoids noise, reduces duplication, and provides a consistent framework for evaluating zone quality and market behavior.
Supply & Demand Zones XL is a non-repainting supply and demand indicator designed to model market structure with a focus on stability, clarity, and quantitative strength evaluation.
The script identifies supply and demand zones using pivot-based structure and sizes each zone dynamically using ATR, ensuring consistent scaling across different market conditions. Zones are extended forward in real time and maintained as either active or historical depending on user preference.
Each zone is scored using a composite strength model that incorporates volume participation, zone width efficiency, time in market, and touch frequency. The resulting strength rating is normalized to a simple X/10 format and displayed at the end of each zone for immediate readability.
A non-repainting mode ensures that zones are only confirmed after pivot completion, preventing forward-looking bias. An optional volume filter allows users to require above-average participation before a zone is formed.
The script includes logic to prevent redundant structure by disallowing overlapping zones of the same type while the current zone remains valid. Once a zone is broken, new zones are allowed to form, preserving structural continuity.
Zones are considered broken only on confirmed closes beyond their boundaries, not intrabar wicks. Broken zones are downgraded in strength and can be visually differentiated using customizable color controls. Users can independently control coloring for active and historical broken zones, as well as define separate colors for supply, demand, broken supply, and broken demand.
Historical zones can be toggled on or off, with optional strength labels, allowing users to balance context versus chart clarity.
The result is a structured, state-driven supply and demand model that avoids noise, reduces duplication, and provides a consistent framework for evaluating zone quality and market behavior.
הערות שחרור
Defaults updated.הערות שחרור
Added Bars Left & Bars Right user functionality.הערות שחרור
Updated zone scoring logic.הערות שחרור
Non-repaint logic applied to broken zones.RSI Confirmation toggle/logic added.
הערות שחרור
Added triangle visuals with user toggle.הערות שחרור
Added Supply/Demand Triangle Color controls.Added Strong vs Weak Zone Color controls.
Improved Zone Strength calculation engine.
הערות שחרור
Internal bug fixes.Adjusted default zone colors.
הערות שחרור
User input control for zone transparency added.הערות שחרור
Added user input controls for zone strength.Updated order of user input controls.
הערות שחרור
Updated disallow same-zone overlap logic.הערות שחרור
The update changes how overlap is handled by separating same-zone and different-zone logic and narrowing the scope of each check to only the most recently accepted zone of that type. Instead of evaluating overlap against all existing zones or relying on active/broken state, a new supply zone is now only compared to the previous supply zone for same-side filtering and to the previous demand zone for opposite-side filtering. This makes zone creation more deterministic and prevents immediate duplication or direct conflict between consecutive zones, while still allowing older zones to coexist if they are not part of the most recent structural interaction.הערות שחרור
This update introduces the Flow Line, a streamlined trend regime overlay that dynamically colors price action based on direction and strength using an adaptive EMA, volatility-normalized slope, and ADX filtering. It replaces multiple exposed inputs with a single Fast, Medium, or Slow speed setting, keeping the interface clean while preserving the underlying logic for identifying trending versus consolidating market conditions.הערות שחרור
Internal defaults adjusted.הערות שחרור
User inputs re-organized.הערות שחרור
Bug fixes.הערות שחרור
Internal Updates.הערות שחרור
Pine category updated.הערות שחרור
Internal code min/max/step data added to user inputs.הערות שחרור
The zone strength scoring system has been completely rewritten from the ground up. The old engine used simple linear math across three components. The new engine uses five distinct signals, logarithmic scaling, and a configurable recency decay multiplier.──────────────────────────────
WHAT'S NEW
──────────────────────────────
▸ Departure Velocity (new)
How fast and decisively did price leave the zone? A sharp, clean rejection scores high. A slow grind away scores low. This is the single strongest signal of genuine institutional activity at a zone origin — and the old engine had nothing like it.
▸ Zone Purity (new)
Measures the body-to-range ratio of the pivot candle. A large-bodied decisive candle = clean order flow. A doji or indecision candle = weak zone origin. Fresh zones now reflect the quality of their formation candle.
▸ Recency Decay (new)
Old zones lose relevance over time even if never broken. An exponential decay multiplier is applied to the final score with a configurable half-life (default: 100 bars). A zone from 500 bars ago that was never retested is no longer scored the same as a fresh one.
▸ Wick vs Body Touch Detection (rebuilt)
The old engine counted any price contact as a touch. The new engine distinguishes:
— Wick touch: price probed the zone but closed outside it (zone held — minor penalty)
— Body touch: close landed inside the zone (zone is being absorbed — major penalty)
Both have separate, individually weighted penalty controls.
▸ Logarithmic Scaling Throughout
Every component now uses log-based curves instead of linear math. The difference between a 5-bar-old and 50-bar-old zone is meaningful. The difference between 200 bars and 500 bars is far less so. Same principle applies to touch penalties and volume.
──────────────────────────────
NEW INPUTS ADDED
──────────────────────────────
• Departure Velocity Weight
• Zone Purity Weight
• Wick Touch Penalty Weight
• Body Touch Penalty Weight
• Use Recency Decay (toggle)
• Decay Half-Life in Bars
All existing inputs are preserved. Default weights are tuned to reflect real S&D logic out of the box.
──────────────────────────────
NOTES
──────────────────────────────
Zone scores will look different from v1 — this is expected. The new model is more selective. A score of 7+/10 now means more than it did before. Broken zones still floor at 1/10 regardless of prior score.
הערות שחרור
**Supply & Demand Zones XL — Full Update Description**---
**Settings Panel — Complete Reorganization**
The settings panel has been restructured from a single flat list of inputs into seven clearly labeled, collapsible groups. Previously every setting appeared one after another with no separation or context, making it difficult to find what you were looking for or understand how controls related to each other. Now the panel is organized so related settings live together and the most foundational decisions appear first.
- **General** is the first group you see when you open the settings. It contains Non-Repainting Mode at the very top — where it belongs, since it governs how the entire indicator behaves before anything else is configured — followed by the core pivot detection and zone sizing parameters you set once and rarely revisit.
- **Display** groups together all the controls that determine what gets drawn on the chart and under what conditions zones are accepted. The overlap prevention toggles now sit directly below Show Triangles rather than being scattered after the RSI inputs where they originally lived, placing them with the display controls they actually belong with.
- **Historical Zones** gives the historical zone toggle and lookback number their own dedicated group, making it obvious these two settings are a pair and that the lookback number governs both how many zones are displayed and how far back the overlap system checks.
- **Filters** brings the volume filter and RSI confirmation controls together under one roof. Both are optional systems that gate whether a pivot qualifies as a zone origin, so housing them together makes their shared purpose clear. In the original these were split across different parts of the panel with no logical grouping.
- **Strength Engine** groups all six scoring and penalty weights alongside the recency decay controls. This is the section for users who want to tune how zones are evaluated, scored, and aged over time.
- **Colors** consolidates everything visual into one place — zone fill colors, triangle colors, broken zone colors, transparency, the strength threshold, and the broken zone coloring toggles.
- **Flow Line** groups all flow line controls together so the feature is entirely self-contained and doesn't bleed into unrelated settings.
---
**Tooltips Added to Every Input**
Every single input now has a tooltip that appears when you hover over it in TradingView's settings panel. There were no tooltips at all in the original. Each one is written in plain language explaining what the setting does, what the numbers mean in practical terms, what happens when you push the value to its extremes, and where relevant, how it interacts with other controls. The Historical Zone Lookback tooltip for example explicitly calls out that it governs both zone display depth and the overlap prevention window, since those two behaviors are now directly linked.
---
**Overlap Prevention — Rebuilt to Respect the Lookback Window**
This is the most significant behavioral change in the update. The overlap prevention system has been rebuilt from scratch and now actually does what the toggle labels always implied.
- In the original version, both overlap toggles worked by comparing a new candidate zone against only the single most recently accepted zone of each type — one supply zone back and one demand zone back — regardless of what your Historical Zone Lookback was set to. A candidate zone could overlap anything beyond the most recent zone and pass through the filter completely unchecked. The lookback setting had no connection to the overlap system whatsoever.
- In the updated version, the indicator maintains a running memory of the exact price boundaries of every zone it has accepted, going back as far as your Historical Zone Lookback number allows. When a new candidate zone forms at a pivot, it gets checked against every single zone currently held in that memory window before being accepted. If it overlaps with any of them it gets blocked. Set your lookback to 3 and three zones per side are checked. Set it to 10 and ten are checked. The two toggles still work independently of each other, but both now operate across the full lookback window rather than just one step back.
- This coordinate memory is maintained separately from the visual box drawing, which means the overlap protection works correctly even when Show Historical Zones is turned off. In the original, turning off historical zones had the side effect of further limiting what the overlap system could see. That is no longer the case.
הערות שחרור
Historical lookback setting fixed so that a historical lookback setting of 2 will display 2 support & demand zones back from the current supply & demand zones. A lookback of 0 shows only the current supply & demand zone and 0 historical zones.הערות שחרור
NEW: Use Historical Overlap EngineLocation
Historical Zones Group
Placed directly below:
* Historical Zone Lookback
What This Setting Does
This toggle controls whether historical zones are allowed to influence future zone creation.
In simple terms:
* Should old zones actively block new overlapping zones?
* Or should old zones remain visual-only references?
When ENABLED (Checked)
Historical zones participate in the overlap engine.
This means:
* Older zones can block new overlapping zones
* Charts stay cleaner and less cluttered
* Duplicate and stacked zones are reduced
* Structure becomes more selective and filtered
Best For
* Swing trading
* Higher timeframe analysis
* Cleaner institutional-style structure
Tradeoff
Changing Historical Zone Lookback can still affect future zone formation because old zones remain part of the structural decision process.
When DISABLED (Unchecked)
Historical zones become display-only.
This means:
* Old zones stay visible
* But they no longer block new zones
* More zones can form freely
* Historical Zone Lookback becomes mostly visual
Best For
* Scalping
* Lower timeframes
* Maximum zone visibility
* More consistent replay behavior
Tradeoff
Charts may become denser with more overlapping zones.
Why This Update Matters
Previously, Historical Zone Lookback controlled:
* how many zones were shown
AND
* how many zones could block future zones
That meant a visual setting could unexpectedly change actual structure generation.
This update separates those behaviors and gives direct control over whether historical zones should:
* simply display
OR
* actively influence future structure formation.
הערות שחרור
Alerts Added:Zone Formation — New Supply Zone fires when a new supply zone is created. New Demand Zone fires when a new demand zone is created.
Zone Broken — Supply Zone Broken fires once when close crosses above the supply zone top. Demand Zone Broken fires once when close crosses below the demand zone bottom.
Zone Retouch — Supply Zone Retouch fires when a wick enters the supply zone but close stays outside. Demand Zone Retouch fires when a wick enters the demand zone but close stays outside.
6 alerts total, all respecting your nonRepaint setting where applicable.
הערות שחרור
Here's what was added to the indicator in this update:- Six alerts covering zone formation, zone breaks, and zone retouches, all accessible through TradingView's alert panel and all respecting the Non-Repainting Mode setting.
- A break arrow system that draws a directional marker directly on the candle that breaks a zone. Unlike most markers in Pine Script, these work on historical zones within your lookback window, not just the current active zone. A new dedicated settings group gives you full control over the appearance.
**Break Arrows** (new group)
- **Show Break Arrows** — When on, a marker is drawn on the candle that breaks a zone. Works on both the active zone and historical zones within the lookback window.
- **Supply Break Color** — Color of the marker that appears when price breaks above a supply zone.
- **Demand Break Color** — Color of the marker that appears when price breaks below a demand zone.
- **Marker Size** — Controls how large the break marker appears. Options are Tiny, Small, Normal, Large, and Huge. Note that markers scale with chart zoom level.
- **Marker Shape** — The shape drawn on the breaking candle. Arrow and Triangle variants are directional — supply breaks point up, demand breaks point down. All other shapes are the same on both sides. Options are Arrow, Triangle, Circle, Square, Diamond, Cross, X Cross, and Flag.
**Alerts** (set inside TradingView's alert panel, not in the indicator settings)
- **New Supply Zone** — Fires when a new supply zone is created.
- **New Demand Zone** — Fires when a new demand zone is created.
- **Supply Zone Broken** — Fires once on the candle that closes above the active supply zone.
- **Demand Zone Broken** — Fires once on the candle that closes below the active demand zone.
- **Supply Zone Retouch** — Fires when a wick enters the supply zone but the candle closes outside it.
- **Demand Zone Retouch** — Fires when a wick enters the demand zone but the candle closes outside it.
הערות שחרור
Internal defaults updated for improved user experience.הערות שחרור
**Detailed Change Log****1. Added Structure Timeframe Selector**
Added a new setting under **General** that lets you choose the timeframe used to calculate supply/demand structure.
Example: set structure to **4H** while viewing a **15m** chart.
**2. Converted the Indicator to Multi-Timeframe Structure**
The original version calculated everything from the chart timeframe. The updated version calculates zones from the selected structure timeframe instead.
This affects:
* pivots
* ATR
* volume filter
* RSI filter
* zone creation
* flow line structure
**3. Locked Strength Labels to the Selected Timeframe**
Strength labels no longer change just because you switch from a 15m chart to a 4H chart while the indicator is set to 4H.
The strength engine now uses the selected structure timeframe for:
* zone age
* wick touches
* body touches
* breaks
* decay
* final score
**4. Fixed Zone Height Parity**
The updated version now matches the original zone-sizing logic more closely.
The original script used ATR from the **pivot candle**. The MTF version was adjusted to also use the **pivot candle ATR**, not the confirmation candle ATR.
This reduces slight differences between the original and upgraded versions when inputs are apples-to-apples.
**5. Added Timeframe Guard**
The indicator now blocks invalid combinations where the selected structure timeframe is lower than the chart timeframe.
Allowed:
* 4H structure on 15m chart
* 4H structure on 1H chart
* 4H structure on 4H chart
Blocked:
* 4H structure on Daily chart
This prevents distorted drawings and compressed structure behavior.
**6. Improved Triangle Placement**
Triangles were moved away from candle highs/lows and tied to the zone edge instead.
Supply triangles now appear above the supply zone.
Demand triangles now appear below the demand zone.
**7. Added Triangle Clearance**
A stronger ATR-based clearance was added so triangles do not cover the candles or zones.
This makes the triangles cleaner across different symbols, timeframes, and price scales.
**8. Stabilized Zone Drawing Across Timeframes**
Boxes and labels were updated to use time-based positioning instead of relying only on chart bar numbers.
This improves consistency when switching between chart timeframes.
**9. Prevented Duplicate Higher-Timeframe Signals**
The script now avoids repeatedly drawing the same higher-timeframe zone on every lower-timeframe candle.
Each selected timeframe structure event is processed once.
**10. Preserved Original Indicator Behavior Where Possible**
Core behavior was kept intact:
* same supply/demand concept
* same overlap logic
* same historical zone settings
* same strength scoring model
* same color system
* same break labels
* same flow line controls
* same alert structure
**Bottom Line**
The original script was a single-timeframe supply/demand indicator. The updated version is now a true multi-timeframe supply/demand overlay designed for viewing higher-timeframe structure on lower-timeframe execution charts.
הערות שחרור
This update was less about changing the actual trading engine and more about transforming the indicator into a much more polished, professional, and user-friendly system. The structure engine itself stayed largely intact, while the usability, readability, and presentation layer evolved significantly. # Major Upgrade: Information Box System
The biggest visible addition is the new chart information panel.
The original version had no persistent status display. Once settings were configured, there was no quick way to visually confirm:
* whether repaint mode was enabled
* what structure timeframe was active
* what pivot settings were in use
* what ATR multiplier was controlling zone size
The updated version adds a dedicated floating info panel that acts like a live configuration dashboard directly on the chart.
It now displays:
* indicator name
* repaint status
* selected structure timeframe
* active chart timeframe
* pivot configuration
* zone sizing
This dramatically improves usability during active analysis because the trader no longer has to repeatedly open settings menus to verify configuration.
---
# Timeframe Display Was Humanized
One of the cleaner refinements was converting raw TradingView timeframe codes into readable text.
Originally:
* 240
* 60
* D
* W
Now:
* 4 Hr
* 1 Hr
* 1 Day
* 1 Week
This seems small but it substantially improves readability and reduces cognitive friction when quickly scanning the chart.
The indicator now feels much more polished and commercial-grade instead of developer-oriented.
---
# Info Box Became Fully Configurable
The information panel was also expanded into a customizable interface system.
New controls were added for:
* show/hide toggle
* screen position
* text size
* background color
* header color
* border color
* normal text color
* muted label color
This transformed the info box from a fixed overlay into a flexible chart UI component that can adapt to:
* dark themes
* light themes
* minimalist layouts
* high contrast layouts
* multi-monitor setups
---
# Indicator Branding Was Improved
The header row was redesigned into a dedicated centered title section.
Instead of appearing like plain table text, the indicator name now behaves more like a professional dashboard header.
This gave the entire tool a more premium visual identity.
---
# Structure Timeframe Messaging Was Refined
The timeframe guard system became cleaner and easier to understand.
Originally the warning displayed raw timeframe codes:
* Selected: 240 | Chart: 15
Now it displays:
* Selected: 4 Hr | Chart: 15 Min
This improves clarity immediately when invalid timeframe combinations occur.
---
# UI Organization Was Expanded
A completely new grouped section was introduced for the info box controls.
Originally all controls lived under:
* General
* Display
* History
* Filters
* Colors
* Flow Line
Now there is a dedicated:
* Info Box
group.
This improved settings organization significantly because presentation controls are now separated cleanly from trading logic controls.
---
# Internal Formatting Infrastructure Was Added
A new formatting helper system was introduced internally.
This formatter:
* converts timeframe values
* standardizes display text
* keeps labels visually consistent
That infrastructure now gives the indicator a reusable display layer for future UI additions.
This is important because it means future dashboard systems can now reuse consistent formatting logic instead of duplicating text conversions everywhere.
---
# Chart Professionalism Improved Significantly
This version crossed from:
“advanced custom script”
into:
“professional trading workspace tool.”
The difference is subtle but important.
The original version was technically powerful but heavily engineering-oriented.
The current version now has:
* visual hierarchy
* UI organization
* persistent configuration awareness
* cleaner terminology
* improved readability
* dashboard-style presentation
The trading engine became easier to trust because the state of the system is now always visible.
---
# What Did NOT Change
Importantly, the actual structural logic remained mostly unchanged between these two versions.
The following core systems remained intact:
* MTF processing engine
* non-repaint architecture
* strength engine
* overlap engine
* break logic
* zone logic
* triangle logic
* flow line system
* historical zone management
* scoring methodology
So this update was primarily:
* UI refinement
* chart usability
* readability enhancement
* workflow improvement
* professional presentation upgrade
rather than a structural trading logic rewrite.
הערות שחרור
Internal updates only.No change to current operations/logic.
Invalid Structure Timeframe Guard label updated.
This is the Warning Label that prints when the Chart TF > Structure TF.
הערות שחרור
Flow Line Timeframe SelectionA new Flow Line Timeframe control has been added to the Flow Line settings group, giving users the ability to choose which timeframe is used to calculate the Flow Line trend engine.
Previously, the Flow Line was always calculated from the selected Structure Timeframe. This worked well for higher-timeframe trend analysis, but some traders preferred a more responsive Flow Line that reflects the current chart timeframe.
With this update, the Flow Line can now operate independently of the zone engine while preserving the original behavior as the default setting.
New User Input
• Flow Line Timeframe
* Structure TF
* Chart TF
Input Description
Controls which timeframe is used to calculate the Flow Line trend engine.
• Structure TF
* Uses the selected Structure Timeframe for all Flow Line calculations.
* Trend direction, EMA slope, and ADX strength are derived from the same timeframe used to build Supply and Demand Zones.
* Produces smoother trend signals with less noise.
* Recommended for traders who want trend confirmation aligned with the higher-timeframe structure driving the zones.
• Chart TF
* Uses the current chart timeframe for all Flow Line calculations.
* Trend direction, EMA slope, and ADX strength are calculated directly from the visible chart candles.
* Produces faster and more responsive trend changes.
* Recommended for traders who want earlier trend signals and more sensitivity to short-term market movement.
Default Behavior
The default setting is Structure TF.
This preserves the original behavior of the indicator and ensures full backward compatibility with existing saved chart layouts, templates, and user settings.
Benefits of the Update
• Maintains the original higher-timeframe trend confirmation workflow by default.
• Allows users to choose between smoother higher-timeframe trend analysis and faster chart-timeframe trend analysis.
• Keeps the Supply and Demand zone engine completely unchanged.
• Improves flexibility for both swing traders and intraday traders.
• Provides greater control over how trend context is displayed without affecting zone creation, zone strength calculations, retouch detection, break detection, or alert functionality.
Indicator Logic Impact
This update affects only the Flow Line calculation engine.
No changes have been made to:
• Supply Zone formation
• Demand Zone formation
• Structure Timeframe processing
• Strength scoring
• Historical zone tracking
• Retouch detection
• Break detection
• Alerts
• Zone overlap protection
• Non-repainting behavior
All existing zone functionality remains unchanged.
הערות שחרור
A simple user input re-grouping and organization for an improved user experience:Disallow Same Zone & Disallow Different Zone Overlap toggles has been moved and are now located under the General group.
Historical Zones group has been move up in organization order and is now located below the General group inputs.
No input additions or removals.
No change to indicator code or logic.
הערות שחרור
## Info Box Enhancement UpdateThis update introduces a new **Info Box Detail Level** setting directly beneath the **Show Info Box** toggle. The purpose of this addition is to give users more control over how much information is displayed inside the chart information panel.
A new dropdown menu has been added with two options:
* **Compact**
* **Detailed**
### Compact Mode
Compact mode preserves the Info Box exactly as it existed before this update. Nothing about the layout, appearance, or displayed information changes when Compact mode is selected.
The box continues to display a concise summary of the most important operating settings, including:
* Current repaint mode
* Selected structure timeframe
* Current chart timeframe
* Pivot settings
* Zone size setting
This mode is intended for traders who want a clean chart and only need a quick confirmation of the core settings driving the indicator.
---
### Detailed Mode
Detailed mode expands the Info Box to provide a broader overview of the indicator's active configuration.
In addition to everything shown in Compact mode, Detailed mode also displays several advanced settings that directly affect how zones are created, filtered, stored, and managed.
The first section added is the overlap management settings. These settings allow users to quickly verify whether overlapping zones are currently permitted.
Detailed mode shows:
* Whether same-type zone overlap prevention is enabled
* Whether opposite-type zone overlap prevention is enabled
This makes it easy to confirm how aggressively the indicator is filtering new zone formations.
---
The next section displays historical zone settings.
Detailed mode shows:
* Whether historical zones are being displayed
* The current historical zone lookback value
* Whether the Historical Overlap Engine is enabled
These settings help users immediately understand how many previous zones are being retained and whether those historical zones are actively participating in overlap checks.
---
The final section displays active zone filter settings.
Detailed mode shows:
* Whether the Volume Filter is enabled
* The current Volume Multiplier setting
* Whether RSI Confirmation is enabled
* The current RSI Overbought and Oversold levels
This provides an at-a-glance view of the conditions that must be satisfied before a new supply or demand zone can form.
---
### Benefits of the Update
As the indicator has evolved, the number of available settings has increased significantly. While this flexibility is valuable, it can sometimes become difficult to remember exactly which configuration is currently active, especially when switching symbols, timeframes, templates, or testing different combinations of settings.
The new Detail Level selector solves this problem by allowing the Info Box to serve two different purposes.
* **Compact Mode** provides a clean status panel focused on the most important operating parameters.
* **Detailed Mode** provides a broader configuration summary that allows users to quickly verify overlap rules, historical zone behavior, and filter settings without opening the indicator settings menu.
Importantly, this update is purely informational. It does not change zone calculations, strength scoring, filtering logic, signal generation, or any other aspect of the indicator's behavior. It simply gives users greater visibility into the settings that are currently controlling the engine.
הערות שחרור
## Supply & Demand Zones XL — Update SummaryThis update fixes a gap in how the indicator handles zones that have been pushed to history by a newer zone forming. Previously, if a zone stopped being the "active" zone, the indicator essentially stopped watching it — meaning it would never turn gray or show a break marker even if price clearly closed through it. The update makes every displayed zone a fully monitored zone, regardless of whether it is the newest one or not.
---
### **What Was Broken Before**
- The indicator only ever watched one supply zone and one demand zone at a time — whichever was most recently formed.
- When a new zone formed, the previous zone was moved to "historical" display only. The indicator stopped checking it for breaks entirely.
- Price could close completely through a historical zone and nothing would happen — no gray color, no break marker, nothing.
- The zone would sit on the chart looking active and intact, even though it had been violated.
---
### **What The Update Does**
- Every zone currently displayed on the chart — active or historical — is now monitored for breaks on every bar.
- The first time price closes through a historical supply zone, that zone immediately turns gray, exactly like an active zone would.
- A break marker is placed on the exact candle that broke through the zone, matching the same shape, color, and size as the active zone break markers.
- The same logic applies to demand zones — if price closes below a historical demand zone, it turns gray and gets a marker.
- Once a zone is marked broken it will not fire again. It is a one-time trigger per zone, consistent with how active zone breaks are handled.
---
### **New Setting Added**
- A new toggle called **"Show Historical Break Markers"** was added under the Break Markers section, defaulting to on.
- This allows historical break markers to be turned off independently, for cases where the gray recolor is wanted but additional markers on the chart are not.
- The gray recolor on broken historical zones works regardless of whether this toggle is on or off.
הערות שחרור
**Supply & Demand Zones XL — Update Log**This release covers two updates: the addition of the Extend Zones To Chart Edge feature, and the migration of the entire script from Pine Script version 5 to version 6.
**Extend Zones To Chart Edge**
A new toggle was added to the General settings group called Extend Zones To Chart Edge. It is off by default so the indicator behaves exactly as before unless you turn it on.
- When enabled, every zone box — active and historical — stretches horizontally to the far right edge of your chart screen, projecting into future price space beyond the last closed bar
- This applies to all zones equally regardless of whether they are supply or demand, broken or intact, active or historical
- Zone colors, scores, touch detection, break detection, and overlap logic all continue to run identically regardless of the toggle state
- Break markers, pivot triangles, and the flow line are completely unaffected
- When the toggle is on, all zone strength score labels are automatically hidden — this is intentional since the labels are designed to sit just outside the right edge of their box, and when a box stretches to the screen edge there is no meaningful anchor point for them
- When you turn the toggle back off, strength labels reappear exactly as normal
**Pine Script Version 6 Migration**
The entire script was converted from Pine Script v5 to v6. This is an under-the-hood change with no impact on how the indicator looks or behaves. The specific technical changes made during migration include:
- Array declarations updated to the new typed syntax used in v6
- All `for` loops updated to include the explicit `by 1` step increment now required by v6
- `box.new()` and `label.new()` calls consolidated to the single-line named parameter format preferred in v6
- All string literals converted from double quotes to single quotes to match v6 style conventions
- The flow line plot updated to wrap `linewidth` in `math.max(1, ...)` to satisfy v6's minimum line width requirement
הערות שחרור
Non-Repaint logic applied to Break Markers.This was an internal code update/fix only.
הערות שחרור
**Supply & Demand Zones XL — Update Notes**This update adds a single new display control to the indicator that gives you cleaner, more focused charts when working with historical zones.
**What's New: Show Historical Broken Zones Toggle**
Located in the Display settings group, directly below the existing Show Zones toggle, this new option gives you direct control over whether broken historical zones remain visible on your chart. It is enabled by default, so existing users will see no change to their charts until they choose to use it.
When you uncheck this toggle, any historical zone that has already been broken by price — meaning price closed through it and invalidated it — is completely removed from view. This isn't just a color change or a fade. Every piece of visual information tied to that zone is hidden at once:
- The zone box itself disappears entirely
- The directional triangle marker at the pivot point is hidden
- The break marker that fired when price closed through the zone is removed
- The strength score label is cleared
When you re-enable the toggle, everything comes back together exactly as it was.
**Why This Matters**
As the indicator builds up historical zones over time, your chart can accumulate a lot of structure — including zones that price has already moved through and left behind. For many traders, those broken zones are noise. They've served their purpose, and keeping them on screen makes it harder to focus on what actually matters: the live, unbroken zones that price may still interact with.
This toggle lets you strip all of that away in one click. You keep the full benefit of the historical zone engine — overlap prevention, break tracking, and state management all continue running in the background — but your chart only shows you zones that are still structurally intact.
**What It Does Not Affect**
It's worth being clear about the boundaries of this toggle. It only targets historical zones that have been broken. Unbroken historical zones are completely unaffected and remain visible as normal. The active zone — the most recently formed zone on each side — is also untouched regardless of whether it has been broken. Existing controls like Color Historical Broken Zones still work independently and will apply if you choose to turn this toggle back on.
הערות שחרור
---**Bug Fix: Show Historical Broken Zones toggle now behaves consistently across all chart timeframes when using a Structure Timeframe.**
Previously, when unchecking "Show Historical Broken Zones" while viewing a lower chart timeframe than the Structure Timeframe (for example, a 5-minute chart with a 30-minute structure), broken historical zones would not fully disappear. The box colors were being hidden correctly, but the box geometry was still being updated and extended every bar regardless of whether the zone was supposed to be invisible. This caused broken zones to remain partially visible or interfere with the chart on lower timeframes, while behaving correctly on the same timeframe as the structure setting.
The fix ensures that when "Show Historical Broken Zones" is turned off, broken historical zone boxes are completely excluded from the bar-by-bar position and size update process — not just colored transparent. This makes the toggle behavior identical across all chart timeframes. Turning the toggle back on fully restores all broken zones, their markers, and their labels exactly as before.
---
הערות שחרור
---**New Feature: Broken Zone Lookback**
This update adds a new user input that gives you finer control over how many broken historical zones are displayed on the chart when the Show Historical Broken Zones toggle is enabled.
Previously, the toggle was all-or-nothing — either all broken historical zones were shown or none were. Now you can dial in exactly how many of the most recently broken zones stay visible, keeping your chart clean without losing context on the breaks that matter most.
**New Input: Broken Zone Lookback** (Display group, directly below Show Historical Broken Zones)
- Controls how many of the most recently broken historical zones remain visible on the chart
- Counts broken zones from newest to oldest — a setting of 1 shows only the single most recently broken zone, a setting of 2 shows the two most recently broken, and so on
- Older broken zones beyond the lookback number are fully hidden — their boxes, triangles, break markers, and strength labels are all suppressed
- Unbroken historical zones are completely unaffected regardless of this setting
- The Show Historical Broken Zones toggle remains the master on/off switch — when the toggle is off, all broken zones are hidden and the lookback setting has no effect
- Default is 2
This is useful when you want to see recent break context without the chart filling up with older broken zones that have lost their relevance.
---
הערות שחרור
Info Box updated to include Flow Line data.הערות שחרור
**Supply & Demand Zones XL — Update Notes**The Detailed info box now surfaces two additional settings that were previously only configurable in the indicator settings panel but never reflected on the chart itself. This makes it easier to confirm your broken zone display configuration at a glance without having to open the settings menu.
The two new rows appear directly below the existing **Hist Engine** row, keeping all historical zone-related settings grouped together in a logical sequence:
- **Hist Broken** — Shows whether historical broken zones are currently set to visible or hidden. It will display "Shown" when the Show Historical Broken Zones setting is enabled, and "Hidden" when it is turned off. This lets you instantly confirm whether broken zones are being rendered on the chart without digging into the settings panel.
- **Br Lookback** — Displays the current Broken Zone Lookback number. This is the setting that controls how many of the most recently broken historical zones stay visible on the chart before older ones get hidden. Seeing this value in the info box makes it easy to cross-reference why certain broken zones are visible while others have been cleaned up.
No other behavior, logic, or visual element was changed. Zone detection, strength scoring, break markers, overlap rules, and all other settings function exactly as before. This was purely a display addition to the info box.
הערות שחרור
## Supply & Demand Zones XL – Flow Line & ATR Channel Update LogThis update focused on making the **Flow Line system more useful, more customizable, and much cleaner to use on a day-to-day basis**. The goal was not just to add features, but to make those features feel like they belonged in the indicator from the beginning.
---
## Added an ATR Channel Around the Flow Line
The biggest enhancement was the introduction of an **ATR Channel** that surrounds the Flow Line.
Instead of only seeing the Flow Line itself, you can now visualize a dynamic envelope that expands and contracts with market volatility. This provides a clearer picture of how far price is stretching away from the trend and helps put price movement into context.
The ATR Channel:
* Moves with the Flow Line.
* Automatically adapts to changing market conditions.
* Can help highlight overextended moves.
* Gives the Flow Line more visual structure.
---
## Added a Dedicated ATR Channel Setting
A new setting was added directly below the Flow Line controls allowing users to adjust the size of the ATR Channel.
The new input:
* Defaults to **1.0**
* Has a minimum value of **0**
* Has a maximum value of **5**
* Adjusts in increments of **0.1**
This allows users to create:
* Very tight channels for aggressive trading styles.
* Wider channels for slower-moving markets.
* Completely disable the channel width effect by setting it to zero.
---
## Added a Show / Hide Toggle for the ATR Channel
A dedicated toggle was introduced so the ATR Channel can be turned on or off independently of the Flow Line.
This means users can:
* Use the Flow Line by itself.
* Use the Flow Line together with the ATR Channel.
* Quickly declutter the chart when desired.
The toggle defaults to **enabled**, ensuring new users immediately experience the enhanced version of the Flow Line.
---
## Added ATR Channel Style Controls
Users can now customize how the ATR Channel appears visually.
Available styles include:
* Solid
* Dashed
* Dotted
After testing multiple configurations, the default style was ultimately set back to **Solid** to maximize clarity and consistency across different chart backgrounds and zoom levels.
---
## Added ATR Channel Width Controls
Users now have full control over the thickness of the ATR Channel lines.
The ATR Channel Width:
* Defaults to **1**
* Can be increased if greater visibility is desired.
* Can be kept thin for a cleaner appearance.
This allows the channel to complement the Flow Line without overpowering other chart elements.
---
## Added ATR Channel Color Controls
A dedicated color setting was added specifically for the ATR Channel.
The default ATR Channel color is now:
* **Orange**
* With **50% transparency**
This was chosen because:
* Orange contrasts well against both light and dark themes.
* It remains visible without dominating the chart.
* It clearly differentiates the ATR Channel from supply zones, demand zones, and Flow Line trend states.
Users can still customize the color to suit their preferences.
---
## Reorganized the Flow Line Settings
The Flow Line section was reorganized to create a more natural workflow.
Settings now appear in a logical order:
### Flow Line Controls
* Show Flow Line
* Flow Line Speed
* Flow Line Timeframe
* Flow Line Width
### Flow Line Colors
* Uptrend Color
* Downtrend Color
* Consolidation Color
### ATR Channel Controls
* Show ATR Channel
* ATR Channel
* ATR Line Style
* ATR Line Width
* ATR Line Color
This makes the settings much easier to understand and navigate.
---
## Fixed ATR Channel Plotting Issues
One of the most important improvements addressed a problem where the ATR Channel did not extend across the entire Flow Line history.
Previously:
* The channel could stop unexpectedly.
* Portions of the historical Flow Line lacked ATR Channel coverage.
This behavior has been corrected.
The ATR Channel now:
* Extends consistently with the Flow Line.
* Remains visible across the entire plotted history.
* Behaves reliably regardless of timeframe selection.
---
## Simplified the Style Tab
The indicator originally exposed Flow Line and ATR Channel plotting elements within TradingView's **Style** tab.
Since all customization options already existed within the Inputs tab, these duplicate controls served little purpose and increased complexity.
The Flow Line and ATR Channel styling controls were therefore hidden from the Style tab.
Users now manage everything from a single location.
Benefits include:
* Cleaner indicator settings.
* Reduced confusion.
* Fewer redundant controls.
* A more polished user experience.
---
## Changed the Default Broken Zone Behavior
The indicator now defaults **Color Active Broken Zones** to enabled.
This means that when an active supply or demand zone is invalidated by price action, it immediately changes appearance to reflect that change in market structure.
Benefits include:
* Faster recognition of failed zones.
* Improved visual feedback.
* Reduced ambiguity during live trading.
---
## Overall Result
This update transformed the Flow Line from a standalone trend overlay into a **more complete trend framework**.
The new system now provides:
* Trend direction through the Flow Line.
* Volatility context through the ATR Channel.
* Greater flexibility through extensive customization options.
* A cleaner interface with less clutter.
* More intuitive defaults that work well immediately after installation.
The end result is an indicator that feels more refined, easier to use, and better suited for both discretionary analysis and active decision-making without sacrificing the clean visual design that defines Supply & Demand Zones XL.
הערות שחרור
### Flow Line Enhancement UpdateThis update expands the Flow Line feature by introducing a new operating mode while preserving the existing behavior that current users are familiar with.
### What's New
#### **New Flow Line Mode Selector**
A new **Flow Line Mode** dropdown has been added directly beneath the **Show Flow Line** toggle within the Flow Line settings section.
Users can now choose between two distinct ways of interpreting the Flow Line:
* **Advanced Line** *(Default)*
* **Simple Line**
---
## Advanced Line (Default)
The existing Flow Line behavior remains unchanged and is now labeled **Advanced Line**.
This mode is designed for traders who prefer stronger trend confirmation and reduced market noise. Rather than reacting to every minor price fluctuation, the Flow Line waits for multiple conditions to align before identifying a directional trend.
### Advanced Line Characteristics:
* Filters out many short-lived market moves.
* Focuses on stronger, more established trends.
* Helps reduce false directional changes during choppy conditions.
* Maintains the same experience that existing users have always had.
**No changes were made to the underlying behavior of this mode.**
---
## Simple Line (New)
A new **Simple Line** option has been introduced for traders who prefer a more direct interpretation of market direction.
In this mode, the Flow Line becomes a straightforward trend guide:
* When price is trading above the Flow Line, it displays an upward trend color.
* When price is trading below the Flow Line, it displays a downward trend color.
### Simple Line Characteristics:
* Reacts more quickly to price movement.
* Provides an easier-to-read directional bias.
* Removes additional confirmation requirements.
* Offers a cleaner experience for traders who prefer simplicity.
---
## Improved Flexibility
This update allows traders to tailor the Flow Line to their individual trading style.
### Traders who may prefer **Advanced Line**:
* Swing traders.
* Traders seeking higher-quality trend confirmation.
* Those who prioritize filtering out market noise.
* Users who already rely on the existing Supply & Demand Flow Line behavior.
### Traders who may prefer **Simple Line**:
* Momentum traders.
* Traders who want faster directional feedback.
* Users who prefer a minimalist trend tool.
* Those who use the Flow Line primarily as a visual market bias indicator.
---
## No Existing Workflows Were Disrupted
To ensure continuity for current users:
* **Advanced Line remains the default setting.**
* Existing indicator setups continue to function exactly as before.
* No Flow Line settings were removed.
* No zone calculations were altered.
* No changes were made to supply or demand zone generation.
Users who do not wish to use the new functionality will experience **no difference** after updating.
---
## Features Unaffected by This Update
The following Flow Line features continue to operate exactly as they did previously:
* Flow Line Speed settings (Fast / Medium / Slow)
* Flow Line Timeframe selection
* ATR Channel functionality
* ATR Channel styling options
* Flow Line width controls
* Flow Line color customization
* Supply and Demand zone calculations
* Historical zone behavior
* Strength scoring engine
* Break marker system
---
## Summary
This update transforms the Flow Line from a **single-behavior feature** into a **customizable trend tool** without sacrificing simplicity or backward compatibility.
Users can now choose between:
* **Advanced Line** → stronger trend confirmation with additional filtering.
* **Simple Line** → immediate trend bias based solely on price position relative to the Flow Line.
The result is a more versatile indicator that accommodates both traders who value confirmation and traders who value responsiveness.
הערות שחרור
**Supply & Demand Zones XL — Break Marker Update**When price breaks through a supply or demand zone, the indicator places a small marker on the chart to highlight that break event. Previously, that marker would follow price to wherever it was when the break was confirmed — meaning on a large gap or a fast explosive move, the marker could end up far away from the zone that actually broke, making it hard to visually connect the marker to the zone it belongs to.
**What Was Changed**
The marker is now anchored near the broken zone rather than chasing price.
- **Supply zone breaks** — the marker is placed at whichever price is lower: the low of the breaking candle, or the bottom edge of the broken supply zone. This keeps the marker pinned close to where supply failed, and also prevents it from sitting on top of or inside a candle that straddles the zone boundary.
- **Demand zone breaks** — the marker is placed at whichever price is higher: the high of the breaking candle, or the top edge of the broken demand zone. Same logic in reverse — the marker stays near where demand failed and does not overlap a candle that opens inside the zone and closes below it.
**Why It Matters**
- On gap breaks, the marker no longer floats up or down into empty space far from the zone
- The marker always visually connects to the zone it is describing
- Candles that partially overlap the zone are not obscured by the marker
- This applies to both the most recent active zone and all historical zones on the chart
הערות שחרור
**Supply & Demand Zones XL — Info Box Detail Change Log****What Changed and Why**
The Info Box Detail setting previously offered two options: Compact and Detailed. This was a binary choice — either you saw a minimal box with 7 rows of general information, or you saw everything at once with 19 rows. There was no middle ground. The update replaces this with a three-tier system using Small, Medium, and Large, giving you a more gradual and purposeful way to control how much the info box shows at any given time.
**Small (formerly Compact)**
Small is the new default and is functionally identical to what Compact used to show. Nothing about this tier has changed in terms of content — only the name. It displays seven rows total, covering the core settings you need at a glance:
- The header row showing the indicator name.
- Mode, confirming whether Non-Repainting is on or off.
- Structure, showing which timeframe the zone engine is running on.
- Chart, showing the current chart timeframe.
- Pivots, showing your left and right bar confirmation settings.
- Zone, showing the ATR multiplier used to size zone boxes.
- Flow Line, showing whether the flow line is on and how it is configured.
**Medium (new tier)**
Medium is the new middle option and did not exist before. It shows everything Small shows, then adds a second group of five rows dedicated entirely to Historical Zone settings. These rows appear directly below the general rows and cover:
- Historical, showing whether historical zones are set to be shown or hidden.
- Hist Lookback, showing how many past zones per side are being stored and displayed.
- Hist Engine, showing whether the historical overlap engine is active, meaning whether stored zones can block new overlapping zones from forming.
- Hist Broken, showing whether broken historical zones are being shown or hidden.
- Br Lookback, showing how many broken zones are allowed to remain visible before older ones are suppressed.
This tier is useful when you are actively working with historical zones and want to quickly verify those settings without cluttering the box with filter information you may not be using.
**Large (formerly Detailed)**
Large replaces what Detailed used to show, but with an important structural difference. In the old Detailed mode, the overlap settings appeared first at rows 7 and 8, followed by the historical zone settings. In the new Large tier, that order is reversed and reorganized by logical grouping. Large shows everything in Medium, then adds seven additional rows covering overlap behavior and all zone filter settings:
- Same Overlap, showing whether same-side zone overlap is blocked or allowed.
- Cross Overlap, showing whether opposite-side zone overlap is blocked or allowed.
- Volume Filter, showing whether the volume filter is on or off.
- Volume Settings, showing the SMA length and multiplier threshold being used by the volume filter.
- RSI Confirm, showing whether RSI confirmation is required for new zones to form.
- RSI Length, showing the RSI lookback period in use.
- RSI Levels, showing the overbought and oversold thresholds set for RSI confirmation.
**Summary of the Row Order Difference from Old Detailed**
The old Detailed mode showed overlap rows first, then historical rows, then filters — a somewhat arbitrary ordering. Large now groups information more logically: general settings first, then historical zone settings, then overlap and filter settings. The total row count of 19 is unchanged, only the sequence and grouping have been improved to flow from most-used to least-used information.
הערות שחרור
**Supply & Demand XL — Change Log****Info Box Display Improvements**
- When **Show Historical Broken Zones** is turned off, the **Br Lookback** field in the info box now displays `--` instead of a number, correctly reflecting that the setting has no effect in that state.
- When **Show Historical Zones** is turned off, the **Hist Lookback** field in the info box now displays `--` instead of a number, correctly reflecting that the setting has no effect in that state.
These are purely visual polish changes to the info box. No indicator logic, zone calculations, or behavior of any kind was modified.
הערות שחרור
You're right, my bad. Here's the accurate update note for just this session:---
**Supply & Demand Zones XL — Update Notes**
**Bug Fix: Orphaned Break Markers When Historical Zones Is Off**
When **Show Historical Zones** was turned off, break markers from previously broken zones were not being properly removed from the chart when a new zone formed. This caused a buildup of stale break markers scattered across the entire chart history, which had nothing to do with the current active zone. The fix ensures that whenever a new zone is created, any break marker left behind by the previous zone is cleanly removed before the new zone takes over. The chart now stays clean regardless of whether Historical Zones is on or off.
No indicator logic, zone detection, strength scoring, or any other calculation was affected.
הערות שחרור
**Supply & Demand Zones XL — Change Log**---
**Bug Fix: Break Markers Missing on Broken Historical Supply Zones**
When a supply or demand zone was broken while it was the active zone, and then a new zone formed pushing the broken zone into history, the break marker that had been placed on the broken zone was being lost. It was no longer connected to the historical zone system, so it would either disappear or behave unpredictably. The fix ensures that when a zone transitions from active to historical, its break marker is properly handed off and remains correctly attached to that zone going forward.
---
**Bug Fix: Break Markers Persisting When Show Historical Broken Zones Is Off**
When **Show Historical Broken Zones** was turned off, the zone boxes themselves would hide correctly, but the break markers on those zones remained visible on the chart. The fix ensures that when a broken zone is hidden, its break marker is fully removed from the chart as well. The zone, its triangle, and its break marker now all disappear together as expected.
---
**Info Box Default Changed to Medium**
The info box now defaults to **Medium** detail level instead of Small. This means the Historical Zones settings are visible in the info box out of the box without needing to manually change the detail level. This better reflects how most users will use the indicator since historical zone settings are core to how it behaves.
הערות שחרור
**Supply & Demand Zones XL — Change Log**---
**New Feature: Break Marker Position Control**
A new **Marker Position** dropdown has been added to the Break Markers settings group. This gives users direct control over where break markers appear on the chart when a zone is broken. There are three options:
- **Zone** — the marker is always placed exactly at the edge of the broken zone, creating a clean and consistent visual connection between the marker and the level that was violated. This is the default.
- **Candle** — the marker is always placed at the high or low of the breaking candle, which may suit users who prefer the marker to reflect the actual price bar that caused the break.
- **Dynamic** — places the marker at whichever point is closest to the zone between the zone boundary and the breaking candle. This handles gap situations naturally but produces less consistent placement across different market conditions.
This setting applies consistently to all break markers across both supply and demand zones, and across both active and historical zones.
הערות שחרור
---**What Was Fixed — The Core Bug**
The indicator had a structural problem where selecting a higher timeframe structure (e.g. 4H) while viewing a lower timeframe chart (e.g. 30M) would produce different zones on each chart. They should have been identical. The root cause was that the zone creation logic was allowed to fire on every chart bar, not just when a structure timeframe bar closed. On a 30M chart with 4H structure, that meant the zone state machine was processing 8 times more decision points than on the 4H chart, and could land on a different "active" zone as a result. The fix gates zone creation so it can only happen at the moment a new structure timeframe bar opens, making the zones consistent across all chart timeframes.
---
**What Did Not Change**
Every single feature, setting, input, and visual behavior is identical to the original. Nothing was removed, renamed, or reordered from a user perspective. Specifically unchanged:
- All inputs and their default values — every group, every toggle, every slider
- The strength engine scoring — formation volume, departure velocity, zone purity, endurance, wick and body touch penalties, recency decay
- Zone creation rules — pivot detection, ATR-based zone sizing, overlap blocking, same-zone and cross-zone overlap prevention
- Historical zone tracking — lookback count, broken zone display, broken zone lookback
- Volume filter and RSI confirmation filters
- Break markers — shape, size, color, position modes, historical break markers
- Strength score labels — active and historical
- Triangle markers at pivot points
- Flow line and ATR channel
- Info box — all detail levels, position, colors
- All six alert conditions
- Non-repainting mode behavior
- The invalid structure timeframe warning
---
**Syntax and Compliance Corrections (No Behavior Change)**
These were purely technical corrections required to make the code run cleanly in Pine v6. None of them change what the indicator does or how it looks.
- **Function definition ordering** — Pine v6 requires that a function be defined before it is called at the script level. Several helper functions in the original were defined after they were first used. All functions were reordered so every definition appears before its first call.
- **Explicit type annotations** — Pine v6 requires global-scope variables to have explicit type declarations. A number of variables in the original had their types inferred rather than declared. All of these were given explicit types such as `bool`, `float`, `int`, `string`, or `color`.
- **RSI source inside the structure function** — The original passed `rsiSource` (an input tied to the chart context) into the structure timeframe calculation. This is not permitted in Pine v6 when that function runs inside a different timeframe context. It was replaced with `close`, which is what the default setting already used, so no user-visible behavior changed.
- **Return tuple formatting** — Pine v6 does not allow a multi-line tuple on the left side of an assignment. The original split the variable list across several lines. This was collapsed to a single line.
- **Removed unused variables from the security return tuple** — `structureOpen` was returned from the structure function but never referenced anywhere in the code. It was removed from the return. This has no effect on anything.
- **File truncation repair** — The file was accidentally truncated mid-line during an earlier edit attempt, cutting off partway through the historical demand strength label section and losing everything after it including the info box, flow line plots, and alerts. The missing content was restored in full.
הערות שחרור
**Supply & Demand Zones XL — Update Notes**---
**What Was Fixed**
**Break Markers on Historical Zones**
Previously, when a historical demand or supply zone was broken by a confirmed close, the zone would correctly turn gray to signal the break — but the break marker (the X cross, arrow, or whatever shape you have selected) would silently fail to appear on it. This was the core bug being fixed in this update.
The root cause was three separate internal logic failures that all compounded each other. None of them were visible from the outside except for the missing marker.
---
**The Three Internal Problems That Were Causing It**
**Problem 1 — Zones Were Getting Each Other's Markers**
Every time a new zone was created, the indicator was accidentally filing the new zone's break marker placeholder into the wrong slot in its internal records. Think of it like a filing cabinet where someone keeps misfiling folders one drawer off. When a break finally happened and the indicator tried to stamp a marker on the correct zone, it was stamping it on the wrong one — or into empty space entirely. The fix ensures each zone gets its own reserved slot the moment it's created, and the previous zone's records are correctly archived at the same time.
**Problem 2 — The Indicator Was Looking Up Zone Boundaries From the Wrong Place**
The indicator maintained two separate lists of zone price levels — one attached to the visual boxes drawn on the chart, and a second separate list of numbers it used specifically for break detection on historical zones. These two lists were supposed to stay in sync, but they didn't always. When they drifted apart, the indicator would look up a zone's price range to check if price had broken through it, get the wrong numbers or nothing at all, and conclude no break had happened — even when one clearly had. The fix eliminates the second list entirely. The indicator now reads the zone's top and bottom price directly from the box drawn on the chart, so there is only one source of truth and it can never go out of sync.
**Problem 3 — Two Separate Systems Were Doing the Same Job Differently**
There were two completely separate code paths responsible for detecting historical zone breaks. One path handled detecting the break and drawing the marker. A second path handled detecting the break and updating the zone's broken status (which is what triggers the gray color). Because the coloring path and the marker path were independent, the color could update correctly while the marker path failed silently — which is exactly the symptom that was showing up on the chart. The fix merges these into a single unified process. A break is detected once, the zone's status is updated once, and the marker is drawn at the same moment. The two systems can no longer fall out of agreement with each other.
---
**What Is Unchanged**
Every setting, input, and visual behavior you had before works exactly the same way. Zone formation, strength scoring, touch detection, the flow line, the info box, all filters, all color options, historical lookback — none of that was touched. The only change is that break markers now correctly appear on historical zones that have been broken, matching the gray color that was already showing up correctly.
הערות שחרור
**What Was Wrong**The indicator has a "Non-Repainting Mode" setting. The purpose of this mode is to make the indicator wait until a bar is fully closed and confirmed before drawing or committing anything — zones, breaks, all of it. This prevents the indicator from drawing something on an unfinished bar and then changing or removing it later, which would be misleading.
The problem was in how "confirmed" was being defined. The indicator was checking whether the **chart bar** was confirmed and closed — not the **structure timeframe bar**. So if you were on a 15 minute chart with a 1 hour structure timeframe, the indicator would consider a bar "confirmed" every time a 15 minute candle closed, even though the 1 hour structure bar it was supposed to be waiting on hadn't closed yet.
This meant zones could be created or broken mid-way through a structure bar — at the close of the first, second, or third 15 minute candle inside that 1 hour bar — rather than waiting for the full 1 hour bar to finish. The end result was zones appearing on the lower chart timeframe that didn't match what the structure timeframe actually showed, because they were being committed too early based on incomplete information.
---
**What Was Fixed**
The indicator now correctly checks whether the **structure timeframe bar** is confirmed and closed, rather than the chart bar. So in non-repainting mode, nothing is drawn or committed until the actual structure bar you've selected has fully closed — regardless of how many smaller chart bars close inside it. The indicator now waits for the right moment, which is the close of the structure bar, every time.
---
**What Stays the Same**
If your chart timeframe and structure timeframe are the same, there is absolutely no change in behavior. The fix only has any effect when the structure timeframe is higher than the chart timeframe, which is the exact scenario where the bug existed.
הערות שחרור
**Changelog — Supply & Demand Zones XL****Version update: Input Tooltips Added**
What's new:
- Added hover tooltips to every input in the settings panel (75 total across all 9 groups: General, Historical Zones, Display, Info Box, Zone Filters, Strength Engine, Colors, Break Markers, and Flow Line).
- Each tooltip gives a plain-language explanation of what the setting does and, where relevant, how raising or lowering the value changes chart behavior.
- Settings panel is now self-documenting — no need to consult external notes or the source code to understand what an option controls.
Sections affected:
- General settings (non-repaint mode, structure timeframe, pivot bars, ATR length, zone sizing, overlap rules)
- Historical Zones settings (lookback counts, overlap engine, broken-zone visibility)
- Display settings (zone/triangle visibility, strength labels)
- Info Box settings (detail level, position, colors, text size)
- Zone Filters (volume filter, RSI confirmation)
- Strength Engine (formation volume, departure velocity, purity, endurance, and touch-penalty weights, recency decay)
- Colors (strong/weak zone colors, triangle colors, broken zone colors)
- Break Markers (marker visibility, position, shape, size, color)
- Flow Line (mode, speed, timeframe source, ATR channel, colors)
What was not changed:
- No changes to indicator logic, zone detection, scoring calculations, or chart drawing behavior.
- No inputs renamed, removed, reordered, or reset to different defaults.
- Output and visual behavior on the chart remain identical to the prior version.
Impact:
- Purely cosmetic/documentation improvement to the settings panel.
- Safe to update with no risk of altering existing chart output, alerts, or strategy behavior.
הערות שחרור
# Change Log — Broken Zone Trigger Update**What's New**
You can now choose how the indicator decides a zone has been "broken." Previously, a supply or demand zone was only marked broken when a candle's closing price moved through it. Now you have a choice between two methods.
**New Setting: Broken Zone Trigger**
Found in the **Break Markers** section of the indicator settings, right under "Show Break Markers."
- **Close** (default — this is how the indicator has always behaved): A zone only breaks when a candle *closes* beyond it. A wick that pokes through the zone but closes back inside does not count as a break. This is the more conservative, "wait for confirmation" approach.
- **Wick**: A zone breaks the moment any candle's high or low touches beyond it, even if the candle closes back inside the zone. This is a more sensitive, "react immediately" approach — it will flag breaks sooner, but may also produce more false breaks from quick wicks/spikes that get rejected and reverse.
**How to Use It**
1. Open the indicator settings and go to the **Break Markers** tab.
2. Find the **Broken Zone Trigger** dropdown.
3. Pick **Close** if you want fewer, more reliable break signals (recommended for most users — this is also the default, so existing setups won't change unless you switch it).
4. Pick **Wick** if you'd rather be alerted the instant price reaches into/through a zone, even on a brief spike.
**What This Affects**
This setting applies consistently everywhere a "break" is detected or shown, including:
- The currently active (most recent) supply and demand zones
- Older, historical zones still displayed on your chart
- Break marker arrows/shapes
- Zone color changes when a zone is marked broken
- Strength score freezing (a zone's score locks in at the moment it's considered broken)
- Break-related alerts ("Supply Zone Broken" / "Demand Zone Broken")
**No Other Changes**
Everything else — zone formation, strength scoring, colors, triangles, the info box, the flow line — works exactly as before. If you leave the new setting on its default (**Close**), the indicator behaves identically to the previous version.
הערות שחרור
# Change Log — Info Box: Broken Zone Trigger Display**What's New**
The on-chart info box now shows which Broken Zone Trigger mode (Close or Wick) you currently have active, so you don't have to open the settings panel to remind yourself.
**New Row: Br Mode**
- Located directly below the existing **Br Lookback** row.
- Displays **Close** or **Wick** depending on what you've selected in the Broken Zone Trigger dropdown (Break Markers settings group).
- Visible on the **Medium** and **Large** Info Box Detail settings. It is not shown on **Small**, consistent with how the other broken-zone-related rows (Br Lookback, Hist Broken, etc.) already behave.
**Layout Adjustment**
Adding this row meant every row below it had to shift down by one to keep the table aligned:
- On **Medium** detail, the info box now has 13 rows instead of 12 (the new Br Mode row is the last one shown at this detail level).
- On **Large** detail, the info box now has 20 rows instead of 19. The rows that previously appeared lower in the box — Same Overlap, Cross Overlap, Vol Filter, Vol Settings, RSI Confirm, RSI Length, and RSI Levels — are unchanged in content, just pushed down by one row to make space.
**No Other Changes**
This is purely a display addition. It doesn't affect zone detection, break logic, scoring, colors, or alerts — those continue to work exactly as defined by the Broken Zone Trigger setting itself. If your Info Box Detail is set to **Small**, you won't see any difference at all.
הערות שחרור
**Changelog — Strength Label Style Update****What changed:**
The numeric strength score tags (the "2/10", "6/10" labels shown at the edge of each supply/demand zone) can now be displayed in a new style: a side tag that points into the zone edge, instead of the original up/down pointer arrow style. This matches the look of indicator tags like SMA labels, so the strength scores blend in better with the rest of your chart instead of poking directly into price.
**New Inputs (found under the "Display" group):**
1. **Strength Label Style** — a dropdown with two choices:
- *Standard*: the original look. The score sits right at the zone's edge with a small arrow pointing up (for demand zones) or down (for supply zones).
- *End of Zone*: the new look. The score appears as a rounded tag floating to the side of the zone, with a small pointer touching the zone edge — visually similar to how an SMA label sits beside its line.
2. **End of Zone Offset (Bars)** — only active when "End of Zone" is selected above. This controls how far the tag floats away from the zone edge, measured in number of bars/candles. A higher number pushes the tag further to the right, clear of any nearby candles. This is currently set to a default of 1 bar, which keeps the tag close but just barely off the candles. Adjust this if you ever change timeframes and the tag starts overlapping price again.
**Where this applies:**
Both settings affect every strength label on the chart — the live score on your current active zone, as well as any historical scores left on past zones (if you have "Show Historical Strength Labels" turned on). So once you set your preferred style and offset, it stays consistent across the whole chart.
הערות שחרור
**Changelog — Overlap Engine Logic Fix****What the problem was:**
The "Use Historical Overlap Engine" toggle was secretly acting as a master on/off switch for the entire overlap system. If you turned it off, both "Disallow Same-Zone Overlap" and "Disallow Different-Zone Overlap" stopped working completely — even if they were checked on. There was no warning about this and nothing in the UI suggested it was happening. You could have both Disallow boxes ticked and believe overlap was being blocked, while in reality no blocking was occurring at all.
**What it does now:**
Each of the three overlap controls now does exactly one independent job and nothing more:
- **Disallow Same-Zone Overlap** — when on, prevents a new supply zone from forming on top of an existing supply zone, and a new demand zone from forming on top of an existing demand zone. This works regardless of any other setting.
- **Disallow Different-Zone Overlap** — when on, prevents a new supply zone from forming on top of an existing demand zone, and vice versa. Again, works regardless of any other setting.
- **Use Historical Overlap Engine** — controls how far back the above checks reach. When on, the checks look across your full zone history within your Historical Zone Lookback setting. When off, the checks only look at the single current active zone of each type.
**The practical difference:**
The engine toggle was always intended to answer the question "how far back do I look?" — not "do I look at all?" That intent is now correctly reflected in the code. Turning the engine off no longer disables overlap blocking; it simply narrows the scope of the check down to just the active zone.
**Why this matters:**
The original intent of the Historical Overlap Engine was specifically to prevent new zones from forming on top of historical zones that are still showing on the chart. That intent was being undermined by the bug — turning the engine off meant new zones could freely form anywhere, even directly on top of visible historical zones, with the user having no idea why.
**What hasn't changed:**
The default settings are unchanged — all three toggles default to on, which means most users will never have noticed the bug. Zone detection, scoring, break detection, display, and all other behaviour is identical to before.
הערות שחרור
Internal defaults, min, max, step values, and tool tips adjusted/updated for select inputs for an improved user experience.הערות שחרור
# Changelog: Supply & Demand Zones XL**Summary:** The "Show Zones" display toggle was coupled to internal tracking logic. Disabling zone box rendering also disabled touch counting, break detection, score calculation, and break/retouch alerts. Fixed by decoupling zone-tracking state from box-rendering state in five locations.
---
### 1. Touch Detection
**Location:** Touch Detection section.
**Before:** Touch counters (`supplyWickTouches`, `supplyBodyTouches`, and demand equivalents) only incremented when `not na(activeSupplyBox)` / `not na(activeDemandBox)` — i.e., only when the zone box was drawn.
**After:** Condition changed to `not na(supplyTop) and not na(supplyBot)` / `not na(demandTop) and not na(demandBot)` — the zone's tracked price levels, which are set whenever a zone forms, independent of rendering.
**Effect:** Wick and body touches are now counted whether or not the zone box is visible.
---
### 2. Break Detection — Active Zones
**Location:** "Break Detection — Active Zones" section.
**Before:** The block that evaluates whether price has broken through the active zone, and sets `activeSupplyBroken` / `activeDemandBroken` to `true`, required `not na(activeSupplyBox)` / `not na(activeDemandBox)`.
**After:** Condition changed to check the zone's price levels instead of the box object.
**Effect:** Zones can be correctly flagged as broken regardless of box visibility.
---
### 3. Current Strength Scores
**Location:** "Current Strength Scores" section.
**Before:** The live 1–10 score calculation (`currentSupplyScore` / `currentDemandScore`) required `not na(activeSupplyBox)` / `not na(activeDemandBox)`.
**After:** Condition changed to `not na(activeSupplyStartBar) and not na(supplyTop)` / equivalent for demand.
**Effect:** Strength scores compute continuously, independent of box visibility.
---
### 4. Break Alertconditions
**Location:** Alerts section.
**Before:** `supplyBroke` and `demandBroke` — the flags driving the "Supply Zone Broken" / "Demand Zone Broken" alertconditions — required `not na(activeSupplyBox)` / `not na(activeDemandBox)`.
**After:** Condition changed to check the zone's price levels instead of the box object.
**Effect:** Break alerts fire correctly regardless of box visibility.
---
### 5. Zone Retouch Alertconditions
**Location:** Alerts section.
**Before:** The "Supply Zone Retouch" / "Demand Zone Retouch" alertconditions required `not na(activeSupplyBox)` / `not na(activeDemandBox)`.
**After:** Condition changed to check the zone's price levels instead of the box object.
**Effect:** Retouch alerts fire correctly regardless of box visibility.
---
### 6. "Show Zones" Input Tooltip
**Location:** Input declaration, Display group.
**Before:** Tooltip described the setting only as a "master toggle for drawing supply and demand zone boxes."
**After:** Tooltip updated to state that the setting is purely visual and does not affect zone tracking, touch counting, break detection, scoring, or alerts.
**Effect:** Documentation only — no functional change.
---
### Unchanged
- All strength engine inputs, weights, and scoring formulas (`f_zone_strength_v2` and its helper functions).
- Box coloring, box extension-to-edge, and label rendering logic — still gated by "Show Zones," since these are rendering operations with no effect if no box exists.
- All other sections of the script, including the pre-existing `structureBarConfirmed` non-repaint fixes that were already present before this changelog's changes were made.
הערות שחרור
Updated internal min/max/step values on select inputs for an improved user experience.הערות שחרור
**What Changed, In Plain English**The Flow Line is the colored trend line you can overlay on your chart. It's built from a moving average — a line that smooths out price so you can see the underlying direction instead of every wiggle. Before this update, you picked its speed with vague labels (Fast, Medium, Slow) and had no idea what numbers were behind them. Now the numbers are visible in the dropdown itself, and two new slower options have been added for longer-term trend reading.
**The Updated Input: Flow Line Speed**
Located in the Flow Line settings group. The dropdown now shows five options instead of three:
- **Fast (21)** — Hugs price closely and reacts within days of a shift. Best for short-term trading where you want to catch turns early, at the cost of more false signals.
- **Medium (34)** — The default. A balanced middle ground between responsiveness and smoothness. Good for swing trading.
- **Slow (55)** — Smoother and slower to turn. Filters out more noise; better for position trades where you only care about meaningful shifts.
- **Slower (100)** — *New.* A widely-watched intermediate-term baseline. Price above a rising 100-line is broadly healthy; below it, caution. Reacts to weeks of movement, not days.
- **Slowest (200)** — *New.* The classic long-term dividing line many traders use to define bull vs. bear territory. It moves glacially — think of it as the "big picture" line that ignores everything short-term.
Nothing else about how you use it changed — pick one from the dropdown, done. The numbers in parentheses are simply the lookback lengths that were previously hidden.
**How the Coloring Works With the New Options**
The line colors itself: green (uptrend), red (downtrend), gray (no clear trend). How it decides depends on Flow Line Mode:
- **Simple Line mode** — Green when price is above the line, red when below. Works identically for all five speeds, including the new ones. Nothing to learn here.
- **Advanced Line mode** — Stricter. It requires three things at once: the line is actually sloping in that direction, price is on the correct side of it, and the market shows genuine trend strength (measured internally). If any of those fail, the line stays gray.
The important part of this update: **the Advanced mode's strictness now scales sensibly for the two new slow options.** A 200-length line barely tilts even in real trends — if we'd demanded the same steepness from it that we demand from the fast line, it would sit gray forever and be useless. So the new options require only slightly more slope, but demand noticeably *stronger* overall trend conditions before coloring. Practical effect: on Slower (100) and Slowest (200), a green or red line means the trend is genuinely established, not just a bounce. Expect more gray on those settings — that's by design, not a bug.
**How To Actually Use This**
- **Match speed to your holding period.** Day-to-swing trades: 21 or 34. Multi-week swings: 55. "Should I even be long this thing at all?": 100 or 200.
- **Use the slow lines as a filter, not a trigger.** A common approach: only take demand-zone entries when the Slowest (200) line is green, only take supply-zone entries when it's red. The new options exist precisely for this kind of regime filtering.
- **Gray on 100/200 means "no dominant long-term trend."** In Advanced mode that's useful information by itself — it tells you the market is ranging at the big-picture level, so zone-to-zone trading may work better than trend-following.
- **The info box updates automatically** — it now displays the full label (e.g. "Slowest (200) / Structure") so you can see your setting at a glance.
**Two Things To Know**
- **Your saved setting will reset once.** Because the option names changed, any chart already running this indicator will snap back to Medium (34) after you update the code. Re-select your preference one time and it sticks.
- **The strictness values for 100/200 are reasoned starting points, not tested-in-stone constants.** I extrapolated them from your existing three tiers using sound logic, but there's no universal "correct" threshold — it varies by instrument and timeframe. If the 200 line feels permanently gray on your charts, or flips colors too eagerly in chop, tell me which way it's misbehaving and I'll adjust the internal values (or expose them as user inputs so you can tune them yourself).
One formatting note: this is your own custom indicator's internal logic, so there are no external sources to cite — everything above describes the code we just wrote. The general characterizations of the 100/200 moving averages as long-term trend references reflect standard, widely-taught technical analysis convention rather than any single citable study.
הערות שחרור
**What the Update Does — In Plain English****The Problem**
- The flow line has five speed settings, from Fast to Slowest. The slower settings (100 and 200) were stuck on gray almost permanently — even when the line was clearly climbing or falling on your chart, as you circled.
- Gray is supposed to mean "no clear trend." But the slow lines were showing gray during obvious trends, which made the color feature useless at those speeds.
**Why It Was Happening**
- Think of the flow line like a heavy freight train versus a sports car. The Fast line is the sports car — it turns and accelerates quickly, producing sharp, visible movement. The Slowest line is the freight train — by design, it moves gradually and smoothly, and it physically *cannot* make sharp moves. That slowness is its whole purpose: it filters out noise.
- The old code, however, demanded that the slow lines move *more* steeply than the fast ones before it would award a color. It was asking the freight train to out-accelerate the sports car. That's a standard the freight train can never meet — not "rarely," but essentially never. So the line stayed gray no matter what the market did.
- The requirement was backwards: the steepness bar should get *lower* as the line gets slower, matching what each line is actually capable of.
**What the Fix Changes**
- **The steepness bar now matches each line's nature.** Fast lines still need a sharp move to color; slow lines need a gentler but *sustained* move — proportionate to what a slow line genuinely does during a real trend.
- **Slow lines are now judged over a stretch of time, not a single moment.** Instead of asking "did you move this instant?", the code asks "have you been steadily moving over the last stretch of bars?" That's the fair question for something designed to be gradual, and it keeps one noisy bar from faking or hiding a trend.
- **The trend-strength safety check was loosened slightly for slow lines.** There's a second gate (ADX) that vetoes coloring when the market lacks conviction. Its bar was set high enough that it was piling on to the problem. It's been eased just enough to stop blocking legitimate trends — and per your requirement, the ADX calculation itself is untouched: standard 14-period, based on the flow line's timeframe setting.
**What You Should See Now**
- All five speeds behave consistently: colored during genuine up and down moves, gray during genuinely flat stretches.
- Your circled flat periods will *still* go gray — the fix didn't remove the gray state, it removed the impossible standard. Flat is flat at any speed.
- Faster lines will still change color more often than slower ones. That's correct and intentional — it's the personality difference between the speeds, not a bug.
- Nothing else in the indicator changed: zones, strength scores, break markers, and alerts are all exactly as they were.
הערות שחרור
Internal min, max, & step values updated for select inputs for an improved user experience.הערות שחרור
**What Was Added**A new setting called **Strength Label Size** that lets you control how big the strength score labels (the "7/10" tags on your zones) appear on the chart. Before this update, those labels were permanently locked at Small — there was no way to change them.
**Where You'll Find It**
- It sits at the **top of the Strength Engine group** in the indicator settings, right above "Formation Volume Weight."
- It's a dropdown with four choices: **Tiny, Small, Normal, Large**.
- The default is **Small**, which is exactly what the script used before — so if you never touch it, nothing looks different.
**What It Controls**
- The **active zone labels** — the score tags on your current supply and demand zones.
- The **historical zone labels** — the score tags on older zones (when you have "Show Historical Strength Labels" turned on).
- Both supply and demand sides use the same size, and it applies whether your label style is set to Standard or End of Zone.
**What It Does NOT Control**
- The triangle pivot markers (still fixed at Tiny).
- The break markers (still controlled by their own "Marker Size" setting in the Break Markers group).
- The info box text (still controlled by its own "Text Size" setting).
**How It Works Under the Hood**
- Your dropdown choice (a plain text value like "Normal") gets translated into Pine Script's internal size constant (like `size.normal`) in one resolver line.
- That resolved size is passed into all four places where strength labels are created — active supply, active demand, historical supply, historical demand.
- Each label's update code also re-applies the size every bar, so existing labels on the chart resize immediately when you change the setting instead of waiting to be redrawn.
**Bottom Line**
One dropdown, one job: pick how big the zone strength scores look. Everything else in the script — zone logic, scoring, alerts, colors — is byte-for-byte unchanged.
הערות שחרור
**Update: Triangle Size Setting****What Changed**
This update adds one new user setting: a **Triangle Size** dropdown in the **Display** settings group, located directly under the **Show Triangles** toggle. It controls how big the triangle markers appear on your chart — the small triangles drawn at the exact pivot point (swing high or swing low) where each supply or demand zone was formed.
**The New Setting**
- **Name:** Triangle Size
- **Location:** Display group, immediately below Show Triangles
- **Type:** Dropdown menu
- **Options:** Tiny, Small, Normal, Large, Huge
- **Default:** Tiny
**How It Works**
- When a new supply zone forms, a downward-pointing triangle is drawn above the zone; when a new demand zone forms, an upward-pointing triangle is drawn below it. The size you select in the dropdown is applied to every one of these triangles, both supply and demand.
- Changing the dropdown causes the script to fully recalculate, so **all triangles on the chart** — current and historical — redraw at the newly selected size. You don't end up with mixed sizes.
- The setting is purely visual. It has no effect on zone detection, strength scoring, touch counting, break detection, or alerts.
**What It Does NOT Change**
- **Triangle position:** Vertical placement is still controlled by the separate "Triangle Edge Offset (ATR)" setting.
- **Triangle color:** Still controlled by "Supply Triangle Color" and "Demand Triangle Color" in the Colors group.
- **Triangle visibility:** Still controlled by the "Show Triangles" toggle. If that's off, the size setting is irrelevant.
- **Other markers:** Break markers and strength labels have their own independent size settings and are unaffected.
**Compatibility Note**
The default is Tiny, which matches the previously hardcoded size. Existing charts will look **exactly the same** after updating unless you deliberately change the dropdown — there is zero visual or behavioral change out of the box.
הערות שחרור
**Supply & Demand Zones XL — Change Log****Change**
The Flow Line row in the info box now displays only the numeric EMA length instead of the full dropdown label.
- **Before:** `Slowest (200) / Structure`
- **After:** `200 / Structure`
**Scope**
- Info box display only.
- One line of the script affected.
- No changes to zone logic, strength scoring, break detection, alerts, or plotting.
**Details**
- The Flow Line row previously pulled its text directly from the Flow Line Speed dropdown selection, which stores the descriptive label verbatim — word, number, and parentheses.
- It now pulls from the internal EMA length value that the indicator already calculates and uses to draw the Flow Line itself.
- The Flow Line Speed dropdown in the settings menu is unchanged and still reads "Slowest (200)".
- The "OFF" display when Flow Line is disabled is unchanged.
**Secondary Benefit**
- The info box and the plotted line now read from the same value, so the panel can no longer display a speed that differs from what is actually drawn on the chart.
**Known Trade-off**
- The number appears without a unit label, so the reading assumes familiarity with what the value represents. An optional variant prefixing "EMA" would resolve this at the cost of a slightly wider panel.
הערות שחרור
Adjusted internal max value default on Historical & Broken Lookback to prevent user hitting runtime limitations.הערות שחרור
**Supply & Demand Zones XL — Optimization Release****Summary**
The indicator was exceeding TradingView's script runtime limit and failing to load reliably. The cause was identified as redundant per-bar work rather than any flaw in the zone logic. All calculations, signals, and visual output are unchanged. The runtime warning no longer appears.
**Root Cause**
The indicator recalculated its entire visual state on every historical bar. Because chart drawings retain only whatever values were assigned to them last, every one of those passes was immediately overwritten by the next and never appeared on screen. On a full dataset this amounted to hundreds of millions of discarded calculations.
This was compounded by a counting routine that re-scanned the full zone history from within another scan of the same history, repeated in six separate places. The cost of that pattern grows with the square of the number of zones retained, so it scaled punishingly at higher lookback settings.
**Performance Changes**
- **Visual work deferred to the final bar.** Zone colors, zone extension, and strength label placement are now calculated once, at the point where they become visible, instead of on every bar. Zone detection, break detection, touch counting, and strength scoring continue to run on every bar exactly as before, because those establish state that must persist.
- **Zone history counting rewritten.** The six repeated nested scans were consolidated into a single pass that produces identical results. The workload now grows in direct proportion to the number of zones retained rather than by its square.
- **Duplicate strength calculation removed.** Each zone's strength score was being computed twice per bar from identical inputs. It is now computed once and reused.
- **Score storage simplified.** Strength scores were being converted into display text and then converted back into numbers, for every stored zone, on every bar. Scores are now retained in numeric form throughout.
- **Redundant data request removed.** The indicator was issuing a second request for higher-timeframe data to retrieve a single value. That request has been eliminated.
- **Unused drawing allocation removed.** The indicator reserved capacity for 500 trend lines despite drawing none. That reservation has been dropped.
- **Dead code removed.** One function was defined but never called anywhere in the script.
Per-bar workload was reduced from roughly fifteen thousand operations to approximately one hundred.
**Corrections**
- A block of code claimed to verify that the higher structure timeframe bar had closed before confirming a zone. Platform documentation states that the mechanism it used does not function inside a higher-timeframe data request and reports only the chart's own bar state. The code never performed the action its comment described.
- Investigation confirmed the underlying feature was never actually dependent on that mechanism. Structure-bar closure is established elsewhere in the indicator through the detection of a new structure bar opening. The removed code was contributing cost without contributing behavior. Non-repainting operation across mixed timeframes was tested and confirmed working.
- An internal comment that misdescribed this behavior has been corrected.
**Settings Changes**
- Historical Zone Lookback maximum reduced to 50.
- Broken Zone Lookback maximum reduced to 20.
- The Historical Zone Lookback description now notes that it is the single largest driver of runtime cost.
- The Broken Zone Lookback description now notes that a value of zero hides every broken zone immediately, which is the opposite of what the setting name implies to most readers.
**Display Changes**
- The info box Flow Line row now shows only the numeric length rather than the full descriptive dropdown label. It reads from the same value that draws the line, so the panel can no longer report a speed that differs from what is plotted.
**Verification**
- Script contents were checked mechanically to confirm the removals took effect: one data request, no trend lines, no nested scans, no text-to-number conversion, and the reduced strength calculation count.
- The rewritten counting routine was proven to return identical values at every position, including the boundary cases at the newest and oldest stored zones.
- Output was compared against the unmodified original on live charts. Zone positions, colors, break markers, and strength scores matched.
- Behavior was confirmed on both matched and mixed chart/structure timeframe configurations.
**Unchanged**
- All zone detection, filtering, and overlap logic.
- The strength scoring engine, its weights, and recency decay.
- Break detection, break markers, and all six alert conditions.
- All colors, sizes, positions, and every user-facing setting other than the two maximum values noted above.
- Flow line calculation and plotting.
**Remaining Performance Headroom**
- Historical Zone Lookback is the dominant cost. Reducing it lowers runtime proportionally.
- Broken Zone Lookback carries no runtime cost. Raising it reveals additional zones for free.
- Historical break detection still runs on every bar by necessity, since it establishes state. It is now the largest remaining per-bar cost and would be the first place to examine if further reduction is ever needed.
- The moving average, volatility, and trend-strength calculations run on both the chart and structure timeframes on every bar, regardless of whether the flow line is enabled. This is a genuine cost that cannot be safely removed, as these calculations depend on being called consistently on every bar to remain accurate.
הערות שחרור
# Supply & Demand Zones XL## Higher-Timeframe Non-Repainting Fix
### Update Summary
This update corrects a timing issue affecting Non-Repainting Mode when the Structure Timeframe is higher than the chart timeframe.
Previously, the indicator could treat the closing of a smaller chart candle as confirmation that the larger structure candle had also closed. This allowed zones, breaks, strength scores, and other structure-based information to be processed before the higher-timeframe candle was complete.
The indicator now waits for the selected higher-timeframe candle to fully close before using its information.
---
## What Was Fixed
For example:
* Chart timeframe: 15 minutes
* Structure timeframe: 4 hours
* Non-Repainting Mode: Enabled
Previously, the indicator could process information after a 15-minute candle closed, even though the 4-hour structure candle was still developing.
This could cause live results to change after refreshing the chart because the unfinished 4-hour candle could still produce a different:
* High or low
* Closing price
* Volume reading
* Momentum reading
* Volatility reading
* Pivot
* Zone
* Break signal
* Strength score
The update prevents incomplete higher-timeframe information from being treated as confirmed.
---
## New Behavior
When Non-Repainting Mode is enabled and the Structure Timeframe is higher than the chart timeframe:
* Only completed structure candles are used.
* Zones wait for full higher-timeframe confirmation.
* Breaks wait for full higher-timeframe confirmation.
* Strength scores use finalized structure information.
* Touch tracking uses completed structure periods.
* The Structure Timeframe Flow Line uses confirmed values.
This makes live results more consistent with refreshed and historical chart results.
---
## Expected Differences
The update may cause some signals to appear later.
This is intentional because a higher-timeframe signal cannot be fully confirmed until that candle closes.
Possible visible differences include:
* Zones appearing later
* Temporary zones no longer appearing
* Break markers appearing later
* Strength scores updating less frequently
* Structure-based Flow Line changes occurring less often
* Fewer changes after refreshing the chart
The updated behavior favors confirmed and stable signals over early signals based on incomplete information.
---
## Behavior by Setting
### Higher Structure Timeframe with Non-Repainting Enabled
Changed behavior:
* Uses only completed higher-timeframe candles
* Prevents premature zone and break confirmation
* Reduces repainting risk
### Structure Timeframe Equal to Chart Timeframe
Existing behavior is preserved:
* The chart candle is processed after it closes
* No additional delay is added
### Non-Repainting Mode Disabled
Existing real-time behavior is preserved:
* Developing structure information is used
* Signals may appear before the candle closes
* Results may change while the candle is forming
---
## What Was Not Changed
The update does not change:
* Zone calculations
* Pivot settings
* Overlap filters
* Volume or momentum filters
* Strength scoring rules
* Touch penalties
* Historical-zone settings
* Zone colors
* Labels and markers
* Alerts
* Info Box settings
* Flow Line speed or trend settings
* Existing performance optimizations
All current settings remain available and existing chart configurations should continue to work normally.
---
## Result
Non-Repainting Mode now correctly distinguishes between a completed chart candle and a completed higher-timeframe structure candle.
Higher-timeframe zones, breaks, strength scores, touch tracking, and trend information are now based on finalized candles rather than partially formed candles.
This improves signal stability and reduces differences between live, refreshed, and historical chart results.
הערות שחרור
# Supply & Demand Zones XL — Change Log**Summary**
The *Extend Zones To Chart Edge* checkbox has been replaced by a five-option dropdown named **Zone Extension**, found at the bottom of the General section. It separates two decisions that used to be locked together: which zones stretch to the right edge, and whether the strength score tags stay visible while they do.
Zone formation, scoring, break detection, and alerts are unchanged. This is purely a drawing setting.
**Why the labels used to disappear**
Ticking the old checkbox silently removed every strength score tag, with nothing in the interface explaining it. That was a workaround, not a design choice — a stretched box keeps an invisible endpoint frozen where it was first drawn, and tags were positioned against that endpoint, so they would have appeared stranded mid-box. Tags now position themselves correctly whether a box is stretched or not, which is what makes the label-visible options usable.
**The five options**
- **Off** (default) — every box stops at the most recent bar, tags visible. Matches the original with the checkbox unchecked.
- **Extend All Zones** — every box reaches the right edge, tags visible.
- **Extend All Zones (No Labels)** — same, tags hidden. Matches the original with the checkbox ticked.
- **Extend Active Zones** — only the newest supply and demand box reach the edge, tags visible.
- **Extend Active Zones (No Labels)** — same, tags hidden.
**Choosing between them**
- **Identifying the live zones instantly** — *Extend Active Zones*. Only two boxes ever reach the edge, and they are always the current ones, so reaching the edge is itself the signal.
- **Trading against current levels** — either stretching option. The question is whether older zones alongside them are context or clutter.
- **Reviewing past behaviour** — *Off*. Zones stay anchored to the period they actually covered, which stretching obscures.
- **Minimum clutter** — *Extend Active Zones (No Labels)*.
**Reading the tags**
The number is a 1–10 strength score that updates as a zone ages and gets touched. The colour shows strong versus weak against the threshold in the Colors section, and grey means the zone has been broken. With historical labels off, which is the default, only the two current zones carry tags.
**Settings worth knowing about**
- **Show Strength Labels** remains the master control. The *(No Labels)* options can hide tags while it is on, but cannot bring them back when it is off.
- **Show Historical Strength Labels** pairs badly with *Extend All Zones* — every tag gathers in one vertical column and overlapping zones become unreadable. It works normally in the other options.
- **End of Zone Offset (Bars)** pushes tags further right if they crowd the candles. Raising it costs nothing.
- **Historical Zone Lookback** has more visual impact under *Extend All Zones*, since every stored zone stretches at once.
**Upgrading**
Because the control changed from a checkbox to a dropdown, saved layouts will not carry the old value across and will load showing *Off*. Charts that previously had it unchecked already match. Charts that had it ticked should select *Extend All Zones (No Labels)* to restore the previous appearance. No other setting is affected.
הערות שחרור
**The Problem Being Fixed**Zone strength scores were moving while a candle was still forming. With Non-Repainting Mode switched on, a score would drift up and down as price ticked along, settling only once the bar completed. That defeats the purpose of the setting — a number that changes before the bar closes can't be trusted as a decision point, because what appears mid-candle may not be what remains.
**Why It Was Happening**
Non-Repainting Mode was only being applied to part of the indicator. It correctly governed when new zones were permitted to appear and when a zone counted as broken. The strength scoring engine, however, was left running freely on every price update regardless of that setting.
Two separate ingredients feeding the score were live:
- **The volatility reference.** Departure velocity — how forcefully price left a zone after it formed — is measured against a volatility reading. The distance travelled was locked in at formation, but the volatility it was being compared against was re-read from whatever candle happened to be in progress. Each new high or low in that live candle shifted the reading, which shifted the ratio, which shifted the score.
- **The touch counters.** A score is penalized each time price wicks into a zone, and penalized considerably more when price closes inside it. "Closing inside" was being judged against live price rather than a finished close, so price drifting in and out of a zone during a single candle added and removed penalties repeatedly.
Body touches carry the heaviest penalty weight of any factor in the engine, which made the second cause the more visible one. Scores could jump several points and fall back inside a single candle.
**What Changed**
- The volatility reference is now captured once, at the moment a zone forms, and held for that zone's lifetime. It now matches the same moment and same timeframe as the distance it's measured against, which was the original design intent.
- Touch counting waits for a confirmed bar before recording anything. A candle wandering in and out of a zone now registers one outcome rather than a running tally.
- Zone creation, break detection, and touch counting all answer to a single shared definition of "confirmed" instead of each carrying its own version.
**Behavior After the Update**
With Non-Repainting Mode on, a zone's score holds steady for the full duration of a candle and updates only at close. On a higher structure timeframe, it updates once per structure period.
Scores still change from one bar to the next, and that is by design. Two factors are built to move with time — a zone surviving untouched earns credit for endurance, while an aging zone gradually loses credit through recency decay. The distinction that matters: the value is fixed within each bar, and no past value is ever rewritten after the fact.
With Non-Repainting Mode off, live intrabar behavior is unchanged. That toggle is doing exactly what it advertises.
**What Was Not Changed**
- No settings added, removed, renamed, or re-defaulted.
- Alerts fire on the same conditions at the same times, including the retouch alerts, which still evaluate live.
- Break marker placement and timing are identical.
- Zone drawing, coloring, extension modes, triangles, the flow line, and the info panel are untouched.
הערות שחרור
# Triangle Anchoring Update**Scope:** Only the pivot triangle markers changed. Zone detection, boxes, strength scoring, break markers, historical logic, flow line, info box, and alerts are untouched.
**What changed:** The old hardcoded offset (which floated triangles ~1 ATR off the edge) was removed and replaced with a selectable anchoring system, controlled by two new inputs in the **Display** group.
**Constraint:** Pine draws triangle markers centered on their anchor, sized in pixels not price, so true tip-on-edge isn't possible. The two modes below are each an approximation.
## New inputs
**Triangle Anchor Mode** — dropdown (*Fixed Pixel* / *ATR*), default *Fixed Pixel*. Sets how the triangle pins to the pivot bar high/low.
**Triangle ATR Offset** — number, default *1*, range *0–3*, step *0.05*. Gap from the bar high/low to the triangle, in ATR units. Active only in ATR mode; ignored in Fixed Pixel mode.
## The two modes
- **Fixed Pixel (default):** native bar attachment. Tip touches the exact high/low at every zoom — truest tip-to-edge. Trade-off: a fixed pixel margin makes spacing look uneven between tall and short bars (cosmetic, not a positioning error).
- **ATR:** places the marker by price using the offset. Spacing scales with volatility and reads evenly across bars. Trade-off: tip is approximate and can drift slightly at extreme zoom.
Fixed Pixel favors tip accuracy; ATR favors consistent spacing.
## How to use
Fixed Pixel is the default and gives the most accurate tip placement. To switch to volatility-scaled spacing, set Anchor Mode to **ATR** and tune the offset. At the default **1**, the triangle sits a full ATR off the edge (noticeable gap). A value of **0.10–0.30** keeps it close while preserving even spacing; **0** puts the marker center on the edge, with the tip crossing slightly into the box. The offset has no effect in Fixed Pixel mode.
הערות שחרור
# Supply & Demand Zones XL — Update Summary## What's New
This update adds one setting: a dropdown that controls which broken zones stay on your chart. You'll find it in the Historical Zones group, right below Broken Zone Lookback.
## Background
The indicator marks significant price areas as zones. When price pushes all the way through one, that zone is "broken." Broken zones aren't always useless to see, so the indicator keeps a set number of them on screen before clearing out the rest to reduce clutter. The Broken Zone Lookback setting controls *how many* it keeps. This update doesn't change that number — it adds a choice about *which* ones count as worth keeping.
## The New Setting: Broken Lookback Mode
Two options:
**Formation Order** keeps the broken zones that were *created* most recently. It cares about the zone's age. An old zone gets cleared away sooner, even if it just broke.
**Break Order** keeps the broken zones that *broke* most recently, regardless of the zone's age. A zone that formed long ago but only just got pushed through stays on your chart, because its break is fresh.
## Why It Matters
Most of the time both modes look similar. They only diverge in one case: when an old zone breaks late. Formation Order may clear that zone away for being old; Break Order keeps it because its break just happened. Same chart, two different pictures of what's worth watching.
The choice comes down to how you read the market. Care about the newest structure forming? Use Formation Order. Care about where price most recently broke a level? Use Break Order.
## How to Use It
In the Historical Zones group, make sure Show Historical Broken Zones is on — the feature only matters when broken zones are displayed. Set Broken Zone Lookback to how many you want to keep, then pick your rule in the Broken Lookback Mode dropdown.
Note: at a Lookback of zero, every broken zone vanishes the instant it breaks, the same way in both modes. The dropdown only comes into play once you're keeping at least one around, and the higher that number, the more the two modes differ.
## Default
Ships as Formation Order — the way the indicator has always behaved — so updating doesn't silently change your existing charts. Try Break Order if you're curious; switch back anytime, since nothing else in the indicator depends on the choice.
## Small Extra
If you use the info panel at Medium or Large detail, the Broken Lookback row now shows which mode is active, so you can check it without opening the menu.
הערות שחרור
**Supply & Demand Zones XL — Triangle Anchor Update****What was wrong**
- On a chart where the Structure Timeframe was higher than the chart timeframe (for example, a 30-minute structure on a 15-minute chart), the pivot triangles didn't sit on the zone edge. The tip would float into the candles or drift off the line.
- The cause: a higher structure bar is made of several chart candles. In Fixed Pixel mode the triangle was attaching to the *first* candle of that structure bar, but the actual high or low usually prints on a *different* candle inside it. So the triangle and the zone edge ended up anchored to two different candles.
- It looked perfect when structure and chart timeframes matched, and only broke when they were different, which is exactly why it was easy to miss.
**What the update does**
- The indicator now tracks, for every completed structure bar, the exact chart candle that actually set that bar's high and its low.
- When a zone forms, the triangle is pinned to that true extreme candle instead of the first one. The demand tip now touches the bottom edge of the zone and the supply tip touches the top edge, on every timeframe combination and at any zoom level.
**What did not change**
- **ATR anchor mode** is untouched. Only Fixed Pixel mode was affected.
- **Equal timeframe** setups (structure = chart) behave exactly as before, so existing charts won't shift.
- **Non-Repaint mode** and all other zone logic, scoring, breaks, and alerts are unchanged.
**One thing you'll notice**
- The triangle now sits at the real swing candle inside the structure bar, which can be slightly right of the zone's left corner rather than pinned to it. That's the correct location of the actual high or low, and the tip lands cleanly on the edge.
**Bottom line**
- Triangles now mark the true swing point and touch the zone edge correctly across mismatched timeframes. If you only ever run structure equal to chart timeframe, nothing changes for you.
Want a shorter one-paragraph version too, for a spot with a tighter character limit?
הערות שחרור
**What the update adds**This update puts a small arrow next to each zone's strength score (the `7/10` label). The arrow packs two pieces of information into one symbol, so you can read a zone at a glance without stopping to think about the number.
**The two things the arrow tells you**
- **Which way it points = what kind of zone it is.** A demand zone (support, where price tends to bounce up) gets an arrow pointing **up**. A supply zone (resistance, where price tends to turn down) gets an arrow pointing **down**. This never changes — supply is always down, demand is always up.
- **Filled or hollow = how strong the zone is.** A **filled (solid) arrow** means the zone is strong. A **hollow (outline) arrow** means the zone is weak. "Strong" vs "weak" uses the exact same cutoff that already decides the zone's color, so the arrow and the color always agree with each other.
**The four possible arrows**
- **▲ solid up** — strong demand zone
- **△ hollow up** — weak demand zone
- **▼ solid down** — strong supply zone
- **▽ hollow down** — weak supply zone
So a label reading `8/10 ▲` is a strong demand zone; `3/10 ▽` is a weak supply zone.
**It updates live**
The arrow reads the zone's current strength, not a frozen snapshot from when it formed. Zones can weaken over time as they age, get touched, or decay. When a zone's score crosses the strength cutoff, the arrow flips from filled to hollow right along with the color — the two always tell the same story.
**Broken zones show no arrow**
Once price breaks through a zone, it's spent — its strength no longer means anything actionable. So the arrow disappears entirely on broken zones. The `/10` score text stays, but the arrow drops off, giving you a clean visual cue that the zone is done.
**The new user input toggle**
There's one new setting: **Show Strength Arrows**, a simple on/off checkbox. You'll find it in the **Display** group, right under **Show Strength Labels** (since the arrow rides on the strength label — if labels are off, there's no arrow either). It's **on by default**. Turn it off and you get just the plain `7/10` score with no arrow. That's the only control; there are no sub-options to configure.
**What this replaces**
Earlier versions of this arrow were based on trend direction (whether a zone agreed with the flow line). That approach was dropped in favor of strength because it keeps everything pointing at one source of truth — the strength engine that already drives the whole indicator — instead of adding a separate trend axis. All the old trend-alignment machinery and its info box row were fully removed, so nothing extra is running behind the scenes.
**One honest note**
Because the arrow's fill (strong/weak) says the same thing the zone's color already says, the arrow is partly a reinforcement rather than brand-new information. Its real value is the *direction* half — telling supply from demand at a glance on the label itself — plus giving the label its own strong/weak cue so you don't have to rely on color alone. If you ever find it redundant with the color, the toggle lets you switch it off.
הערות שחרור
**What this update changed**This update improves one line in the on-chart info box — the **Flow Line** row — so it shows a complete summary of your flow line settings at a glance instead of just partial information.
**What the row showed before**
The Flow Line row used to display only the length and the timeframe, like `34 / Structure`. It told you how long the moving average was and whether it ran on the structure or chart timeframe, but it left out which *mode* the flow line was using.
**What the row shows now**
The row now packs three pieces of information into one compact readout, separated by slashes:
- **The length** — the EMA length of the flow line (for example, `34`).
- **The timeframe** — whether the flow line runs on the structure timeframe or the chart timeframe, abbreviated to **St** (Structure) or **Ch** (Chart).
- **The mode** — whether the flow line uses Advanced or Simple trend logic, abbreviated to **Adv** (Advanced) or **Sim** (Simple).
So a flow line set to length 34, structure timeframe, and Advanced mode now reads:
`34 / St / Adv`
And one set to length 21, chart timeframe, Simple mode would read:
`21 / Ch / Sim`
When the flow line is turned off entirely, the row simply shows `OFF`, just as it did before.
**Why the abbreviations**
The info box cells are narrow, so spelling out full words like "Structure," "Advanced," and "Simple" would make the row too long and cramped. Shortening them to two- and three-letter forms (St, Ch, Adv, Sim) keeps the row tight and readable while still being easy to understand.
**How big a change this is**
This was a small, contained edit — a single line that builds the text for that one info box row. Nothing else in the indicator was touched: no new inputs, no new rows, no change to the flow line's actual behavior or calculations. The info box is exactly the same size as before; that one row just carries more useful detail now.
הערות שחרור
# Supply & Demand Zones XL — Update Description## Overview
This update adds a single new user input, the **Overlap Buffer (ATR Multiplier)**, and surfaces its status in the info box across all detail levels. The change extends the existing zone-overlap filtering so that new zones can be rejected not only when they literally overlap an existing zone, but also when they form within a configurable, volatility-scaled distance of one.
## New User Input
**Overlap Buffer (ATR Multiplier)**
- **Group:** General
- **Location:** Directly beneath the Disallow Different-Zone Overlap toggle
- **Type:** Float
- **Default:** 0.0
- **Range:** 0.0 to 10, in steps of 0.1
The default value of 0.0 reproduces the prior behavior exactly. At 0.0, a new zone is blocked only when its box literally overlaps an existing zone's box (contact counts as overlap). This makes the default a true no-op — enabling the input without changing its value produces no difference from the previous version.
Above 0.0, the input adds a buffer around each existing zone's footprint. A new zone is then blocked when it forms within that buffer distance of an existing zone, even if the two boxes never touch. Raising the value increases the spacing required between zones and reduces clustering.
## How the Buffer Is Measured
The buffer is scaled by the pivot-bar ATR — the same Average True Range value that sizes the zones through the existing Zone Size (ATR Multiplier) input. Because both the zones and the buffer are measured in the same ATR-based unit, the input value carries a consistent meaning across all instruments and timeframes. A value of 0.5 represents half a zone-height of additional spacing regardless of the symbol's price scale or volatility. This removes the need to retune the setting when switching charts.
The buffer is computed from the pivot bar currently forming, so the spacing requirement automatically expands during periods of higher volatility and relaxes as volatility subsides.
## Scope of the Filtering Change
The buffer applies to both existing overlap checks:
- **Disallow Same-Zone Overlap** (supply against supply, demand against demand)
- **Disallow Different-Zone Overlap** (supply against demand, and the reverse)
It also threads through both evaluation paths:
- The **single-zone check**, which compares a new candidate against the current active zone of the relevant type
- The **historical overlap engine**, which compares a new candidate against the full stored history of zones (active when the Use Historical Overlap Engine option is enabled)
The buffer only ever tightens the filter. Because it widens the rejection range rather than the acceptance range, increasing the value can only cause more new zones to be blocked, never fewer. It cannot permit a zone that would have been blocked at a lower setting.
## Info Box Changes
A new **Ovlp Buffer** row was added to the info box and is displayed in all three detail levels (Small, Medium, and Large). The row reports:
- The active ATR multiplier (for example, `0.5 ATR`) when the buffer is in effect
- `OFF` when the buffer is set to 0.0, or when both overlap toggles are disabled
The row is positioned in the always-visible base section, directly below the Flow Line row. It previously existed only in the Large detail level; that duplicate has been removed so the value appears exactly once.
Info box row counts were rebalanced to accommodate the new base row: Small increased from 7 to 8 rows, Medium from 13 to 14 rows, and Large remained at 20 rows (it gained a base row but shed its former duplicate). All subsequent rows in the Medium and Large sections were renumbered to keep the layout contiguous.
## Behavioral Compatibility
No behavior outside the overlap-filtering path is affected. With the new input left at its 0.0 default, the indicator produces identical output to the prior version, including the contact-counts-as-overlap edge case. The strength engine, break detection, touch counting, triangle anchoring, flow line, and alerts are unchanged.
הערות שחרור
**Overview**This update adds a filter controlling which historical zones display a strength score label. Previously, "Show Historical Strength Labels" was all-or-nothing: enabling it labeled every qualifying past zone. The update lets you narrow that output to a chosen subset, without changing how labels are drawn, positioned, or colored.
**The New Input**
A dropdown named "Historical Label Filter" sits in the Display group, directly beneath the "Show Historical Strength Labels" toggle. It defaults to "All" and offers three options:
- **All** — Labels every qualifying historical zone, reproducing the original behavior (both broken and unbroken).
- **Active Only** — Labels only unbroken historical zones; broken zones stay unlabeled.
- **Broken Only** — Labels only broken historical zones; unbroken zones stay unlabeled.
The input does nothing unless "Show Historical Strength Labels" is on, and it never touches the current active zone's label, which stays governed by "Show Strength Labels."
**How It Behaves**
- **Broken-zone visibility still wins.** A broken zone already hidden by Broken Zone Lookback or by disabling "Show Historical Broken Zones" stays hidden and unlabeled even under "Broken Only." The filter can't force a label onto a removed zone.
- **Switching live is clean.** Changing the option deletes labels that no longer qualify on the next redraw, leaving no stale labels.
**What Did Not Change**
The update is additive and backward-compatible. Left at "All," charts render exactly as before. Label style, size, offset, color, the strength calculation, and zone/break detection are untouched. The info box does not report the filter, so its layout is unchanged.
**Mechanism**
One new dropdown, one small helper that checks whether a zone passes the selected filter based on its broken state, and that check inserted into the two loops (supply and demand) that draw historical labels. No new data structures were needed, since each zone's broken state was already tracked.
הערות שחרור
**Supply & Demand Zones XL — Volume Profile Update****New Feature: Volume Profile Overlay**
- Added an optional Volume Profile drawn as horizontal volume bars beside the most recent candle. Off by default, so existing charts look unchanged until switched on.
- Built from one histogram over a chosen number of past bars, showing where traded volume concentrated by price. Marks the Point of Control (POC) — the highest-volume price row — and a Value Area (VAH/VAL) covering a set share of total volume.
- Each price row can show split up/down volume (buying vs selling as two colored segments) or a single bar colored by the dominant side.
- Can be built from the Structure Timeframe (matching the zones and flow line) or the Chart Timeframe (raw chart bars). The Structure option follows the same non-repaint rules as the zone engine, so it does not repaint when Non-Repainting Mode is on.
- The Chart Timeframe option stays valid even when the chart timeframe is higher than the Structure Timeframe, so the profile no longer disappears in that combination.
**Behavior Notes**
- The profile shares the same drawing budget as the zone engine. Worst case (100 rows split into up/down = 200 bars) plus maximum zones stays under the platform limit, so nothing gets crowded out.
- The profile redraws cleanly on the last bar and does not leave stale bars behind when settings change.
**New User Inputs (Volume Profile group)**
- **Show Volume Profile** — master on/off switch. Off by default. When off, none of the profile work runs.
- **Split Up/Down Volume** — on shows separate buy/sell segments per row (2 bars per row); off shows one bar per row colored by the dominant side. Default: on.
- **Timeframe** — Structure TF or Chart TF. Chooses the data source, mirroring the Flow Line control. Default: Structure TF.
- **Number of Rows** — how many horizontal price bins the range is split into (5–100). Higher is finer but uses more bars. Default: 100.
- **Value Area %** — share of total volume the Value Area covers, centered on the POC (1–100). Default: 70.
- **Lookback Bars** — how many bars back the profile is built from, counted in bars of the selected Timeframe (10–5000). Also sets the price high/low span. Default: 200.
- **Placement** — draw the profile on the Right or Left of the latest candle. Default: Left.
- **Max Profile Width (bars)** — horizontal length of the highest-volume (POC) row; every other row scales proportionally (10–450). Default: 50.
- **Gap From Price (bars)** — empty space between the latest candle and the near edge of the profile (0–40). Default: 10.
- **VP Up Volume** — fill color for volume on bars that closed at or above their open (buying side). Default: teal.
- **VP Down Volume** — fill color for volume on bars that closed below their open (selling side). Default: red.
- **Show POC** — draws the Point of Control line at the highest-volume row. Default: on.
- **POC Color** — line color for the Point of Control. Default: orange.
- **POC Line Style** — Solid, Dashed, or Dotted. Default: Solid.
- **POC Line Width** — thickness of the POC line (1–10). Default: 3.
- **Show Value Area** — draws the Value Area High (VAH) and Low (VAL) lines. Default: on.
- **VA Color** — line color for the Value Area edges. Default: blue.
- **VA Line Style** — Solid, Dashed, or Dotted. Default: Dashed.
- **VA Line Width** — thickness of the VA lines (1–10). Default: 2.
**Info Box Update**
- Added a Vol Profile row to the base info panel (shown at every panel size). Reads OFF when the overlay is off, otherwise shows the lookback count and source (Structure or Chart), e.g. 200 / Structure.
- Panel row counts increased by one at each detail level (Small 8→9, Medium 14→15, Large 20→21) to fit the new row.
**Other Changes**
- Indicator declaration now includes higher line and bar-history limits to support the POC/VAH/VAL lines and the larger Lookback range.
- Overlap Buffer default changed from 0.0 to 0.1 ATR, spacing new zones slightly further from existing ones.
הערות שחרור
Here's the same summary with personal language removed.**1. Info Box — moved three rows to the bottom**
- The **Flow Line**, **Vol Profile**, and **Value Area** rows now sit at the very bottom of the info panel, regardless of the selected panel size.
- This holds for all three sizes: they land at the last three rows in Small, Medium, and Large.
- **Ovlp Buffer** stayed in the base section — it was not part of the request, so it was not touched.
- The three rows are pinned to the bottom by computing their position from the total row count, so they always trail whatever block is above them with no empty gap.
- Nothing else about the info box logic or the values shown changed — only the row order.
**2. Broken triangles now change color when the zone breaks**
- Previously, when a zone broke and its box turned gray, the pivot triangle kept its original red or green. Now the triangle changes color too.
- This works for both the **active zone** (the current one) and **historical zones** (past ones still on the chart).
- It respects the existing toggles: active zones follow **Color Active Broken Zones**, and historical zones follow **Color Historical Broken Zones**. If a toggle is off, that triangle stays its normal color.
- Broken zones hidden past the **Broken Zone Lookback** still fade out completely, same as before.
**3. Reorganized the broken colors and added triangle color controls**
- In the **Colors** settings group, the broken-color inputs were moved down to sit directly below the two toggles (Color Active Broken Zones and Color Historical Broken Zones), so all the broken-related controls are grouped together.
- Two inputs were **renamed** for clarity:
- "Broken Supply Color" is now **Broken Supply Zone (Color)**
- "Broken Demand Color" is now **Broken Demand Zone (Color)**
- Two **new inputs** were added:
- **Broken Supply Triangle (Color)**
- **Broken Demand Triangle (Color)**
- The broken box and the broken triangle now have separate color controls — they can match or differ.
- Both new triangle-color inputs default to gray, so the chart looks identical until they are changed.
הערות שחרור
**Overview**Three functional updates were made to the original uploaded script during this conversation. All three concern chart overlays and the on-chart info box. Everything else in the indicator — the supply/demand zones, the strength engine, volume profile, break markers, and historical-zone handling — remains identical to the original upload.
**Update 1: Moving-average type selector for the Flow Line**
The original Flow Line was hard-coded to an EMA (exponential moving average). A dropdown now allows the average to be switched between EMA and SMA (simple moving average). This update has four connected parts:
- **New input control** — a dropdown labeled "Flow Line MA Type" was added beneath "Flow Line Speed," with options EMA and SMA. The default is EMA, so behavior matches the original until the setting is changed.
- **Structure-timeframe calculation** — both an EMA and an SMA are now computed on every bar, and the dropdown selects which one drives the line. Both must be calculated at all times because these functions build on their own prior values; computing only the selected one would corrupt its result when the setting is toggled.
- **Chart-timeframe calculation** — the same paired approach was mirrored in the fallback path that builds the Flow Line from the chart's own timeframe, so the MA-type choice applies regardless of timeframe source.
- **Info box display** — the Flow Line row gained a field showing the chosen type, reading in the order length, MA type, timeframe source, mode — for example `200 / SMA / St / Adv` or `55 / EMA / Ch / Sim`.
A behavioral note applies here: the slope thresholds and trend-strength floors that drive Flow Line coloring were calibrated to the EMA's faster response. An SMA of the same length produces a slightly smaller bar-to-bar slope, so in Advanced Line mode an SMA colors marginally more conservatively. Simple Line mode is unaffected.
**Update 2: Combined "POC / Value" row in the info box**
The info box row that previously reported only Value Area information was reworked to report both the Point of Control (POC) and the Value Area together.
- **Label change** — the left-column label changed from "Value Area" to "POC / Value."
- **Value format change** — the value now shows two segments separated by a slash. The first reports whether the POC line is on or off. The second reports the Value Area: it shows the configured percentage when the Value Area lines are displayed, or the word "Off" when they are hidden. The percentage itself serves as the on indicator, so the earlier "Shown / Hidden" wording was removed.
- **Resulting readouts** — the row reads `On / 80%`, `Off / 70%`, `On / Off`, or `Off / Off` depending on the two toggles, and collapses to `OFF` when the volume profile is turned off entirely.
**Update 3: Moving VWAP overlay**
A Moving VWAP was added — a rolling volume-weighted average price over a sliding window of the most recent N bars, calculated as the sum of price times volume divided by the sum of volume across that window. Unlike a session or anchored VWAP, it never resets; it slides forward one bar at a time like a volume-weighted moving average. It is off by default, so it changes nothing on load until enabled.
- **New settings group** — a "Moving VWAP" group was placed after the Flow Line group and before the Volume Profile group, containing:
- **Show Moving VWAP** — the master on/off toggle.
- **Length** — the rolling window in bars (default 20).
- **Source** — the price each bar contributes, weighted by its volume: Close, HL2, HLC3, or OHLC4 (default HLC3, the standard VWAP typical price).
- **Timeframe** — Structure TF or Chart TF, matching the Flow Line and Volume Profile controls.
- **Line Width** and **Line Color** — plot styling.
- **Calculation handling** — on the Structure timeframe, the entire rolling VWAP is computed inside the structure-timeframe request so the sliding sums are evaluated on structure bars directly, and it follows the same non-repainting path as the zones. On the Chart timeframe, the sums run on the chart's own bars, and that path stays valid even when the chart timeframe is higher than the structure timeframe.
- **Info box display** — a "Mov VWAP" row was added to the bottom-pinned group, reading length / source / timeframe — for example `20 / HLC3 / St` or `20 / Close / Ch`, and `OFF` when hidden. The info box grew by one row in each detail size, with the medium and large blocks verified not to collide with the pinned rows.
**Net effect**
The Flow Line became switchable between EMA and SMA end to end, one info box row was made more informative by folding POC status into it while simplifying the Value Area wording, and a new Moving VWAP overlay was added with the same timeframe and non-repaint handling as the existing overlays. No other logic, calculation, or drawing in the script was altered.
הערות שחרור
Added Standard Deviation Bands to the Moving VWAP XL feature.Added 1, 2, & 3 Standard Deviation user inputs which are also visible in the Info Box when enabled. Default color for the bands are green.
הערות שחרור
**Moving VWAP ATR Channel — What's New**This update adds an ATR-based channel around the Moving VWAP line. It works just like the ATR channel that already exists on the Flow Line: two lines drawn a fixed distance above and below the VWAP, where the distance is set by volatility (ATR) rather than by the volume-weighted standard deviation the σ bands use.
**How it works in plain terms**
The channel takes the Moving VWAP line and offsets a band above and below it. The width of that offset is the current ATR multiplied by a chosen number. When the market gets more volatile, ATR rises and the channel widens; when things calm down, it narrows. It automatically uses the same timeframe as the VWAP (Structure TF or Chart TF), so the two always stay in sync. The channel only appears when the Moving VWAP itself is turned on and the multiplier is above zero.
**New user inputs (in the Moving VWAP group)**
- **Show ATR Channel** — turns the channel on or off. Off by default.
- **ATR Channel** — the ATR multiplier that sets how far the bands sit from the VWAP. Default 1.0, adjustable from 0 to 5 in steps of 0.5. Setting it to 0 disables the channel.
- **ATR Line Style** — draws the bands as Solid, Dashed, or Dotted.
- **ATR Line Width** — thickness of the band lines, 1 to 5.
- **ATR Line Color** — color of the band lines. Defaults to orange.
**Worth knowing**
The channel shares the script's single ATR Length setting (in the General group, default 14) — the same one the Flow Line channel and zone sizing use, so there's no separate length field here. This is purely an additive visual overlay: nothing about the zones, alerts, info box, or existing VWAP bands changes.
הערות שחרור
# Zone Extension Update**What's New**
The Zone Extension setting now offers a one-bar extension option alongside the existing chart-edge extension. Zones can be stretched a short distance past the most recent candle instead of only being drawn all the way to the right edge of the chart.
**The Updated Dropdown**
The Zone Extension menu now contains these choices:
- **Off** — Every zone stops at the most recent bar.
- **All Zones (Chart)** — Every visible zone extends to the right edge of the chart.
- **All Zones (1 Bar)** — Every visible zone extends one bar past the most recent candle, with strength labels shown at the new edge.
- **All Zones (No Labels)** — Every visible zone extends to the chart edge with all strength labels hidden.
- **Active Zones (Chart)** — Only the current active zones extend to the chart edge; older zones stop at the most recent bar.
- **Active Zones (1 Bar)** — Only the current active zones extend one bar past the most recent candle; older zones stop at the most recent bar.
- **Active Zones (No Labels)** — Only the current active zones extend to the chart edge with strength labels hidden.
**How the Options Are Grouped**
Each family is kept together so related choices sit side by side: the All Zones options first, then the Active Zones options. Within each family the order is Chart, then 1 Bar, then No Labels.
**What Stayed the Same**
- The two chart-edge behaviors are unchanged — they were simply renamed to include "(Chart)" so their purpose is clear next to the new choices.
- Both No Labels options work exactly as before.
- The one-bar extension distance matches the existing End of Zone Offset measurement, so spacing stays consistent across timeframes.
הערות שחרור
**Info box: new "Zone Ext" row**A new row called "Zone Ext" was added to the info box, appearing directly under the "Zone ATR" row. It reports the current Zone Extension setting. It shows "Off" when zone extension is turned off, or a two-part readout such as "All / Chart," "Active / 1 Bar," or "All / No Lbl" when it is on. This row appears in the Medium and Large info box sizes only; the Small size is unchanged.
**Info box: "Zone" row renamed**
The row previously labeled "Zone" is now labeled "Zone ATR."
**Info box: simpler Zone ATR value**
The Zone ATR row now displays just the number (for example, "0.5"). The repeated "ATR" text after the number was removed, since the row label already says ATR.
**Info box: simpler Historical value**
The Historical row now displays only the lookback number when historical zones are turned on (for example, "10"), or "Off" when they are turned off. The word "Shown" that used to appear before the number was removed.
**Volume Profile: new default gap**
The default value for "Gap From Price (bars)" was changed from 10 to 15. This sets a wider default spacing between the most recent candle and the volume profile. Anyone who has already chosen their own value keeps it; only the starting default changed.
All other settings, behavior, and calculations remain the same.
הערות שחרור
**Update — Strength Engine improvements**This release sharpens how each zone's 1–10 strength score is calculated. No settings changed — your inputs, defaults, and saved layouts all carry over. Two things are smarter under the hood:
**1. Zones that price has closed through now score much weaker.**
Previously, a zone could still show a mid-range score even after price had clearly closed inside and through it — which could make a spent level look stronger than it really was. Now, every candle that *closes inside* a zone pulls its score down sharply (roughly cut in half per close-through). A level price has decisively broken will drop toward the bottom of the scale, where it belongs. Note: a simple **wick** into a zone is not treated as a break — only a candle *closing* inside counts. Wick-tested zones are basically unaffected.
**2. "Old" no longer automatically means "strong."**
Before, a zone earned strength just for being old — even if price had never come back to test it. But an untouched old zone is often just forgotten, not respected. Now, a zone only earns that age-based strength once it has actually been challenged and held (i.e. price wicked into it and got rejected). A zone that's been retested and survived keeps full credit; one that's simply been sitting there untested earns much less.
**What you'll notice:**
- Broken/violated zones read noticeably weaker.
- Old, never-retested zones read a bit weaker.
- Fresh, high-quality zones and zones that have held their tests are largely unchanged.
- Overall scores may sit slightly lower until zones prove themselves through testing.
**Tuning:** if you'd like scores to run a little more generous, raise **Endurance Weight** or lower **Body Touch Penalty Weight** in the Strength Engine settings — both carry more influence now.
הערות שחרור
**Supply & Demand Zones XL: Update – Zone Mode and Zone Size Mode****What's New**
Two new dropdowns in the General group give you more control over how zones are built. They work independently, so you can combine them in any of four ways.
**Zone Mode: What Creates a Zone**
- **Pivot (default):** zones form at confirmed swing highs and lows, using Bars Left and Bars Right. This is how the indicator has always worked.
- **Candle:** zones form on large breakout candles instead of pivots.
- **Demand zone:** a bullish candle closes above the previous candle's body high, and its body is at least a set multiple of the average body.
- **Supply zone:** a bearish candle closes below the previous candle's body low, with the same size test.
- Bars Left and Bars Right are ignored in Candle mode.
**Zone Size Mode: How Tall a Zone Is**
This sits right below ATR Length.
- **ATR (default):** each zone is as tall as ATR × the Zone Size (ATR Multiplier) setting, as before.
- **Candle:** each zone is as tall as the trigger candle itself, from its low to its high.
- **Demand zone:** spans from the candle's low up to its high.
- **Supply zone:** spans from the candle's high down to its low.
- **Trigger candle:** the pivot candle in Pivot mode, or the breakout candle in Candle mode.
- **Thin candles:** a very thin candle still gets a zone at least one tick tall.
- **ATR multiplier:** it is ignored in this mode.
**New Inputs**
- **Zone Mode** (Pivot or Candle). The default is Pivot.
- **Average Body Length** (default 50): the number of bars used to calculate the average candle body. Candle mode only.
- **Min Body vs Average (x)** (default 3.0): the minimum body size as a multiple of the average. Higher values give fewer, stronger zones. Set to 0 to remove the size filter. Candle mode only.
- **Zone Size Mode** (ATR or Candle). The default is ATR.
**Ways To Combine Them**
- **Pivot + ATR:** the original behavior, with no change.
- **Pivot + Candle size:** zones at swing points, covering the full pivot candle.
- **Candle + ATR:** zones at breakout candles, with a set ATR height.
- **Candle + Candle size:** zones that cover the full breakout candle.
**What Stays the Same**
Both settings share everything else:
- Overlap rules and historical zones
- Volume and RSI filters
- Strength scoring
- Break markers
- Zone extension
- Structure timeframe
- Info box, which now shows the active mode, its settings and the zone size
**Things To Know**
- **Timing:** Candle zones appear when the breakout candle closes. Pivot zones appear Bars Right bars after the swing.
- **Strength scores:** scores are not directly comparable between Zone Modes, because the departure measurement differs.
- **Overlap rules:** large candles often cluster, and the overlap rules may skip zones that overlap an existing one.
- **Candle-sized zones vary a lot.** Tall candles make tall zones and small candles make small ones, so zone heights will be uneven on the chart.
Feedback and suggestions are welcome.
הערות שחרור
**Supply & Demand Zones XL: Update****Input Order Tweak**
- **Bars Left** and **Bars Right** now sit directly under **Zone Mode** in the General group.
- Both are still used by Pivot mode, so the pivot settings now sit next to the mode that uses them.
- Defaults, ranges and tooltips are unchanged (Bars Left 50, Bars Right 5).
- Zones, signals and the info box behave exactly as before, so no changes to your results.
הערות שחרור
**Supply & Demand XL Update: Chart Type and Session in the Info Box**This update adds two rows to the top of the info box.
**What's New**
- **Chart Type:** Shows whether you're on Standard candles, Heikin Ashi, Renko, Kagi, Line Break, Point & Figure or Range. Anything other than Standard shows in red, so you can tell at a glance when the chart isn't plain candles.
- **Session:** Shows whether the chart is using the Regular or Extended session.
**Where They Sit**
- Both rows sit right under the title, above Mode.
- They show in all three Info Box Detail sizes (Small, Medium and Large).
**What Didn't Change**
- Zones, signals and every setting work exactly as before. This is an info box change only.

כתב ויתור
המידע והפרסומים אינם מיועדים להיות, ואינם מהווים, ייעוץ או המלצה פיננסית, השקעתית, מסחרית או מכל סוג אחר המסופקת או מאושרת על ידי TradingView. קרא עוד ב־תנאי השימוש.
כתב ויתור
המידע והפרסומים אינם מיועדים להיות, ואינם מהווים, ייעוץ או המלצה פיננסית, השקעתית, מסחרית או מכל סוג אחר המסופקת או מאושרת על ידי TradingView. קרא עוד ב־תנאי השימוש.