OPEN-SOURCE SCRIPT
CVD Momentum Indicator
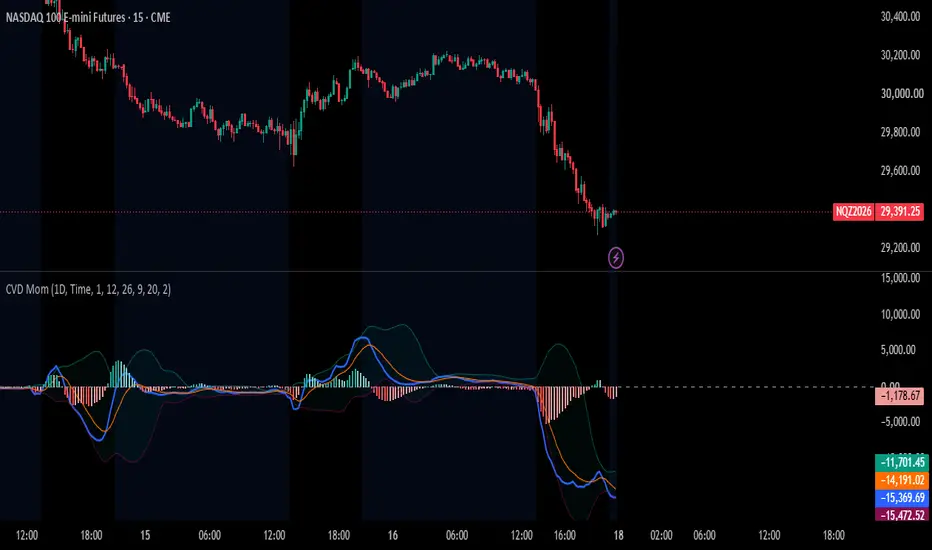
CVD MOMENTUM INDICATOR
Applies MACD-style momentum analysis to Cumulative Volume Delta (CVD).
Instead of measuring momentum on price, this indicator measures momentum in
buying and selling pressure. It shows whether aggressive buyers or sellers
are gaining or losing strength, and how quickly.
━━━━━━━━━━━━━━━━━━━━━━━━━━
WHAT IS CVD?
━━━━━━━━━━━━━━━━━━━━━━━━━━
Volume Delta is the difference between buy volume and sell volume. CVD
accumulates that difference over an anchor period (1 day by default).
- Rising CVD: buyers are more aggressive.
- Falling CVD: sellers are more aggressive.
This script uses TradingView's built-in ta.requestVolumeDelta() function,
the same data source as the official CVD indicator. It reads lower-timeframe
(or tick) data to estimate up and down volume.
━━━━━━━━━━━━━━━━━━━━━━━━━━
HOW IT WORKS
━━━━━━━━━━━━━━━━━━━━━━━━━━
1. The closing CVD value of each bar is taken as the base data stream.
2. A fast EMA and a slow EMA are calculated on CVD (12 and 26 by default).
3. CVD Momentum = Fast EMA - Slow EMA
4. Signal Line = EMA of CVD Momentum (9 by default)
5. Histogram = CVD Momentum - Signal Line
6. Volatility Bands = Bollinger-style bands (SMA +/- StDev) on the CVD
Momentum line, to show when momentum is statistically stretched.
━━━━━━━━━━━━━━━━━━━━━━━━━━
WHAT YOU SEE ON THE CHART
━━━━━━━━━━━━━━━━━━━━━━━━━━
- Blue line: CVD Momentum
- Orange line: Signal line
- Histogram: the gap between the two
Dark teal = positive and growing (bullish momentum strengthening)
Light teal = positive but fading (bullish momentum weakening)
Dark red = negative and growing (bearish momentum strengthening)
Light red = negative but fading (bearish momentum weakening)
- Teal / maroon bands: volatility envelope around the momentum line
- Dashed gray line: zero line
━━━━━━━━━━━━━━━━━━━━━━━━━━
HOW TO READ IT
━━━━━━━━━━━━━━━━━━━━━━━━━━
- Momentum above zero: net buying pressure is accelerating.
Below zero: net selling pressure is accelerating.
- Momentum crossing above the signal line: buying pressure is picking up.
Crossing below: selling pressure is picking up.
- Histogram color change from dark to light: momentum is losing steam,
often before price reacts.
- Momentum touching or exceeding a band: an unusually strong order flow
move, which may precede continuation or exhaustion depending on context.
- Divergence: price makes a new high or low while CVD momentum does not.
This suggests the move is not backed by aggressive order flow.
━━━━━━━━━━━━━━━━━━━━━━━━━━
SETTINGS
━━━━━━━━━━━━━━━━━━━━━━━━━━
CVD Settings
- Anchor period: when cumulative delta resets (default 1D).
- Data aggregation: "Time" (lower timeframe) or "1 tick" (expert plans only).
- Use custom timeframe / Timeframe: override the automatic lower timeframe.
Higher values give more history but less precision.
Momentum Settings
- CVD Fast EMA (12)
- CVD Slow EMA (26)
- Signal Smoothing (9)
- Volatility Band Length (20)
- Volatility Band Multiplier (2.0)
━━━━━━━━━━━━━━━━━━━━━━━━━━
IMPORTANT NOTES
━━━━━━━━━━━━━━━━━━━━━━━━━━
- Requires a symbol with volume data. Without it, the script throws an error.
- CVD resets at the start of each anchor period, so momentum values can
jump at those resets. Use a longer anchor period for smoother results.
- Volume delta is an approximation built from lower-timeframe data.
Results vary with data feed quality and the timeframe used.
- Tick mode needs enough tick history to cover the anchor period. If you
see a tick depth error, shorten the anchor period or switch to "Time".
- Best used on liquid instruments (futures, crypto, major stocks).
━━━━━━━━━━━━━━━━━━━━━━━━━━
DISCLAIMER
━━━━━━━━━━━━━━━━━━━━━━━━━━
This indicator is for educational and informational purposes only. It is
not financial advice and does not guarantee results. Always combine it with
your own analysis and risk management.
סקריפט קוד פתוח
ברוח האמיתית של TradingView, יוצר הסקריפט הזה הפך אותו לקוד פתוח, כך שסוחרים יוכלו לעיין בו ולאמת את פעולתו. כל הכבוד למחבר! אמנם ניתן להשתמש בו בחינם, אך זכור כי פרסום חוזר של הקוד כפוף ל־כללי הבית שלנו.

כתב ויתור
המידע והפרסומים אינם מיועדים להיות, ואינם מהווים, ייעוץ או המלצה פיננסית, השקעתית, מסחרית או מכל סוג אחר המסופקת או מאושרת על ידי TradingView. קרא עוד ב־תנאי השימוש.
סקריפט קוד פתוח
ברוח האמיתית של TradingView, יוצר הסקריפט הזה הפך אותו לקוד פתוח, כך שסוחרים יוכלו לעיין בו ולאמת את פעולתו. כל הכבוד למחבר! אמנם ניתן להשתמש בו בחינם, אך זכור כי פרסום חוזר של הקוד כפוף ל־כללי הבית שלנו.
כתב ויתור
המידע והפרסומים אינם מיועדים להיות, ואינם מהווים, ייעוץ או המלצה פיננסית, השקעתית, מסחרית או מכל סוג אחר המסופקת או מאושרת על ידי TradingView. קרא עוד ב־תנאי השימוש.