OPEN-SOURCE SCRIPT
W & M Pattern | 3 Peaks + Liquidity Sweep | RR Tool
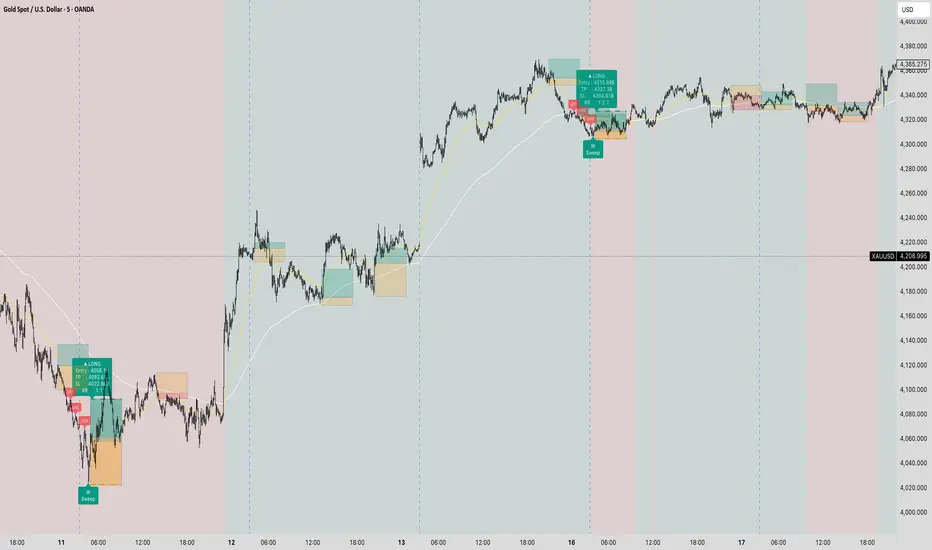
W & M Pattern | 3 Peaks + Liquidity Sweep | RR Tool
This indicator identifies high-probability reversal setups by combining classical market structure analysis with liquidity sweep detection — two concepts widely used in Smart Money and Price Action trading.
How It Works
The indicator continuously scans the chart for two mirror-image setups:
Bullish W Pattern (Long Setup)
In a falling market, price forms three consecutive Lower Highs (LH1 → LH2 → LH3), confirming a bearish structure. The indicator then watches for a W formation — where price first drops to a swing low, sweeps below it to grab liquidity (the sharp wick down), and then reverses sharply upward forming the right leg of the W. This liquidity sweep is the key trigger, as it signals that smart money has absorbed sell-side orders and a reversal is likely. A long entry is signaled as price recovers, with the stop loss placed just below the W's sweep low and the take profit targeting either the 1st or 3rd Lower High.
Bearish M Pattern (Short Setup)
In a rising market, price forms three consecutive Higher Highs (HH1 → HH2 → HH3), confirming a bullish structure. The indicator then watches for an M formation — where price pushes above the prior swing high to sweep buy-side liquidity (the sharp wick up), then fails and drops below the neckline. This sweep signals that smart money has distributed into retail buying pressure and a reversal downward is likely. A short entry is signaled as price breaks down, with the stop loss just above the M's sweep high and take profit targeting the 1st or 3rd Higher High.
This indicator identifies high-probability reversal setups by combining classical market structure analysis with liquidity sweep detection — two concepts widely used in Smart Money and Price Action trading.
How It Works
The indicator continuously scans the chart for two mirror-image setups:
Bullish W Pattern (Long Setup)
In a falling market, price forms three consecutive Lower Highs (LH1 → LH2 → LH3), confirming a bearish structure. The indicator then watches for a W formation — where price first drops to a swing low, sweeps below it to grab liquidity (the sharp wick down), and then reverses sharply upward forming the right leg of the W. This liquidity sweep is the key trigger, as it signals that smart money has absorbed sell-side orders and a reversal is likely. A long entry is signaled as price recovers, with the stop loss placed just below the W's sweep low and the take profit targeting either the 1st or 3rd Lower High.
Bearish M Pattern (Short Setup)
In a rising market, price forms three consecutive Higher Highs (HH1 → HH2 → HH3), confirming a bullish structure. The indicator then watches for an M formation — where price pushes above the prior swing high to sweep buy-side liquidity (the sharp wick up), then fails and drops below the neckline. This sweep signals that smart money has distributed into retail buying pressure and a reversal downward is likely. A short entry is signaled as price breaks down, with the stop loss just above the M's sweep high and take profit targeting the 1st or 3rd Higher High.
סקריפט קוד פתוח
ברוח האמיתית של TradingView, יוצר הסקריפט הזה הפך אותו לקוד פתוח, כך שסוחרים יוכלו לעיין בו ולאמת את פעולתו. כל הכבוד למחבר! אמנם ניתן להשתמש בו בחינם, אך זכור כי פרסום חוזר של הקוד כפוף ל־כללי הבית שלנו.

כתב ויתור
המידע והפרסומים אינם מיועדים להיות, ואינם מהווים, ייעוץ או המלצה פיננסית, השקעתית, מסחרית או מכל סוג אחר המסופקת או מאושרת על ידי TradingView. קרא עוד ב־תנאי השימוש.
סקריפט קוד פתוח
ברוח האמיתית של TradingView, יוצר הסקריפט הזה הפך אותו לקוד פתוח, כך שסוחרים יוכלו לעיין בו ולאמת את פעולתו. כל הכבוד למחבר! אמנם ניתן להשתמש בו בחינם, אך זכור כי פרסום חוזר של הקוד כפוף ל־כללי הבית שלנו.
כתב ויתור
המידע והפרסומים אינם מיועדים להיות, ואינם מהווים, ייעוץ או המלצה פיננסית, השקעתית, מסחרית או מכל סוג אחר המסופקת או מאושרת על ידי TradingView. קרא עוד ב־תנאי השימוש.