מעודכן
Hurst Exponent Regime [RC Tools]
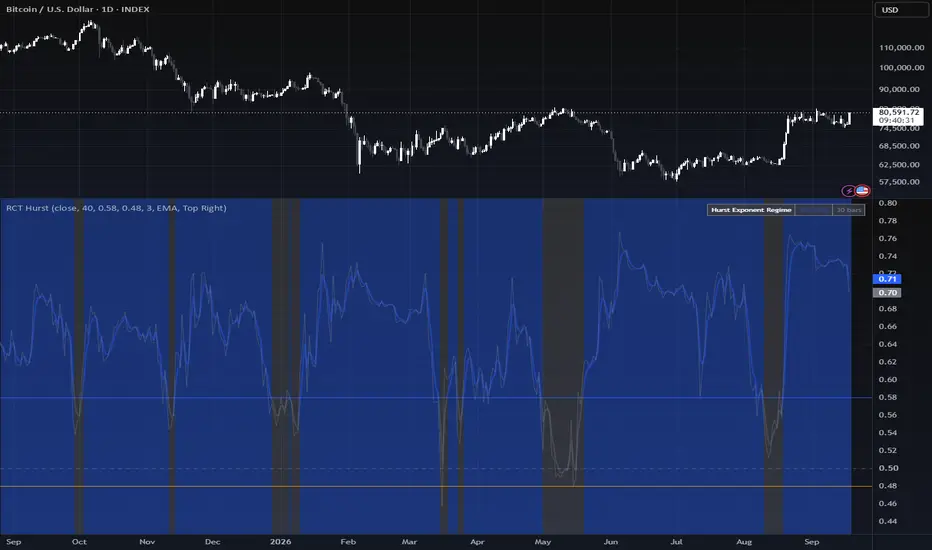
RC Tools — Hurst Exponent Regime
────────────────────────────────────────────────────────────────────
█ OVERVIEW
Most regime tools ask "is price trending right now." This one asks a more fundamental question: does this market's statistical character currently reward trend-following or mean-reversion? It applies the Hurst Exponent — a statistic originally developed to study Nile river flood records — via rescaled-range analysis, to classify the market into one of three long-memory regimes.
█ WHAT IT DOES
Estimates the Hurst Exponent (H) over a rolling window and classifies each confirmed bar as Trending (persistent), Mean-Reverting (anti-persistent), or Random Walk (no memory). Colours the chart background accordingly, plots both the smoothed and raw H line in a dedicated pane against static threshold lines and the 0.5 "true random walk" reference, and shows a table with the current state, how long price has been in it, and historical base rates (average forward return and win rate) for each state.
█ THE THEORY BEHIND IT
H.E. Hurst developed this statistic in the 1950s while studying how to size reservoirs for the Nile, where flood years tended to cluster rather than arrive randomly — a property he needed to measure and design around. The same statistic applies to any time series: it measures whether large values tend to be followed by more large values of the same sign (persistence, H > 0.5), whether they tend to reverse (anti-persistence, H < 0.5), or whether the series has no memory at all (H = 0.5, a true random walk).
Applied to price, this is a genuinely different question from "is this asset trending." A trend-following indicator can flag a trend within a market whose underlying character is actually mean-reverting — in which case that trend is more likely to be a temporary deviation that reverses. Knowing which regime you're in tells you which family of tools (trend-following vs. mean-reversion) is statistically better suited to current conditions, independent of what any single trend or oscillator reading says right now.
█ HOW IT IS CALCULATED
1. Take log returns over the window.
2. Build the cumulative deviation-from-mean series within the window, in chronological order, and take its range (maximum minus minimum) — this is R.
3. Compute S, the window's standard deviation of returns.
4. Apply Hurst's classic empirical relation: R/S is approximately equal to (window length / 2) raised to the power H. Rearranging gives H = ln(R/S) / ln(window length / 2).
5. Optionally smooth H (the raw rescaled-range estimate is noisy bar-to-bar by construction).
6. Classify: H above the Trending threshold (default 0.55) → Trending. H below the Mean-Reverting threshold (default 0.45) → Mean-Reverting. Otherwise → Random Walk.
Classification occurs ONLY on confirmed bar close — the plotted H, the background colour and the table all update together, so nothing here can disagree mid-bar or flip back and forth as the current bar forms.
Note: this is a single-scale rescaled-range estimate using Hurst's classic empirical formula, not a full multi-scale regression across many window sizes. It is a practical, computationally efficient approximation, not a research-grade estimator — treat it as a useful compass, not a precise measurement.
█ SETTINGS & CONFIGURATION
• Source (default close)
• Window Length (default 100) — longer windows give a more stable estimate but react slower to a genuine regime change
• Trending / Mean-Reverting Thresholds (default 0.55 / 0.45) — the H values beyond which a regime is declared; the gap between them is the "Random Walk" zone
• Smoothing Length and Type (default 5-period EMA) — reduces the raw estimate's bar-to-bar noise
• Forward Return Window (default 20 bars) — the horizon used for the base-rate table
• Table visibility, position and colours are fully configurable; the main-chart background painting can be toggled off if you only want the statistics pane
█ HOW TO USE IT
Use it to decide which family of tools to trust right now, not as a standalone entry signal. Example: if you run a mean-reversion system, check whether it has historically performed better when this tool reads Mean-Reverting than when it reads Trending; a trend-following system should show the opposite pattern. Check the base-rate table's sample count before treating any single state as meaningfully predictive.
Works on any asset and timeframe with sufficient history for the Window Length. Best used on daily and above, where regime persistence is greatest and the R/S window has enough independent observations to be meaningful.
█ LIMITATIONS
• This is a SINGLE-SCALE rescaled-range estimate, not a full multi-scale regression across many window sizes — a practical approximation, not a research-grade estimator.
• H describes the market's statistical character over the window — it does NOT identify direction. A "Trending" reading means persistence is likely, not which way.
• The R/S statistic assumes no major structural breaks within the window; a sudden regime shift partway through the window can distort the estimate until it fully rolls off.
• Shorter windows react faster but produce noisier, less reliable H estimates; longer windows are more stable but slower to reflect a genuine regime change.
• Historical base-rate stats need a meaningful sample count (check N) before being trusted, especially for the less common states.
• This script does NOT repaint. All classification updates on confirmed bar close only.
█ DISCLAIMER
For educational and informational purposes only. Nothing here is financial advice. Past behaviour of any regime state does not indicate future results. Trade at your own risk.
────────────────────────────────────────────────────────────────────
█ OVERVIEW
Most regime tools ask "is price trending right now." This one asks a more fundamental question: does this market's statistical character currently reward trend-following or mean-reversion? It applies the Hurst Exponent — a statistic originally developed to study Nile river flood records — via rescaled-range analysis, to classify the market into one of three long-memory regimes.
█ WHAT IT DOES
Estimates the Hurst Exponent (H) over a rolling window and classifies each confirmed bar as Trending (persistent), Mean-Reverting (anti-persistent), or Random Walk (no memory). Colours the chart background accordingly, plots both the smoothed and raw H line in a dedicated pane against static threshold lines and the 0.5 "true random walk" reference, and shows a table with the current state, how long price has been in it, and historical base rates (average forward return and win rate) for each state.
█ THE THEORY BEHIND IT
H.E. Hurst developed this statistic in the 1950s while studying how to size reservoirs for the Nile, where flood years tended to cluster rather than arrive randomly — a property he needed to measure and design around. The same statistic applies to any time series: it measures whether large values tend to be followed by more large values of the same sign (persistence, H > 0.5), whether they tend to reverse (anti-persistence, H < 0.5), or whether the series has no memory at all (H = 0.5, a true random walk).
Applied to price, this is a genuinely different question from "is this asset trending." A trend-following indicator can flag a trend within a market whose underlying character is actually mean-reverting — in which case that trend is more likely to be a temporary deviation that reverses. Knowing which regime you're in tells you which family of tools (trend-following vs. mean-reversion) is statistically better suited to current conditions, independent of what any single trend or oscillator reading says right now.
█ HOW IT IS CALCULATED
1. Take log returns over the window.
2. Build the cumulative deviation-from-mean series within the window, in chronological order, and take its range (maximum minus minimum) — this is R.
3. Compute S, the window's standard deviation of returns.
4. Apply Hurst's classic empirical relation: R/S is approximately equal to (window length / 2) raised to the power H. Rearranging gives H = ln(R/S) / ln(window length / 2).
5. Optionally smooth H (the raw rescaled-range estimate is noisy bar-to-bar by construction).
6. Classify: H above the Trending threshold (default 0.55) → Trending. H below the Mean-Reverting threshold (default 0.45) → Mean-Reverting. Otherwise → Random Walk.
Classification occurs ONLY on confirmed bar close — the plotted H, the background colour and the table all update together, so nothing here can disagree mid-bar or flip back and forth as the current bar forms.
Note: this is a single-scale rescaled-range estimate using Hurst's classic empirical formula, not a full multi-scale regression across many window sizes. It is a practical, computationally efficient approximation, not a research-grade estimator — treat it as a useful compass, not a precise measurement.
█ SETTINGS & CONFIGURATION
• Source (default close)
• Window Length (default 100) — longer windows give a more stable estimate but react slower to a genuine regime change
• Trending / Mean-Reverting Thresholds (default 0.55 / 0.45) — the H values beyond which a regime is declared; the gap between them is the "Random Walk" zone
• Smoothing Length and Type (default 5-period EMA) — reduces the raw estimate's bar-to-bar noise
• Forward Return Window (default 20 bars) — the horizon used for the base-rate table
• Table visibility, position and colours are fully configurable; the main-chart background painting can be toggled off if you only want the statistics pane
█ HOW TO USE IT
Use it to decide which family of tools to trust right now, not as a standalone entry signal. Example: if you run a mean-reversion system, check whether it has historically performed better when this tool reads Mean-Reverting than when it reads Trending; a trend-following system should show the opposite pattern. Check the base-rate table's sample count before treating any single state as meaningfully predictive.
Works on any asset and timeframe with sufficient history for the Window Length. Best used on daily and above, where regime persistence is greatest and the R/S window has enough independent observations to be meaningful.
█ LIMITATIONS
• This is a SINGLE-SCALE rescaled-range estimate, not a full multi-scale regression across many window sizes — a practical approximation, not a research-grade estimator.
• H describes the market's statistical character over the window — it does NOT identify direction. A "Trending" reading means persistence is likely, not which way.
• The R/S statistic assumes no major structural breaks within the window; a sudden regime shift partway through the window can distort the estimate until it fully rolls off.
• Shorter windows react faster but produce noisier, less reliable H estimates; longer windows are more stable but slower to reflect a genuine regime change.
• Historical base-rate stats need a meaningful sample count (check N) before being trusted, especially for the less common states.
• This script does NOT repaint. All classification updates on confirmed bar close only.
█ DISCLAIMER
For educational and informational purposes only. Nothing here is financial advice. Past behaviour of any regime state does not indicate future results. Trade at your own risk.
הערות שחרור
Removed Performance Table
כתב ויתור
המידע והפרסומים אינם מיועדים להיות, ואינם מהווים, ייעוץ או המלצה פיננסית, השקעתית, מסחרית או מכל סוג אחר המסופקת או מאושרת על ידי TradingView. קרא עוד ב־תנאי השימוש.
כתב ויתור
המידע והפרסומים אינם מיועדים להיות, ואינם מהווים, ייעוץ או המלצה פיננסית, השקעתית, מסחרית או מכל סוג אחר המסופקת או מאושרת על ידי TradingView. קרא עוד ב־תנאי השימוש.