OPEN-SOURCE SCRIPT
Cowboy's Recursion Squares (CRS)
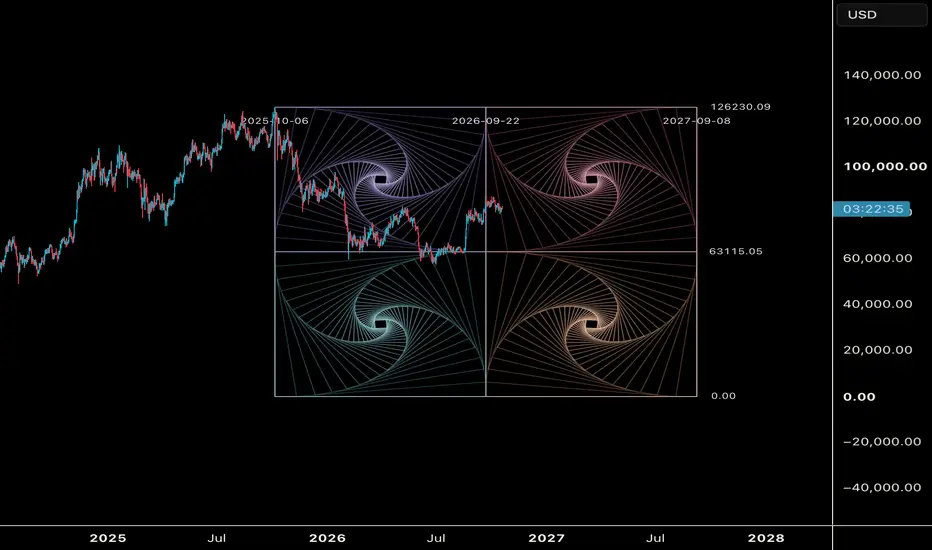
COWBOY RECURSION SQUARES
Straight lines + rotation + recursion = curves that aren't there.
THE CONCEPT
Start with one square. Move each corner 10% of the way toward the next corner, then connect the four new points. You get a smaller square, slightly rotated. Repeat this many times and spirals appear, even though every line on the chart is perfectly straight.
Each step uses the same rule:
A(n+1) = (1 − λ)·A(n) + λ·B(n)
With λ = 0.10, every new square turns about 6.34° and shrinks to about 90.55% of the one before it. The four quadrants are mirror images of each other, so their spirals turn in opposite directions and meet along the center line.
HOW TO USE
1. Add the indicator to your chart.
2. Click two points: the bottom-left corner (time and price), then the top-right corner.
3. The master square is drawn between those two points, the same way you'd anchor a Gann Box. You can extend it into the future to project time.
4. To move it later, open Settings and edit the anchor times and prices.
CUSTOMIZE
• Layout: a 2x2 mirrored grid, or a single square
• λ (step size): smaller values make tighter, slower spirals; larger values make faster rotation
• Depth: how many nested squares each quadrant draws
• Mirror quadrants: turn on or off
• Reverse spin: flip the rotation direction
• Colors: a separate color for each quadrant, or one color for everything (Mono)
• Outer fade and core glow: lines brighten toward the center of each spiral
• Overlays: frame, 50% price/time cross, diagonals, the highlighted corner spiral, and price/date labels
NOTES
• The geometry is drawn inside your box, so it stretches with whatever price and time range you set.
• Price and time scale differently, so the squares can look like rectangles on some charts. Adjust the chart's scale for a true square.
• This is a geometry and visualization tool, not a buy or sell signal. Use it together with your own analysis of structure, levels and timing.
YEEHAW
סקריפט קוד פתוח
ברוח האמיתית של TradingView, יוצר הסקריפט הזה הפך אותו לקוד פתוח, כך שסוחרים יוכלו לעיין בו ולאמת את פעולתו. כל הכבוד למחבר! אמנם ניתן להשתמש בו בחינם, אך זכור כי פרסום חוזר של הקוד כפוף ל־כללי הבית שלנו.

כתב ויתור
המידע והפרסומים אינם מיועדים להיות, ואינם מהווים, ייעוץ או המלצה פיננסית, השקעתית, מסחרית או מכל סוג אחר המסופקת או מאושרת על ידי TradingView. קרא עוד ב־תנאי השימוש.
סקריפט קוד פתוח
ברוח האמיתית של TradingView, יוצר הסקריפט הזה הפך אותו לקוד פתוח, כך שסוחרים יוכלו לעיין בו ולאמת את פעולתו. כל הכבוד למחבר! אמנם ניתן להשתמש בו בחינם, אך זכור כי פרסום חוזר של הקוד כפוף ל־כללי הבית שלנו.
כתב ויתור
המידע והפרסומים אינם מיועדים להיות, ואינם מהווים, ייעוץ או המלצה פיננסית, השקעתית, מסחרית או מכל סוג אחר המסופקת או מאושרת על ידי TradingView. קרא עוד ב־תנאי השימוש.