Volatility Regime Meter (ATR Percentile)
OVERVIEW
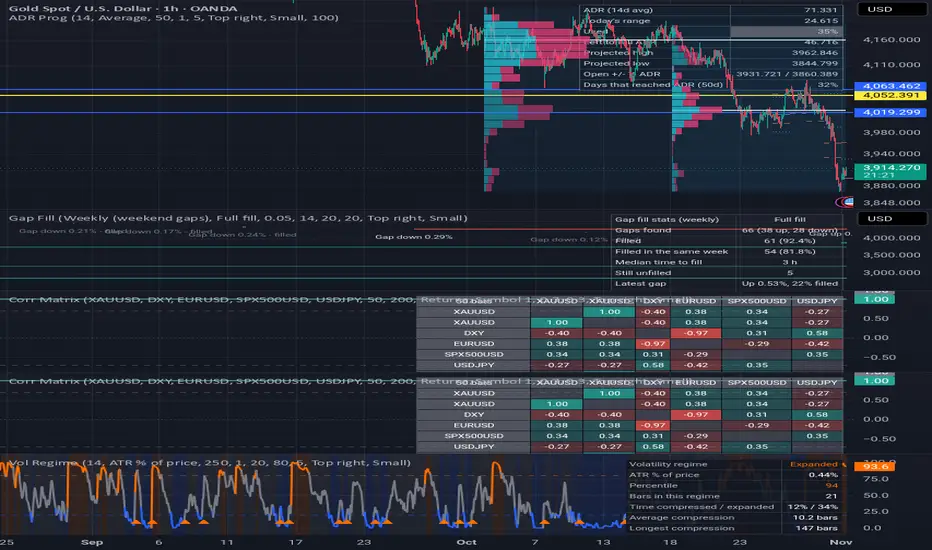
This indicator answers a simple question: is the market quiet or busy right now compared with its own recent past? It ranks the current Average True Range (ATR) against the last few hundred bars, turns that into a percentile from 0 to 100, and sorts every bar into one of three regimes: compressed, normal or expanded. It also marks the bar where a long, quiet compression ends and keeps simple statistics on how long compressions usually last.
WHAT MAKES IT DIFFERENT
- ATR on its own is just a number in price units, so it is hard to say whether 3.2 is high or low. A percentile puts it in context: 90 means volatility is higher than on about 90% of the bars in the lookback.
- By default ATR is measured as a percentage of price, so readings stay comparable after price has moved a long way.
- Every bar gets a clear regime label and colour, and the regime can colour the chart's own candles if you want.
- A table shows how long the current regime has lasted, how much of the lookback was compressed or expanded, and the average and longest compression so far.
HOW IT WORKS
- ATR is calculated with the length you choose, optionally converted to a percentage of the close, and optionally smoothed.
- The percentile is the share of the previous bars in the lookback whose reading was at or below the current one.
- Below the compressed level (20 by default) the bar is compressed. Above the expanded level (80 by default) it is expanded. Anything in between is normal.
- A compression release is the first bar that leaves the compressed regime after at least the minimum number of compressed bars.
HOW TO USE
1. Add the indicator to any chart. It opens in its own pane.
2. Read the line: blue means compressed, grey means normal and orange means expanded. Dashed lines mark the two levels you set.
3. Small triangles at the bottom of the pane mark compression releases, which are moments when a quiet period has ended.
4. Use the regime as context. For example, you may want wider stops and smaller positions in an expanded regime, or you may want to watch for a breakout attempt after a long compression.
5. Turn on "Colour chart bars by regime" to see the regime directly on the price chart.
6. Alerts are available for entering the compressed regime, entering the expanded regime and a compression release.
INPUTS
Calculation
- ATR length, measure (ATR % of price or raw ATR), percentile lookback and smoothing.
Regimes
- Compressed level, expanded level and the minimum compressed bars needed before a release is marked.
Display
- Background shading, candle colouring, release marks and the three regime colours.
Table
- Show table, position and text size.
LIMITATIONS
- The percentile only compares volatility with the chosen lookback. A change of lookback or timeframe changes the result.
- The indicator needs a full lookback of bars before it gives readings, so the start of the chart shows nothing.
- Volatility describes how much price moves, not which way. A compression release does not tell you the direction of the next move, and it does not mean a large move will follow.
- Weekends, holidays and session gaps can make single bars unusually large or small, which affects ATR.
- The statistics only cover the bars loaded on your chart.
Free, open-source tool by cfdtools, built for CFD, forex, gold and index traders. Use it for analysis and education only.
This script is for educational and informational purposes only and is not financial advice. Trading CFDs and forex involves significant risk of loss.
This indicator answers a simple question: is the market quiet or busy right now compared with its own recent past? It ranks the current Average True Range (ATR) against the last few hundred bars, turns that into a percentile from 0 to 100, and sorts every bar into one of three regimes: compressed, normal or expanded. It also marks the bar where a long, quiet compression ends and keeps simple statistics on how long compressions usually last.
WHAT MAKES IT DIFFERENT
- ATR on its own is just a number in price units, so it is hard to say whether 3.2 is high or low. A percentile puts it in context: 90 means volatility is higher than on about 90% of the bars in the lookback.
- By default ATR is measured as a percentage of price, so readings stay comparable after price has moved a long way.
- Every bar gets a clear regime label and colour, and the regime can colour the chart's own candles if you want.
- A table shows how long the current regime has lasted, how much of the lookback was compressed or expanded, and the average and longest compression so far.
HOW IT WORKS
- ATR is calculated with the length you choose, optionally converted to a percentage of the close, and optionally smoothed.
- The percentile is the share of the previous bars in the lookback whose reading was at or below the current one.
- Below the compressed level (20 by default) the bar is compressed. Above the expanded level (80 by default) it is expanded. Anything in between is normal.
- A compression release is the first bar that leaves the compressed regime after at least the minimum number of compressed bars.
HOW TO USE
1. Add the indicator to any chart. It opens in its own pane.
2. Read the line: blue means compressed, grey means normal and orange means expanded. Dashed lines mark the two levels you set.
3. Small triangles at the bottom of the pane mark compression releases, which are moments when a quiet period has ended.
4. Use the regime as context. For example, you may want wider stops and smaller positions in an expanded regime, or you may want to watch for a breakout attempt after a long compression.
5. Turn on "Colour chart bars by regime" to see the regime directly on the price chart.
6. Alerts are available for entering the compressed regime, entering the expanded regime and a compression release.
INPUTS
Calculation
- ATR length, measure (ATR % of price or raw ATR), percentile lookback and smoothing.
Regimes
- Compressed level, expanded level and the minimum compressed bars needed before a release is marked.
Display
- Background shading, candle colouring, release marks and the three regime colours.
Table
- Show table, position and text size.
LIMITATIONS
- The percentile only compares volatility with the chosen lookback. A change of lookback or timeframe changes the result.
- The indicator needs a full lookback of bars before it gives readings, so the start of the chart shows nothing.
- Volatility describes how much price moves, not which way. A compression release does not tell you the direction of the next move, and it does not mean a large move will follow.
- Weekends, holidays and session gaps can make single bars unusually large or small, which affects ATR.
- The statistics only cover the bars loaded on your chart.
Free, open-source tool by cfdtools, built for CFD, forex, gold and index traders. Use it for analysis and education only.
This script is for educational and informational purposes only and is not financial advice. Trading CFDs and forex involves significant risk of loss.

כתב ויתור
המידע והפרסומים אינם מיועדים להיות, ואינם מהווים, ייעוץ או המלצה פיננסית, השקעתית, מסחרית או מכל סוג אחר המסופקת או מאושרת על ידי TradingView. קרא עוד ב־תנאי השימוש.
כתב ויתור
המידע והפרסומים אינם מיועדים להיות, ואינם מהווים, ייעוץ או המלצה פיננסית, השקעתית, מסחרית או מכל סוג אחר המסופקת או מאושרת על ידי TradingView. קרא עוד ב־תנאי השימוש.