מעודכן
CPR, Floor and Camarilla Pivots
🍀Overview
🍀Features
🍀Inputs
General
CPR Pivots
Floor Pivots
Camarilla Pivots
🍀Usage
🍀Disclaimer
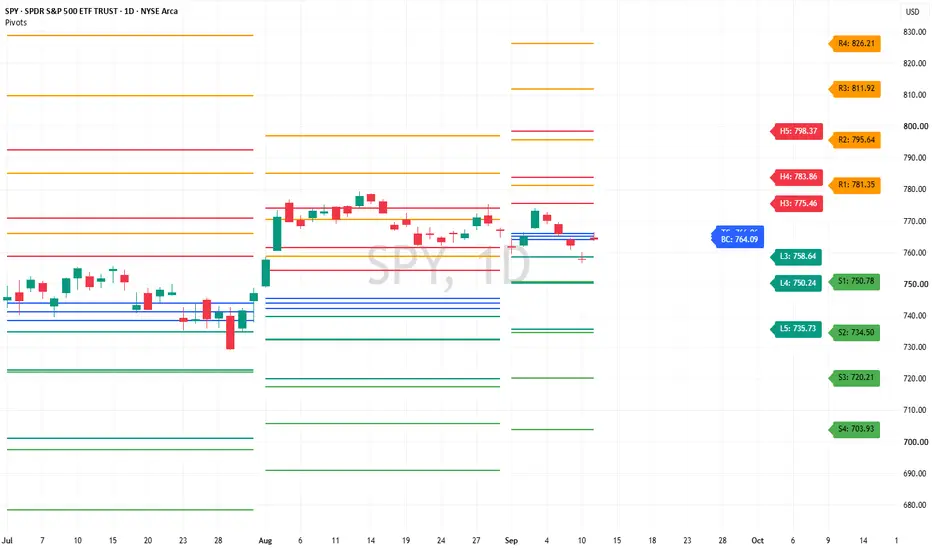
- CPR, Floor and Camarilla Pivots combines 3 popular pivot-point systems in one TradingView indicator. It calculates levels from the previous completed higher-timeframe candle and displays them directly on the price chart.
- The indicator includes Central Pivot Range levels, traditional Floor Pivot support and resistance levels, and Camarilla levels. Each pivot group can be enabled, customized, extended, and labeled independently.
🍀Features
- Displays CPR levels: Pivot, Top Central (TC), and Bottom Central (BC).
- Displays Floor Pivot resistance levels R1–R4 and support levels S1–S4.
- Displays Camarilla levels H1–H5 and L1–L5.
- Uses the previous completed higher-timeframe candle to calculate pivot levels.
- Includes an automatic higher-timeframe selection mode:
- Charts below 1D use daily pivots.
- Charts below 1M use monthly pivots.
- Charts below 12M use yearly pivots.
- Charts at or above 12M use 12-month pivots.
- Allows a user-defined higher timeframe when more control is required.
- Optionally shows only the current higher-timeframe period or preserves previous pivot periods on the chart.
- Provides independent visibility controls for each pivot group and individual level.
- Allows custom colors, line styles, and thickness for each level.
- Supports line extensions to the left, right, both directions, or no extension.
- Displays labels for active levels with optional price values.
🍀Inputs
General
- HTF Method: Select Auto or User Defined for the pivot calculation timeframe.
- Time Frame: Higher timeframe used when User Defined is selected. Default: D.
- Show Only Current HTF Period: When enabled, removes previous pivot lines when a new higher-timeframe period begins.
CPR Pivots
- Show CPR Group: Displays or hides the entire CPR group.
- Label Offset: Controls the horizontal distance between CPR labels and the current bar.
- Show Prices on Labels: Displays the calculated price beside each CPR label.
- Pivot, TC, and BC: Enable or disable each CPR level and customize its color, line style, and thickness.
Floor Pivots
- Show Floor Group: Displays or hides the entire Floor Pivot group.
- Label Offset: Controls the horizontal distance between Floor Pivot labels and the current bar.
- Show Prices on Labels: Displays the calculated price beside each Floor Pivot label.
- R1–R4 and S1–S4: Enable or disable individual resistance and support levels and customize their colors, line styles, and thicknesses.
Camarilla Pivots
- Show Camarilla Group: Displays or hides the entire Camarilla group.
- Label Offset: Controls the horizontal distance between Camarilla labels and the current bar.
- Show Prices on Labels: Displays the calculated price beside each Camarilla label.
- H1–H5 and L1–L5: Enable or disable individual Camarilla levels and customize their colors, line styles, and thicknesses.
🍀Usage
- Use the CPR Pivot as a central reference level for assessing price location and potential intraday bias. The TC and BC levels define the Central Pivot Range and can help identify the area around which price may consolidate or react.
- Floor Pivot resistance levels R1–R4 and support levels S1–S4 can be used as potential reaction, target, breakout, or risk-management reference levels.
- Camarilla levels can provide additional intraday reference points. The H3 and L3 levels are commonly monitored for potential directional reactions, while H4/H5 and L4/L5 may help identify stronger expansion or extended-price areas.
- The indicator uses the previous completed higher-timeframe candle, so the plotted levels remain stable throughout the current higher-timeframe period. For example, daily pivot levels are calculated from the previous completed day when the daily timeframe is selected.
- When multiple pivot systems overlap or cluster near the same price, that area may be useful as a stronger reference zone. Pivot levels are not guaranteed support or resistance and should be interpreted alongside price action, trend, volume, volatility, and broader market conditions.
🍀Disclaimer
- This indicator is provided for informational and educational purposes only. It is not financial advice, investment advice, or a recommendation to buy or sell any asset.
- Pivot levels are calculated reference points and do not guarantee that price will reverse, continue, or reach a particular level. Trading involves substantial risk, and past market behavior does not guarantee future results. Always conduct your own analysis and use appropriate risk management before making trading decisions.
הערות שחרור
Updated the chart
buymeacoffee: buymeacoffee.com/flukefluke_
Stay lucky!🍀
Stay lucky!🍀
כתב ויתור
המידע והפרסומים אינם מיועדים להיות, ואינם מהווים, ייעוץ או המלצה פיננסית, השקעתית, מסחרית או מכל סוג אחר המסופקת או מאושרת על ידי TradingView. קרא עוד ב־תנאי השימוש.
buymeacoffee: buymeacoffee.com/flukefluke_
Stay lucky!🍀
Stay lucky!🍀
כתב ויתור
המידע והפרסומים אינם מיועדים להיות, ואינם מהווים, ייעוץ או המלצה פיננסית, השקעתית, מסחרית או מכל סוג אחר המסופקת או מאושרת על ידי TradingView. קרא עוד ב־תנאי השימוש.