OPEN-SOURCE SCRIPT
מעודכן Self-Aware Trend System [WillyAlgoTrader]
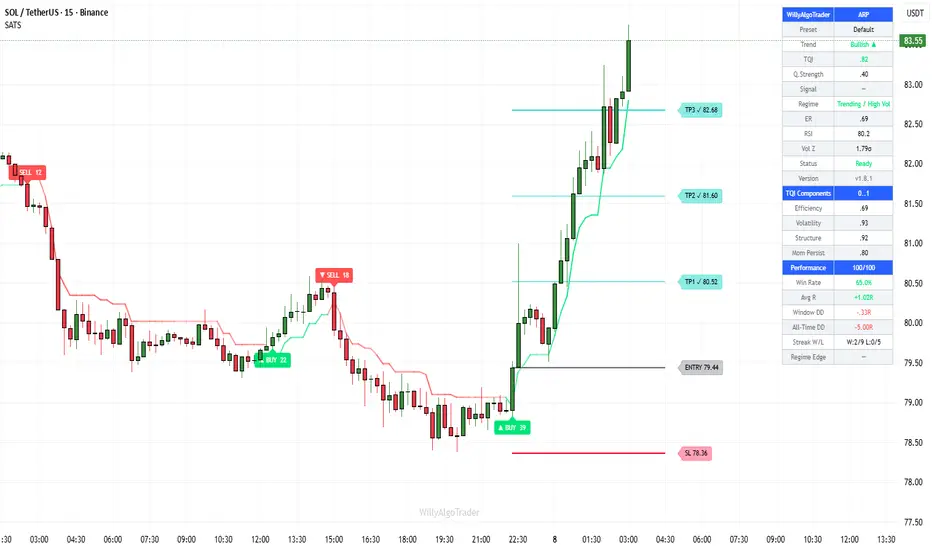
🧠 Self-Aware Trend System (SATS) is an adaptive SuperTrend-based trend-following system that continuously measures its own operating environment through a 4-factor Trend Quality Index (TQI) and modulates band width, asymmetry, and flip logic in real time. Unlike a fixed SuperTrend — which uses the same ATR multiplier forever — SATS knows when the market is trending vs. chopping, compresses bands in clean trends to lock profit tighter, widens them in noisy conditions to avoid whipsaws, and can detect regime collapse through a "character-flip" even when price hasn't broken the band yet. Each confirmed signal comes with a full trade plan (Entry, SL, TP1/TP2/TP3 at user-defined R multiples), and the system tracks its own realized R, win rate, drawdown, and per-regime edge — building an honest, instrument-specific performance log directly on your chart.
The name "Self-Aware" refers to one specific property: the indicator measures the quality of its own environment every bar and feeds that measurement back into its band width and flip conditions. It doesn't predict the future — it reacts to present conditions with mathematically defined adaptation rules.
🧩 WHY THESE COMPONENTS WORK TOGETHER
A classic SuperTrend has one problem: its ATR multiplier is fixed. In a clean trending market the bands are too wide, giving back profit on every pullback. In a choppy market the bands are too tight, generating whipsaw after whipsaw. Traders try to fix this by manually switching multipliers per timeframe or per instrument — but that's guesswork.
SATS chains a different approach:
Market state measurement (TQI) → Non-linear band modulation → Asymmetric band widths → Character-flip detection → R-multiple trade plan → Outcome tracking → Regime-aware statistics
The TQI engine measures market quality from four independent angles each bar (efficiency, volatility regime, structure, momentum persistence). The non-linear modulation translates that quality into band width — high quality compresses bands, low quality expands them, using a power curve that avoids both over-reacting to mild fluctuations and under-reacting to severe regime changes. Asymmetric bands tighten the active side (in the direction of the trend) while loosening the passive side — creating a "ratchet with leverage" that locks in profit faster than it invalidates the trend. Character-flip detection catches regime collapses (high quality → low quality) even when price hasn't broken the band — critical for exiting stale trends before they fully reverse. And performance tracking records every signal's realized R, building a real statistical picture of how the system performs on your specific instrument and timeframe.
Without TQI, the bands are blind. Without asymmetry, profit-taking lags. Without character-flip, exits happen too late. Without performance tracking, you have no idea if the system has a real edge on your instrument. All four work together — each layer addresses a specific weakness of classic SuperTrend.
🔍 WHAT MAKES IT ORIGINAL
1️⃣ Trend Quality Index (TQI) — 4-factor continuous quality measurement.
TQI is computed every bar as a weighted combination of four independent 0..1 factors:
— 🧭 Efficiency (default weight 0.35): Kaufman Efficiency Ratio = |close − close[N]| / sum(|close − close[1]|). Measures directional movement vs. total path. 1.0 = perfect straight line, 0.0 = pure noise. Default window 20 bars.
— 📊 Volatility Regime (weight 0.20): uses Volume Z-score when volume data is available (z = (volume − sma) / stdev, mapped from [-1, 2] to [0, 1]), or falls back to ATR ratio (current ATR vs. long-baseline ATR) on volume-less instruments.
— 🏗️ Structure (weight 0.25): price position within its recent range. pricePos = (close − lowest) / (highest − lowest). Then tqiStruct = |pricePos − 0.5| × 2. Trends pin price to one edge (1.0), chop oscillates around the midpoint (0.0). No ATR dependency.
— ⏩ Momentum Persistence (weight 0.20): of the last N bars, what fraction moved in the same direction as the overall window change? alignedBars / N. Default 10 bars.
Final TQI = (factor1 × w1 + factor2 × w2 + factor3 × w3 + factor4 × w4) / sum(weights), clamped to 0..1. Each weight is user-configurable.
2️⃣ Non-linear band modulation with power curve.
Instead of a linear "multiplier × (1 − tqi)", SATS uses a power curve:
qualityDeviation = (1 − tqi)^curvePower
tqiMult = 1 − qStrength + qStrength × (0.6 + 0.8 × qualityDeviation)
With curvePower = 1.5 (default), mild quality drops (from 0.9 to 0.7) cause small band expansion, but severe drops (0.5 to 0.2) cause rapid expansion. This matches how traders actually think: ignore small wobbles, react strongly to clear regime changes.
3️⃣ Asymmetric band widths — ratchet with leverage.
In a strong uptrend, the lower band (active, trailing price up) tightens while the upper band (passive, not used as stop) widens:
activeMult = symMult × (1 − asymStrength × tqi × 0.3)
passiveMult = symMult × (1 + asymStrength × tqi × 0.4)
Effect: as trend quality rises, the trailing stop moves closer to price (locking profit faster) while the opposite band moves away (so an accidental pullback doesn't trigger a flip). This is the "leverage" — asymmetric response to confirmed trend strength.
4️⃣ EMA-smoothed multipliers before ratchet application.
Raw TQI can spike bar-to-bar. If those spikes fed directly into the SuperTrend ratchet logic, bands would compress at a high-TQI bar and stay stuck there (SuperTrend math never loosens active bands against the trend). SATS EMA-smooths the multipliers (alpha 0.15) before ratchet application — preventing stickiness. This is the critical fix that makes adaptive SuperTrend actually work in practice.
5️⃣ Efficiency-weighted ATR.
Used for band construction and SL/TP sizing (not for TQI itself, to avoid circular feedback):
effATR = rawATR × (0.5 + 0.5 × ER)
Clean trending volatility counts full (ER = 1.0 → effATR = rawATR). Noisy chop volatility is halved (ER = 0.0 → effATR = 0.5 × rawATR). This makes SL/TP distances proportional to "useful" volatility, not total volatility.
6️⃣ Character-flip detection with age guard.
Classic SuperTrend only flips on price breaks. But a trend can die internally — quality collapses, momentum fades — before price actually breaches the band. Character-flip catches this:
charFlipDown = prevTQI > 0.55 (high) AND currentTQI < 0.25 (low) AND trendAge ≥ minAge AND close < source
The age guard (default 5 bars) prevents whipsaw on fresh trends — a newborn trend hasn't had time to establish quality, so early TQI noise can't kill it. After the age threshold, a quality collapse triggers an immediate flip even without price break.
7️⃣ Auto-fixed TP order.
If a user accidentally sets TP1 > TP2 (or TP3 < TP2), the indicator automatically sorts them. Math: fixedMin = min(all), fixedMax = max(all), middle = sum − min − max. The three TP lines always end up in correct order on the chart regardless of user input order.
8️⃣ R-multiple trade planning with pivot-anchored SL.
On each signal:
— Entry = close at bar of confirmed flip
— SL = min(pivot − slMult×ATR, entry − slMult×ATR) for longs (mirror for shorts)
— TP1/2/3 = entry ± risk × R-multiple
The SL uses whichever is further from entry — the recent pivot (if available) or a pure ATR distance. This ensures the stop always has a minimum ATR buffer regardless of how close the nearest pivot is.
9️⃣ Performance tracking with realized R accounting.
Every signal is tracked bar-by-bar for TP hits, SL hits, and timeout (default 100 bars). On close-out, realized R is calculated assuming 1/3 position per TP:
— TP3 hit: realized = (tp1R + tp2R + tp3R) / 3 (all three filled)
— SL hit after TP1: realized = (1/3) × tp1R + (2/3) × (−1R)
— SL hit after TP1+TP2: realized = (1/3) × tp1R + (1/3) × tp2R + (1/3) × (−1R)
— Pure SL: realized = −1R
— Timeout: realized = sum of already-hit TP portions (no penalty)
Results feed a rolling buffer (up to 100 signals), which drives:
— Rolling Win Rate
— Rolling Avg R
— Rolling drawdown (window DD)
— All-time drawdown
— Current and max win/loss streaks
🔟 9-cell regime edge tracking.
Every completed signal is bucketed by the market regime at entry time: Efficiency bin (low/mid/high) × Volatility bin (low/normal/high) = 3×3 = 9 cells. Each cell accumulates its own EWMA of realized R. The dashboard shows the current regime's historical edge — e.g., "Trending + High Vol: +0.85R (23 trades)". This lets you see which market conditions the system actually profits in.
1️⃣1️⃣ Experimental self-calibration (off by default).
When enabled, the system monitors its rolling avg R and drifts the Quality Influence parameter toward the user default if recent edge is poor (below threshold). This is explicitly marked experimental — no claim of improved results — and recommended off until validated on your instrument.
⚙️ HOW IT WORKS — CALCULATION FLOW
Step 1 — TQI computation: Compute four factors (Efficiency, Volatility Regime, Structure, Momentum Persistence). Weight and combine into a single 0..1 value.
Step 2 — ATR and effective ATR: rawATR = ta.atr(len). effATR = rawATR × (0.5 + 0.5 × ER).
Step 3 — Adaptive multiplier: Apply legacy ER adaptation (optional) and non-linear TQI curve. If asymmetric bands enabled, split into active/passive multipliers.
Step 4 — EMA smoothing: Smooth both multipliers with alpha 0.15 to prevent ratchet stickiness.
Step 5 — SuperTrend bands: upperBand = source + upperMult × effATR. lowerBand = source − lowerMult × effATR. Ratchet logic: lower only rises, upper only falls, until a flip.
Step 6 — Flip detection: Price flip (close crosses opposite band) OR character-flip (TQI collapse + age guard). On flip: reset trend age, start new segment.
Step 7 — Trade plan: On confirmed flip, compute Entry/SL/TP1/TP2/TP3. Draw lines and labels. Cache the market regime (ER bin × Vol bin) for later edge attribution.
Step 8 — Outcome tracking: Each bar, check active trade for TP1/TP2/TP3/SL hits and timeout. On close-out, calculate realized R, push to history buffer, update rolling stats, drawdown, streaks, and regime cell.
Step 9 — Dashboard render: On last bar, render live state (Trend, TQI, regime, performance stats, TQI breakdown, regime edge).
📖 HOW TO USE
🎯 Quick start:
1. Add indicator — preset is "Auto" (adapts to your current timeframe)
2. Green line = bullish trend, red = bearish trend
3. Line transparency reflects TQI: bright = high quality, faded = low quality
4. ▲ BUY / ▼ SELL labels appear on confirmed flips
5. Entry, SL, TP1, TP2, TP3 lines drawn automatically at the signal
6. Copy levels to your exchange, let the dashboard track outcomes
👁️ Reading the chart:
— 🟢 Bright green line = bullish trend with high TQI — aggressive participation
— 🟢 Faded green line = bullish trend with low TQI — cautious, possible regime shift
— 🔴 Bright red line = bearish trend with high TQI
— 🔴 Faded red line = bearish trend with low TQI
— Line flip + label = new trade signal
— Dashed TP lines turning solid + "✓" = TP was hit
— Score on label (e.g., "85/102") = multi-factor confluence strength
📊 Dashboard fields:
— Preset: Auto-resolved (Scalping / Default / Swing / Crypto)
— Trend: Bullish ▲ / Bearish ▼
— TQI: current quality index (0..1)
— Q.Strength: effective Quality Influence (may drift if auto-calibration enabled)
— Signal: current bar signal (BUY / SELL / —)
— Regime: Trending / Mixed / Choppy + Low/Norm/High Vol
— ER / RSI / Vol Z: raw filter values
— TQI Components breakdown: Efficiency / Volatility / Structure / Momentum (each 0..1)
— Performance section: Win Rate, Avg R, Window DD, All-Time DD, Streak W/L, Regime Edge
🔧 Tuning guide:
— Too many whipsaws: increase Quality Influence (0.5–0.7), increase Structure weight, increase Base Band Width
— Missing moves / signals too late: decrease Quality Influence (0.2–0.3), decrease Base Band Width, increase asymmetry
— Choppy instrument: use Swing preset, enable Character-Flip, raise minAge to 10+
— Strong trending instrument: use Scalping preset, enable Asymmetric Bands with strength 0.6+
— No volume data: automatically falls back to ATR ratio for volatility regime — no action needed
⚙️ KEY SETTINGS REFERENCE
⚙️ Main:
— Preset: Auto / Custom / Scalping / Default / Swing / Crypto 24/7 (auto-adapts ATR, band width, ER window, RSI, SL multiplier)
— ATR Length (13), Base Band Width (2.0 × ATR)
📐 Trend Quality Engine:
— Enable TQI (default On)
— Quality Influence (0.4): how strongly TQI compresses/expands bands
— Quality Curve Power (1.5): non-linearity
— Smooth Adaptive Multipliers (On): critical fix for ratchet stickiness
— Asymmetric Bands (On) + Asymmetry Strength (0.5)
— Efficiency-Weighted ATR (On)
— Character-Flip (On) + Min Age (5) + High/Low TQI thresholds (0.55 / 0.25)
— TQI factor weights: ER 0.35, Volatility 0.20, Structure 0.25, Momentum 0.20
🎯 Risk:
— SL Buffer (1.5 × ATR), TP1/2/3 R-multiples (1.0 / 2.0 / 3.0), Trade Timeout (100 bars)
🤖 Self-Learning (experimental):
— Auto-calibration (default Off), calibration window, bad/good R thresholds, quality step, cooldown, floor/ceiling
— Reset Learning Memory button
📊 Dashboard: position, TQI breakdown toggle, performance stats toggle, score breakdown toggle
🔔 Alerts
— 🟢 BUY — ticker, TF, price, TQI, score, SL, TP1, TP2, TP3
— 🔴 SELL — same payload
Plain text and JSON webhook formats supported. Bar-close confirmed.
⚠️ IMPORTANT NOTES
— 🚫 No repainting. All signals require barstate.isconfirmed. SuperTrend ratchet logic is monotonic — once the trailing band moves, it cannot move back against the trend until a flip. Character-flip uses only previous-bar TQI and current-bar close, both available at bar close.
— 📊 TQI is descriptive, not predictive. It measures current market quality from 4 factors — it does not forecast future price. A high TQI reading means "the market is currently behaving like a trend" — it can still fail on the next bar.
— 📏 Performance stats are walk-forward, not backtested. The rolling buffer records signals as they happen, bar by bar. Drawdown, win rate, and regime edge are honest forward-looking statistics on your specific instrument and timeframe — not curve-fitted optimization results.
— ⚖️ The realized R accounting assumes 1/3 position per TP. This mirrors a standard "scale out at each target" approach. Traders who hold full position to a single target should interpret the R values accordingly.
— 🔄 Auto-calibration is experimental. It's off by default and should stay off until you've validated it on your specific instrument. The drift is mean-reverting (toward your user default), not profit-maximizing — no claim of improvement is made.
— 🔒 The Reset Learning Memory button clears the rolling buffer, regime cells, drawdown, and streak stats. Use when changing instruments or after significant market regime shifts.
— 🛠️ SATS is a decision-support and trade-planning tool, not an automated bot. It identifies trend conditions, measures environmental quality, provides structured trade plans with R-based targets, and tracks outcomes — trade decisions and execution remain yours.
— 🌐 Works on all markets and timeframes. Volume-dependent features (Volume Z in TQI) auto-fall-back to ATR-based measurement when volume data is unavailable.
The name "Self-Aware" refers to one specific property: the indicator measures the quality of its own environment every bar and feeds that measurement back into its band width and flip conditions. It doesn't predict the future — it reacts to present conditions with mathematically defined adaptation rules.
🧩 WHY THESE COMPONENTS WORK TOGETHER
A classic SuperTrend has one problem: its ATR multiplier is fixed. In a clean trending market the bands are too wide, giving back profit on every pullback. In a choppy market the bands are too tight, generating whipsaw after whipsaw. Traders try to fix this by manually switching multipliers per timeframe or per instrument — but that's guesswork.
SATS chains a different approach:
Market state measurement (TQI) → Non-linear band modulation → Asymmetric band widths → Character-flip detection → R-multiple trade plan → Outcome tracking → Regime-aware statistics
The TQI engine measures market quality from four independent angles each bar (efficiency, volatility regime, structure, momentum persistence). The non-linear modulation translates that quality into band width — high quality compresses bands, low quality expands them, using a power curve that avoids both over-reacting to mild fluctuations and under-reacting to severe regime changes. Asymmetric bands tighten the active side (in the direction of the trend) while loosening the passive side — creating a "ratchet with leverage" that locks in profit faster than it invalidates the trend. Character-flip detection catches regime collapses (high quality → low quality) even when price hasn't broken the band — critical for exiting stale trends before they fully reverse. And performance tracking records every signal's realized R, building a real statistical picture of how the system performs on your specific instrument and timeframe.
Without TQI, the bands are blind. Without asymmetry, profit-taking lags. Without character-flip, exits happen too late. Without performance tracking, you have no idea if the system has a real edge on your instrument. All four work together — each layer addresses a specific weakness of classic SuperTrend.
🔍 WHAT MAKES IT ORIGINAL
1️⃣ Trend Quality Index (TQI) — 4-factor continuous quality measurement.
TQI is computed every bar as a weighted combination of four independent 0..1 factors:
— 🧭 Efficiency (default weight 0.35): Kaufman Efficiency Ratio = |close − close[N]| / sum(|close − close[1]|). Measures directional movement vs. total path. 1.0 = perfect straight line, 0.0 = pure noise. Default window 20 bars.
— 📊 Volatility Regime (weight 0.20): uses Volume Z-score when volume data is available (z = (volume − sma) / stdev, mapped from [-1, 2] to [0, 1]), or falls back to ATR ratio (current ATR vs. long-baseline ATR) on volume-less instruments.
— 🏗️ Structure (weight 0.25): price position within its recent range. pricePos = (close − lowest) / (highest − lowest). Then tqiStruct = |pricePos − 0.5| × 2. Trends pin price to one edge (1.0), chop oscillates around the midpoint (0.0). No ATR dependency.
— ⏩ Momentum Persistence (weight 0.20): of the last N bars, what fraction moved in the same direction as the overall window change? alignedBars / N. Default 10 bars.
Final TQI = (factor1 × w1 + factor2 × w2 + factor3 × w3 + factor4 × w4) / sum(weights), clamped to 0..1. Each weight is user-configurable.
2️⃣ Non-linear band modulation with power curve.
Instead of a linear "multiplier × (1 − tqi)", SATS uses a power curve:
qualityDeviation = (1 − tqi)^curvePower
tqiMult = 1 − qStrength + qStrength × (0.6 + 0.8 × qualityDeviation)
With curvePower = 1.5 (default), mild quality drops (from 0.9 to 0.7) cause small band expansion, but severe drops (0.5 to 0.2) cause rapid expansion. This matches how traders actually think: ignore small wobbles, react strongly to clear regime changes.
3️⃣ Asymmetric band widths — ratchet with leverage.
In a strong uptrend, the lower band (active, trailing price up) tightens while the upper band (passive, not used as stop) widens:
activeMult = symMult × (1 − asymStrength × tqi × 0.3)
passiveMult = symMult × (1 + asymStrength × tqi × 0.4)
Effect: as trend quality rises, the trailing stop moves closer to price (locking profit faster) while the opposite band moves away (so an accidental pullback doesn't trigger a flip). This is the "leverage" — asymmetric response to confirmed trend strength.
4️⃣ EMA-smoothed multipliers before ratchet application.
Raw TQI can spike bar-to-bar. If those spikes fed directly into the SuperTrend ratchet logic, bands would compress at a high-TQI bar and stay stuck there (SuperTrend math never loosens active bands against the trend). SATS EMA-smooths the multipliers (alpha 0.15) before ratchet application — preventing stickiness. This is the critical fix that makes adaptive SuperTrend actually work in practice.
5️⃣ Efficiency-weighted ATR.
Used for band construction and SL/TP sizing (not for TQI itself, to avoid circular feedback):
effATR = rawATR × (0.5 + 0.5 × ER)
Clean trending volatility counts full (ER = 1.0 → effATR = rawATR). Noisy chop volatility is halved (ER = 0.0 → effATR = 0.5 × rawATR). This makes SL/TP distances proportional to "useful" volatility, not total volatility.
6️⃣ Character-flip detection with age guard.
Classic SuperTrend only flips on price breaks. But a trend can die internally — quality collapses, momentum fades — before price actually breaches the band. Character-flip catches this:
charFlipDown = prevTQI > 0.55 (high) AND currentTQI < 0.25 (low) AND trendAge ≥ minAge AND close < source
The age guard (default 5 bars) prevents whipsaw on fresh trends — a newborn trend hasn't had time to establish quality, so early TQI noise can't kill it. After the age threshold, a quality collapse triggers an immediate flip even without price break.
7️⃣ Auto-fixed TP order.
If a user accidentally sets TP1 > TP2 (or TP3 < TP2), the indicator automatically sorts them. Math: fixedMin = min(all), fixedMax = max(all), middle = sum − min − max. The three TP lines always end up in correct order on the chart regardless of user input order.
8️⃣ R-multiple trade planning with pivot-anchored SL.
On each signal:
— Entry = close at bar of confirmed flip
— SL = min(pivot − slMult×ATR, entry − slMult×ATR) for longs (mirror for shorts)
— TP1/2/3 = entry ± risk × R-multiple
The SL uses whichever is further from entry — the recent pivot (if available) or a pure ATR distance. This ensures the stop always has a minimum ATR buffer regardless of how close the nearest pivot is.
9️⃣ Performance tracking with realized R accounting.
Every signal is tracked bar-by-bar for TP hits, SL hits, and timeout (default 100 bars). On close-out, realized R is calculated assuming 1/3 position per TP:
— TP3 hit: realized = (tp1R + tp2R + tp3R) / 3 (all three filled)
— SL hit after TP1: realized = (1/3) × tp1R + (2/3) × (−1R)
— SL hit after TP1+TP2: realized = (1/3) × tp1R + (1/3) × tp2R + (1/3) × (−1R)
— Pure SL: realized = −1R
— Timeout: realized = sum of already-hit TP portions (no penalty)
Results feed a rolling buffer (up to 100 signals), which drives:
— Rolling Win Rate
— Rolling Avg R
— Rolling drawdown (window DD)
— All-time drawdown
— Current and max win/loss streaks
🔟 9-cell regime edge tracking.
Every completed signal is bucketed by the market regime at entry time: Efficiency bin (low/mid/high) × Volatility bin (low/normal/high) = 3×3 = 9 cells. Each cell accumulates its own EWMA of realized R. The dashboard shows the current regime's historical edge — e.g., "Trending + High Vol: +0.85R (23 trades)". This lets you see which market conditions the system actually profits in.
1️⃣1️⃣ Experimental self-calibration (off by default).
When enabled, the system monitors its rolling avg R and drifts the Quality Influence parameter toward the user default if recent edge is poor (below threshold). This is explicitly marked experimental — no claim of improved results — and recommended off until validated on your instrument.
⚙️ HOW IT WORKS — CALCULATION FLOW
Step 1 — TQI computation: Compute four factors (Efficiency, Volatility Regime, Structure, Momentum Persistence). Weight and combine into a single 0..1 value.
Step 2 — ATR and effective ATR: rawATR = ta.atr(len). effATR = rawATR × (0.5 + 0.5 × ER).
Step 3 — Adaptive multiplier: Apply legacy ER adaptation (optional) and non-linear TQI curve. If asymmetric bands enabled, split into active/passive multipliers.
Step 4 — EMA smoothing: Smooth both multipliers with alpha 0.15 to prevent ratchet stickiness.
Step 5 — SuperTrend bands: upperBand = source + upperMult × effATR. lowerBand = source − lowerMult × effATR. Ratchet logic: lower only rises, upper only falls, until a flip.
Step 6 — Flip detection: Price flip (close crosses opposite band) OR character-flip (TQI collapse + age guard). On flip: reset trend age, start new segment.
Step 7 — Trade plan: On confirmed flip, compute Entry/SL/TP1/TP2/TP3. Draw lines and labels. Cache the market regime (ER bin × Vol bin) for later edge attribution.
Step 8 — Outcome tracking: Each bar, check active trade for TP1/TP2/TP3/SL hits and timeout. On close-out, calculate realized R, push to history buffer, update rolling stats, drawdown, streaks, and regime cell.
Step 9 — Dashboard render: On last bar, render live state (Trend, TQI, regime, performance stats, TQI breakdown, regime edge).
📖 HOW TO USE
🎯 Quick start:
1. Add indicator — preset is "Auto" (adapts to your current timeframe)
2. Green line = bullish trend, red = bearish trend
3. Line transparency reflects TQI: bright = high quality, faded = low quality
4. ▲ BUY / ▼ SELL labels appear on confirmed flips
5. Entry, SL, TP1, TP2, TP3 lines drawn automatically at the signal
6. Copy levels to your exchange, let the dashboard track outcomes
👁️ Reading the chart:
— 🟢 Bright green line = bullish trend with high TQI — aggressive participation
— 🟢 Faded green line = bullish trend with low TQI — cautious, possible regime shift
— 🔴 Bright red line = bearish trend with high TQI
— 🔴 Faded red line = bearish trend with low TQI
— Line flip + label = new trade signal
— Dashed TP lines turning solid + "✓" = TP was hit
— Score on label (e.g., "85/102") = multi-factor confluence strength
📊 Dashboard fields:
— Preset: Auto-resolved (Scalping / Default / Swing / Crypto)
— Trend: Bullish ▲ / Bearish ▼
— TQI: current quality index (0..1)
— Q.Strength: effective Quality Influence (may drift if auto-calibration enabled)
— Signal: current bar signal (BUY / SELL / —)
— Regime: Trending / Mixed / Choppy + Low/Norm/High Vol
— ER / RSI / Vol Z: raw filter values
— TQI Components breakdown: Efficiency / Volatility / Structure / Momentum (each 0..1)
— Performance section: Win Rate, Avg R, Window DD, All-Time DD, Streak W/L, Regime Edge
🔧 Tuning guide:
— Too many whipsaws: increase Quality Influence (0.5–0.7), increase Structure weight, increase Base Band Width
— Missing moves / signals too late: decrease Quality Influence (0.2–0.3), decrease Base Band Width, increase asymmetry
— Choppy instrument: use Swing preset, enable Character-Flip, raise minAge to 10+
— Strong trending instrument: use Scalping preset, enable Asymmetric Bands with strength 0.6+
— No volume data: automatically falls back to ATR ratio for volatility regime — no action needed
⚙️ KEY SETTINGS REFERENCE
⚙️ Main:
— Preset: Auto / Custom / Scalping / Default / Swing / Crypto 24/7 (auto-adapts ATR, band width, ER window, RSI, SL multiplier)
— ATR Length (13), Base Band Width (2.0 × ATR)
📐 Trend Quality Engine:
— Enable TQI (default On)
— Quality Influence (0.4): how strongly TQI compresses/expands bands
— Quality Curve Power (1.5): non-linearity
— Smooth Adaptive Multipliers (On): critical fix for ratchet stickiness
— Asymmetric Bands (On) + Asymmetry Strength (0.5)
— Efficiency-Weighted ATR (On)
— Character-Flip (On) + Min Age (5) + High/Low TQI thresholds (0.55 / 0.25)
— TQI factor weights: ER 0.35, Volatility 0.20, Structure 0.25, Momentum 0.20
🎯 Risk:
— SL Buffer (1.5 × ATR), TP1/2/3 R-multiples (1.0 / 2.0 / 3.0), Trade Timeout (100 bars)
🤖 Self-Learning (experimental):
— Auto-calibration (default Off), calibration window, bad/good R thresholds, quality step, cooldown, floor/ceiling
— Reset Learning Memory button
📊 Dashboard: position, TQI breakdown toggle, performance stats toggle, score breakdown toggle
🔔 Alerts
— 🟢 BUY — ticker, TF, price, TQI, score, SL, TP1, TP2, TP3
— 🔴 SELL — same payload
Plain text and JSON webhook formats supported. Bar-close confirmed.
⚠️ IMPORTANT NOTES
— 🚫 No repainting. All signals require barstate.isconfirmed. SuperTrend ratchet logic is monotonic — once the trailing band moves, it cannot move back against the trend until a flip. Character-flip uses only previous-bar TQI and current-bar close, both available at bar close.
— 📊 TQI is descriptive, not predictive. It measures current market quality from 4 factors — it does not forecast future price. A high TQI reading means "the market is currently behaving like a trend" — it can still fail on the next bar.
— 📏 Performance stats are walk-forward, not backtested. The rolling buffer records signals as they happen, bar by bar. Drawdown, win rate, and regime edge are honest forward-looking statistics on your specific instrument and timeframe — not curve-fitted optimization results.
— ⚖️ The realized R accounting assumes 1/3 position per TP. This mirrors a standard "scale out at each target" approach. Traders who hold full position to a single target should interpret the R values accordingly.
— 🔄 Auto-calibration is experimental. It's off by default and should stay off until you've validated it on your specific instrument. The drift is mean-reverting (toward your user default), not profit-maximizing — no claim of improvement is made.
— 🔒 The Reset Learning Memory button clears the rolling buffer, regime cells, drawdown, and streak stats. Use when changing instruments or after significant market regime shifts.
— 🛠️ SATS is a decision-support and trade-planning tool, not an automated bot. It identifies trend conditions, measures environmental quality, provides structured trade plans with R-based targets, and tracks outcomes — trade decisions and execution remain yours.
— 🌐 Works on all markets and timeframes. Volume-dependent features (Volume Z in TQI) auto-fall-back to ATR-based measurement when volume data is unavailable.
הערות שחרור
📋 SATS v1.9.0 — Release Notes━━━━━━━━━━━━━━━━━━━━━━━━━━━━━━━━━━━━━━━━
🎯 DYNAMIC TAKE-PROFIT ENGINE
━━━━━━━━━━━━━━━━━━━━━━━━━━━━━━━━━━━━━━━━
Version 1.9.0 introduces an Adaptive Dynamic TP system — a new take-profit mode that automatically adjusts your R-multiples based on real-time market conditions. When the market is trending cleanly, your targets expand to capture bigger moves. When conditions deteriorate, targets compress to lock in what's available.
✅ 100% backward compatible — Fixed mode = identical to v1.8.1. All existing setups and alerts remain unchanged.
━━━━━━━━━━━━━━━━━━━━━━━━━━━━━━━━━━━━━━━━
⚙️ NEW SETTING: TP MODE
━━━━━━━━━━━━━━━━━━━━━━━━━━━━━━━━━━━━━━━━
A new dropdown in 🎯 Risk Management lets you choose between two modes:
Fixed (default)
Classic fixed R-multiples — identical to v1.8.1. Nothing changes.
Dynamic
TP1/TP2/TP3 scale up or down each signal based on
Trend Quality Index (TQI) and volatility regime.
━━━━━━━━━━━━━━━━━━━━━━━━━━━━━━━━━━━━━━━━
🎯 NEW GROUP: DYNAMIC TP SETTINGS
━━━━━━━━━━━━━━━━━━━━━━━━━━━━━━━━━━━━━━━━
When TP Mode = Dynamic, six new parameters become active:
TQI Influence on TP (default: 0.60)
Weight of Trend Quality Index in the scaling formula.
Higher = targets respond more aggressively to trend quality.
Volatility Influence on TP (default: 0.40)
Weight of the volatility regime (ATR / baseline ATR).
Higher volatility → wider targets.
Min TP Scale (default: 0.50)
Floor multiplier. Targets never shrink below base R × 0.5.
Prevents absurdly tight TPs in choppy markets.
Max TP Scale (default: 2.00)
Ceiling multiplier. Targets never expand beyond base R × 2.0.
Prevents unreachable TPs in euphoric trends.
TP1 Absolute Floor (default: 0.50 R)
Hard minimum for TP1 regardless of scaling.
TP3 Absolute Ceiling (default: 8.00 R)
Hard maximum for TP3 regardless of scaling.
━━━━━━━━━━━━━━━━━━━━━━━━━━━━━━━━━━━━━━━━
📐 HOW THE SCALING FORMULA WORKS
━━━━━━━━━━━━━━━━━━━━━━━━━━━━━━━━━━━━━━━━
Each signal computes a TP Scale factor from two components:
TQI Component = current TQI value (0 → 1)
Vol Component = ATR / baseline ATR, mapped [0.5 … 2.0] → [0 … 1]
Raw Scale = weighted average of both components
Final Scale = mapped into [Min TP Scale … Max TP Scale]
Then for each take-profit level:
Effective R = Base R × Final Scale
With proportional floor protection — each TP level gets its own minimum proportional to the base ratio. Example with base TPs of 1R / 2R / 3R and TP1 Floor = 0.5R:
TP1 floor = 0.5R
TP2 floor = 1.0R (proportional: 0.5 × 2/1)
TP3 floor = 1.5R (proportional: 0.5 × 3/1)
This prevents all three targets from collapsing to the same price at low scale values. After scaling, all three TPs are re-sorted to guarantee TP1 ≤ TP2 ≤ TP3.
━━━━━━━━━━━━━━━━━━━━━━━━━━━━━━━━━━━━━━━━
📊 DASHBOARD UPDATES
━━━━━━━━━━━━━━━━━━━━━━━━━━━━━━━━━━━━━━━━
Three new rows appear in the dashboard:
TP Mode → Fixed or Dynamic
Color-coded green when scale > 1.2×, red when < 0.8×
TP Scale → Current multiplier (e.g. ×1.35)
Only shown in Dynamic mode
Live R → Real-time R-multiples for the next signal
e.g. 1.4 / 2.7 / 4.1
━━━━━━━━━━━━━━━━━━━━━━━━━━━━━━━━━━━━━━━━
🏷️ ENHANCED LABELS & TOOLTIPS
━━━━━━━━━━━━━━━━━━━━━━━━━━━━━━━━━━━━━━━━
Signal labels (BUY / SELL) now include in their tooltip:
• Current TP Mode and scale factor
• Actual R-multiples used for that specific signal
TP/SL price labels on chart show the effective R-multiple in parentheses when Dynamic mode is active:
TP1 1.0850 (1.4R)
TP2 1.0920 (2.7R)
TP3 1.1025 (4.1R)
━━━━━━━━━━━━━━━━━━━━━━━━━━━━━━━━━━━━━━━━
🔔 ALERT UPDATES
━━━━━━━━━━━━━━━━━━━━━━━━━━━━━━━━━━━━━━━━
Both text and webhook JSON alerts now include two new fields:
Text format:
🟢 BUY | EURUSD | ... | TP: dynamic ×1.35
Webhook JSON:
{ ... "tp_mode": "dynamic", "tp_scale": 1.35 }
━━━━━━━━━━━━━━━━━━━━━━━━━━━━━━━━━━━━━━━━
📈 PERFORMANCE TRACKING
━━━━━━━━━━━━━━━━━━━━━━━━━━━━━━━━━━━━━━━━
The self-learning engine now stores per-trade R-multiples. When a trade closes (TP3 hit, SL hit, or timeout), the realized R calculation uses the actual R-multiples that were active at signal entry — not the current dynamic values. This ensures performance statistics remain accurate regardless of how conditions changed after entry.
━━━━━━━━━━━━━━━━━━━━━━━━━━━━━━━━━━━━━━━━
🔧 BUG FIXES
━━━━━━━━━━━━━━━━━━━━━━━━━━━━━━━━━━━━━━━━
• Proportional TP floors — Fixed an issue where all three TP levels could collapse to the same absolute floor value at minimum scale. Each TP now has its own proportional floor.
• Dead variable cleanup — Removed unused internal variable for cleaner code execution.
━━━━━━━━━━━━━━━━━━━━━━━━━━━━━━━━━━━━━━━━
💡 RECOMMENDED SETTINGS BY STYLE
━━━━━━━━━━━━━━━━━━━━━━━━━━━━━━━━━━━━━━━━
Conservative
TP Mode: Dynamic | Min Scale: 0.60 | Max Scale: 1.50
TQI Weight: 0.70 | Vol Weight: 0.30
Balanced
TP Mode: Dynamic | Min Scale: 0.50 | Max Scale: 2.00
TQI Weight: 0.60 | Vol Weight: 0.40
Aggressive
TP Mode: Dynamic | Min Scale: 0.40 | Max Scale: 2.50
TQI Weight: 0.50 | Vol Weight: 0.50
Scalping
TP Mode: Fixed (dynamic scaling adds noise on very short TFs)
⚠️ Dynamic TP works best when the TQI Engine is enabled. With TQI off, only the volatility component drives scaling (TQI defaults to 0.5).
━━━━━━━━━━━━━━━━━━━━━━━━━━━━━━━━━━━━━━━━
✅ SUMMARY
━━━━━━━━━━━━━━━━━━━━━━━━━━━━━━━━━━━━━━━━
✅ New TP Mode selector: Fixed (legacy) or Dynamic (adaptive)
✅ 6 new tuning parameters for fine-grained control
✅ Proportional floor protection per TP level
✅ Dashboard shows live TP scale and R-multiples
✅ Labels, tooltips, and alerts include TP mode info
✅ Per-trade R storage for accurate performance tracking
✅ 100% backward compatible — Fixed mode = identical to v1.8.1
הערות שחרור
Self-Aware Trend System v1.10.0 — Release Notes🔔 Expanded Alert System
This release adds a comprehensive alert framework with 26 total alerts covering every meaningful event in a trade's lifecycle. No core logic was changed — the SuperTrend, TQI engine, Dynamic TP, and self-learning systems remain identical to v1.9.0.
What's New
5 new combined alert() events (fire automatically when "Any alert() function" is selected in TradingView):
🎯 TP1 Hit / 🎯 TP2 Hit / 🏆 TP3 Hit
🛑 SL Hit
🔄 Character-Flip — fires only when SuperTrend flips due to TQI collapse rather than a clean price break (unique to SATS)
All TP/SL/char-flip events support JSON output via the existing Webhook JSON Format toggle.
19 new alertcondition() options appear individually in TradingView's "Create Alert" → Condition dropdown, letting you subscribe to exactly what you want:
Signal alerts: 🟢 Buy / 🔴 Sell (all confirmed signals)
Score-graded variants (0..102 confluence scale): A+ ≥80, A ≥60, B ≥40 — separately for Buy and Sell
TQI-graded variants (0..1 quality index): A+ ≥0.70, A ≥0.50, B ≥0.35 — separately for Buy and Sell
Trade events: 🎯 TP1/TP2/TP3 Hit, 🛑 SL Hit
🔄 Character-Flip as a standalone subscribable condition
⚡ Any Signal — convenience catch-all
Having two parallel grading schemes (Score and TQI) lets you choose between classical confluence filtering and regime/quality filtering without changing chart settings.
Quality Improvements
Whipsaw protection: when a single bar pierces both SL and a TP level (low-pierce + high-tag), only the SL alert fires. The TP alerts are correctly suppressed to reflect the actual trade outcome.
Repaint-safe: all hit-detection events fire only on confirmed bars.
Rising-edge detection: every TP/SL/char-flip event fires exactly once per occurrence, no spam.
JSON payloads include tp_mode and tp_scale for full Dynamic-TP visibility on the webhook receiver side.
Notes
The Enable Alert Signals toggle controls combined alert() calls. Individual alertcondition() items are managed per-alert in TradingView's dialog.
Existing BUY/SELL alerts from v1.9.0 are unchanged — your existing TradingView alerts continue working without modification.
No changes to indicator inputs, calculations, dashboard, or visuals.
הערות שחרור
Self-Aware Trend System — Update v1.12.0A major update focused on statistical integrity, risk-model accuracy and performance. The indicator's logic and math went through a full audit.
🆕 New
Flip-Exit — an open trade is now force-closed when an opposite signal fires, and its result is recorded in the statistics. Includes a 🔁 FLIP EXIT alert and a flip_exit webhook event.
Reworked timeout exit — on a timeout close, the remaining position is valued at its actual open P&L (previously counted as 0R). Includes a ⏱ TIMEOUT EXIT alert, a timeout_exit webhook event and an on-chart mark.
Max SL Distance (xATR) — a new input: a hard cap on stop distance from entry. Protects against stale, far-away pivots inflating per-trade risk.
⚠️ Important: the statistics are now honest
In previous versions, a trade closed by an opposite signal silently vanished from the statistics — and such trades are more often losers. This inflated the dashboard's Win Rate and Avg R (survivorship bias). Now every trade gets an outcome: SL, TP, timeout or flip-exit. Dashboard numbers may look more modest than in v1.10 — that is not a downgrade, it is corrected, unbiased statistics.
🔧 Fixed
Character-Flip now actually works — TQI collapse detection moved to window-based analysis (the old conditions were practically impossible to meet, so the feature effectively never fired).
Whipsaw consistency — if SL and TP are pierced on the same bar, SL takes priority: the TP is not counted in stats, alerts or visuals. Conservative and unambiguous.
RSI Depth in the signal score is now computed on a continuous series (the previous conditional calculation produced distorted values).
Warmup status accounts for all calculation periods — "Ready" no longer appears prematurely.
Dynamic TP — fixed a rare floor/ceiling conflict; the ceiling is honestly applied to all TP levels.
Auto-Calibration switched to directional hill-climbing: a step is reversed if the previous adjustment made results worse; on a good edge the search freezes.
Correct Volume Z behavior on instruments with zero-volume bars.
⚡ Performance
Momentum Persistence moved from a per-bar loop to rolling sums.
All dashboard preparation now runs on the last bar only — noticeably lighter on long histories.
Internal refactor: self-learning statistics encapsulated in a single module, dead code removed, input tooltips expanded.
As always: this indicator is an analysis tool, not a guarantee of results. Test on your own instruments and timeframes.
הערות שחרור
🚀 SATS v1.13.1 — Trade Accounting, Signal Scoring & Trader Dashboard UpdateThis release updates the original v1.12.0 with revised trade accounting, more consistent signal scoring, a detailed model-trade dashboard, and structured alerts. Version 1.13.1 also addresses issues identified during the follow-up code review.
📊 NEW SATS MODEL TRADE PANEL
The panel appears in the bottom-left corner by default and brings the current model trade into one view:
• Entry price, stop-loss, and three take-profit levels.
• Initial risk in price units, ticks, and percent.
• Remaining position size and partial-exit status.
• Realized, unrealized, and combined results in R.
• Distance to the stop and next target.
• Trade age and bars remaining before timeout.
• Entry and exit timestamps in the exchange time zone.
• Signal context, score, and TQI snapshot.
• Reasons for rejected trade plans.
• Warnings about data readiness, unavailable volume, unsuitable pivots, and frequent trend changes.
The panel also displays an estimated reward-to-risk ratio to TP2 for a potential entry at the current price. Once TP2 has been filled, this calculation is disabled because re-entry is not part of the model.
⚙️ REVISED TRADE ACCOUNTING
• Existing positions are processed before new entries.
• Partial exits remain recorded when the remaining position closes.
• Stop gaps use the less favorable opening or stop price, plus configured slippage.
• Losses can exceed −1R when the modeled execution requires it.
• Configurable commission applies to the entry and each exited portion.
• Market entries and exits include configured slippage; take-profit fills are modeled at their target levels.
• Stop and target prices follow the instrument’s tick size.
• Displayed R values reflect the rounded levels.
• Invalid or excessively small risk plans are rejected with an explanation.
If a candle touches both a stop and a target and the intrabar sequence is unknown, the model gives priority to the stop.
Commission and slippage default to zero. Configure them to match your execution assumptions.
🛠️ FOLLOW-UP FIXES IN v1.13.1
• Protected active trades from being overwritten by a new signal.
• Separated entry readiness from active-position management: temporary data unavailability blocks new entries while existing trades continue to follow their exit rules.
• Added rejection of entries whose stop is already reached or breached at the signal close after slippage is applied.
• Improved JSON escaping for carriage returns and tabs.
• Added validation for Alert instance ID.
• Prevented the late-entry calculation from reappearing after TP2 has already been filled, even if price retraces.
🧮 SIGNAL SCORING & DATA HANDLING
• Momentum scoring now follows the signal direction.
• ST Break measures the current depth of the breakout.
• Missing, stale, or incorrectly positioned pivots no longer contribute structural points.
• Scores are normalized using the factors that are enabled and available.
• Disabled factors no longer contribute automatic points.
• Warm-up checks account for dependent calculation windows and source-data continuity.
• Volume availability is evaluated over the current calculation window.
• The TQI activity factor can explicitly use ATR regime or volume activity.
• Invalid weight combinations and conflicting parameter ranges produce clearer settings errors.
These changes can alter historical signals and grades compared with v1.12.0. Score and TQI values are analytical measures, not probabilities of a profitable trade.
📉 STATISTICS & AUTO-CALIBRATION
• Window drawdown is measured from the peak of cumulative closed-trade results.
• Break-even trades interrupt both winning and losing streaks.
• The dashboard makes the actual sample size and “all signals” scope clearer.
• Auto-calibration uses separate groups of completed trades associated with their Q settings.
• Q respects its configured bounds and reverses search direction at a boundary.
• Calibration status includes the reason for the latest adjustment and the number of results in its sample.
Auto-calibration remains experimental and is disabled by default.
🔔 STRUCTURED ALERTS — WEBHOOK v2
Combined JSON alerts use the sats.events.v2 schema with version v1.13.1.
• Events are grouped into one ordered payload per confirmed bar.
• Existing-position exits precede a new entry.
• Trade and event IDs support tracking and duplicate detection.
• Payloads include model fill prices, exit fractions, remaining size, plan levels, and cumulative realized net R.
• Missing numeric values are represented as null.
• The master alert switch controls both combined alerts and individual alert conditions.
⚠️ Integration notes:
• Webhook v2 replaces the older single-action format. Existing receivers must support the new schema.
• trade_closed is an informational summary, not an additional close order.
• fill_price represents a modeled execution, not a confirmed broker fill.
• Alert instance ID must contain 1–64 ASCII letters, digits, underscores, dots, or hyphens.
• Use distinct IDs for different active settings profiles and deduplicate events by event_id.
• Recreate TradingView alerts after updating the script so they use the new version.
📌 MODEL SCOPE
SATS displays a modeled position, not your broker account position. Unrealized results exclude future exit fees. Candle-based calculations cannot reconstruct the actual intrabar execution sequence.
This update improves calculation consistency, trade-state handling, and visibility. It does not establish higher profitability or predictive accuracy.
סקריפט קוד פתוח
ברוח האמיתית של TradingView, יוצר הסקריפט הזה הפך אותו לקוד פתוח, כך שסוחרים יוכלו לעיין בו ולאמת את פעולתו. כל הכבוד למחבר! אמנם ניתן להשתמש בו בחינם, אך זכור כי פרסום חוזר של הקוד כפוף ל־כללי הבית שלנו.

10 years in trading. For all inquiries, contact me on my Telegram channel: t.me/WillyAlgoTrader or Instagram: @willytraderbtc
כתב ויתור
המידע והפרסומים אינם מיועדים להיות, ואינם מהווים, ייעוץ או המלצה פיננסית, השקעתית, מסחרית או מכל סוג אחר המסופקת או מאושרת על ידי TradingView. קרא עוד ב־תנאי השימוש.
סקריפט קוד פתוח
ברוח האמיתית של TradingView, יוצר הסקריפט הזה הפך אותו לקוד פתוח, כך שסוחרים יוכלו לעיין בו ולאמת את פעולתו. כל הכבוד למחבר! אמנם ניתן להשתמש בו בחינם, אך זכור כי פרסום חוזר של הקוד כפוף ל־כללי הבית שלנו.
10 years in trading. For all inquiries, contact me on my Telegram channel: t.me/WillyAlgoTrader or Instagram: @willytraderbtc
כתב ויתור
המידע והפרסומים אינם מיועדים להיות, ואינם מהווים, ייעוץ או המלצה פיננסית, השקעתית, מסחרית או מכל סוג אחר המסופקת או מאושרת על ידי TradingView. קרא עוד ב־תנאי השימוש.