[HuD] Yearly High Low
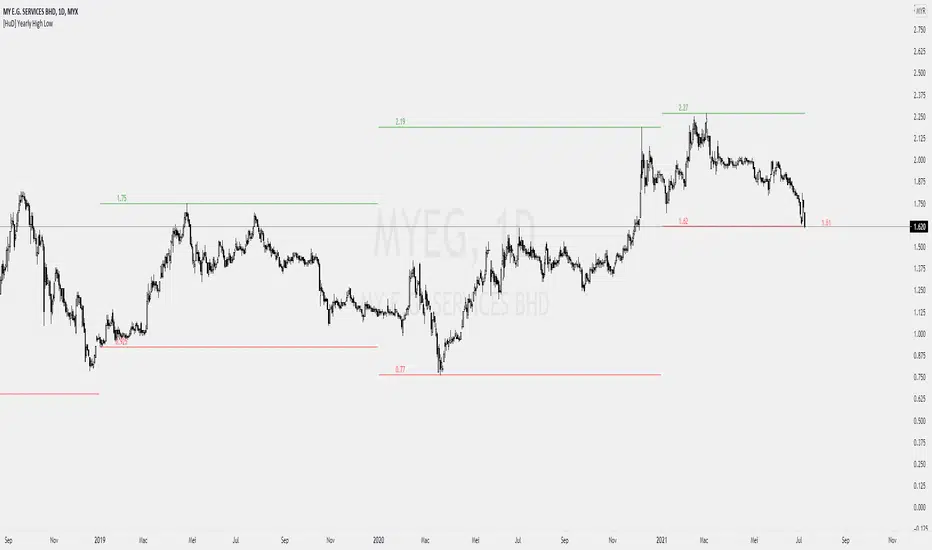
1. Indicator will display highest and lowest price level within yearly period.
- Highest Yearly Price = green line
- Lowest Yearly Price = red line
2. User also has an option to display Monthly high and low level.
- Monthly Highest Price = Blue Line
- Monthly Lowest Price = Orange Line
- Highest Yearly Price = green line
- Lowest Yearly Price = red line
2. User also has an option to display Monthly high and low level.
- Monthly Highest Price = Blue Line
- Monthly Lowest Price = Orange Line

כתב ויתור
המידע והפרסומים אינם מיועדים להיות, ואינם מהווים, ייעוץ או המלצה פיננסית, השקעתית, מסחרית או מכל סוג אחר המסופקת או מאושרת על ידי TradingView. קרא עוד ב־תנאי השימוש.
כתב ויתור
המידע והפרסומים אינם מיועדים להיות, ואינם מהווים, ייעוץ או המלצה פיננסית, השקעתית, מסחרית או מכל סוג אחר המסופקת או מאושרת על ידי TradingView. קרא עוד ב־תנאי השימוש.