Supreme Buy/Sell Signal Indicator V2 by chaitu50c
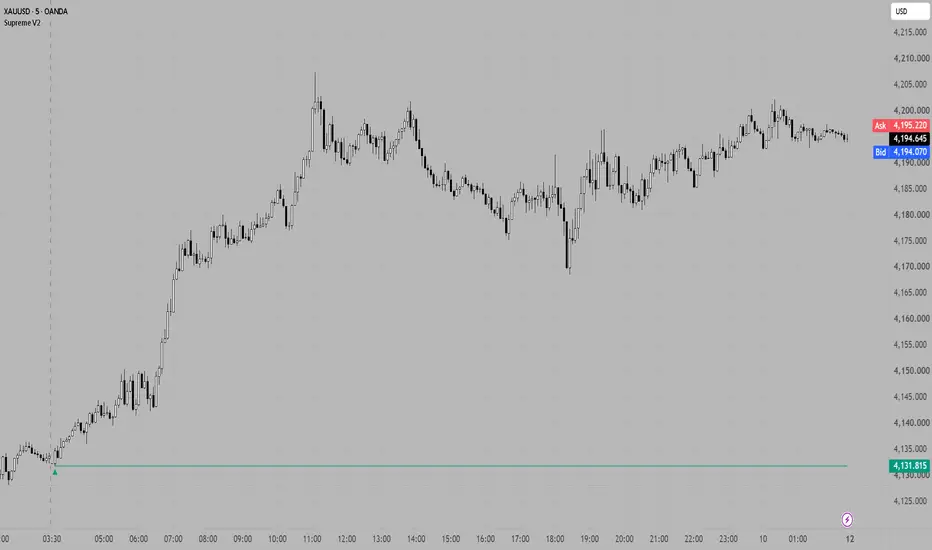
The Supreme Buy/Sell Signal Indicator V2, a complete and visual price-action tool designed to help you identify potential market trends and manage your trades effortlessly right on the chart. At its core, this indicator analyzes the flow of consecutive candles and momentum breakouts to generate clear buy and sell signals. Instead of cluttering your screen with confusing data, it prints intuitive upward and downward triangles exactly where the momentum shifts, making it very easy to read at a quick glance.
One of the standout features of this script is its dual-mode functionality, allowing you to adapt to different trading styles simply by toggling a single setting. By default, the indicator runs in its standard trend-following mode. In this mode, it focuses on catching more established, deeper moves while using a strict stop-loss blocking system. It will draw a dynamic stop-loss line based on the recent highs or lows. To keep the chart clean, it only colors the specific candle that breaks this stop-loss line, alerting you that the trend might be over and preventing the chart from printing repetitive, messy signals during choppy markets.
For traders who prefer a more active approach, turning on "Scalping Mode" completely transforms the visual experience. When Scalping Mode is enabled, the indicator shifts its focus to quick entries and colors the entire trend to help you visually hold onto your positions. It also introduces a "Static Baseline Stop Loss" feature. If you are in a trade and the price starts to move backward against you, crossing this baseline, the candles will automatically turn gray. This acts as an immediate visual warning that you are in a drawdown phase, helping you make quick decisions before a small pullback turns into a large loss.
Furthermore, Scalping Mode activates the built-in Target System. The moment a new signal fires, the indicator automatically draws visually pleasing, transparent target boxes directly on your chart. It calculates your stop-loss and plots three distinct Take Profit (TP) levels based on customizable Risk/Reward ratios. These targets come with detailed, auto-updating text labels that show exactly where your entry, stop-loss, and profit targets are. The labels even track your live trade progress, showing a checkmark when a target is hit and displaying the real-time "heat" or drawdown on your stop-loss. This means you can plan and track your entire trade management visually without ever having to pull out a calculator or drawing tools.
When it comes to choosing the right timeframe, this indicator is highly versatile but performs best in the 1-minute to 15-minute range depending on the market conditions. If you are trading an instrument with very high volatility, it is highly recommended to use the 5-minute timeframe to filter out the aggressive noise and avoid false signals. On the other hand, if you are trading an instrument that is less volatile or moving slowly, dropping down to the 1-minute timeframe will allow you to catch quicker, more precise entries before the larger move happens.
Disclaimer
Please note that the Supreme Buy/Sell Signal Indicator V2 is provided strictly for educational and informational purposes only. It does not constitute financial advice, nor is it a recommendation to buy or sell any asset. Trading in the financial markets carries a high level of risk and may not be suitable for all investors. Past performance of any trading system or methodology is not necessarily indicative of future results. Always conduct your own research, use proper risk management, and consult with a certified financial advisor before making any trading decisions.
One of the standout features of this script is its dual-mode functionality, allowing you to adapt to different trading styles simply by toggling a single setting. By default, the indicator runs in its standard trend-following mode. In this mode, it focuses on catching more established, deeper moves while using a strict stop-loss blocking system. It will draw a dynamic stop-loss line based on the recent highs or lows. To keep the chart clean, it only colors the specific candle that breaks this stop-loss line, alerting you that the trend might be over and preventing the chart from printing repetitive, messy signals during choppy markets.
For traders who prefer a more active approach, turning on "Scalping Mode" completely transforms the visual experience. When Scalping Mode is enabled, the indicator shifts its focus to quick entries and colors the entire trend to help you visually hold onto your positions. It also introduces a "Static Baseline Stop Loss" feature. If you are in a trade and the price starts to move backward against you, crossing this baseline, the candles will automatically turn gray. This acts as an immediate visual warning that you are in a drawdown phase, helping you make quick decisions before a small pullback turns into a large loss.
Furthermore, Scalping Mode activates the built-in Target System. The moment a new signal fires, the indicator automatically draws visually pleasing, transparent target boxes directly on your chart. It calculates your stop-loss and plots three distinct Take Profit (TP) levels based on customizable Risk/Reward ratios. These targets come with detailed, auto-updating text labels that show exactly where your entry, stop-loss, and profit targets are. The labels even track your live trade progress, showing a checkmark when a target is hit and displaying the real-time "heat" or drawdown on your stop-loss. This means you can plan and track your entire trade management visually without ever having to pull out a calculator or drawing tools.
When it comes to choosing the right timeframe, this indicator is highly versatile but performs best in the 1-minute to 15-minute range depending on the market conditions. If you are trading an instrument with very high volatility, it is highly recommended to use the 5-minute timeframe to filter out the aggressive noise and avoid false signals. On the other hand, if you are trading an instrument that is less volatile or moving slowly, dropping down to the 1-minute timeframe will allow you to catch quicker, more precise entries before the larger move happens.
Disclaimer
Please note that the Supreme Buy/Sell Signal Indicator V2 is provided strictly for educational and informational purposes only. It does not constitute financial advice, nor is it a recommendation to buy or sell any asset. Trading in the financial markets carries a high level of risk and may not be suitable for all investors. Past performance of any trading system or methodology is not necessarily indicative of future results. Always conduct your own research, use proper risk management, and consult with a certified financial advisor before making any trading decisions.

כתב ויתור
המידע והפרסומים אינם מיועדים להיות, ואינם מהווים, ייעוץ או המלצה פיננסית, השקעתית, מסחרית או מכל סוג אחר המסופקת או מאושרת על ידי TradingView. קרא עוד ב־תנאי השימוש.
כתב ויתור
המידע והפרסומים אינם מיועדים להיות, ואינם מהווים, ייעוץ או המלצה פיננסית, השקעתית, מסחרית או מכל סוג אחר המסופקת או מאושרת על ידי TradingView. קרא עוד ב־תנאי השימוש.