Market Leadership Structure 3D [NeuralMarkets]
OVERVIEW
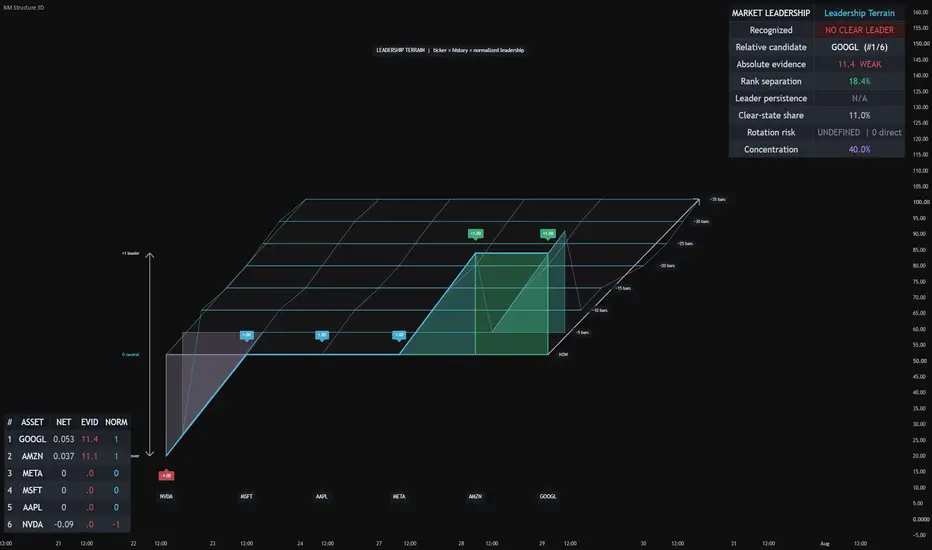
Market Leadership Structure 3D compares six assets to show who is driving the group, who is following, and whether leadership is persistent or rotating.
It separates relative rank from absolute evidence. The top-ranked asset is always shown as the relative candidate, but the script reports NO CLEAR LEADER unless that candidate has sufficient evidence, separation from the runner-up, and at least one qualified outgoing relationship.
The indicator provides three views:
• Summary
• Leadership Terrain
• Parameter Stability
HOW IT WORKS
For every asset pair, the model compares both possible lead-lag directions.
Directional evidence blends the strongest positive lagged correlation with the average positive correlation across the tested lags.
Directional advantage A → B = Evidence A → B − Evidence B → A
An edge is retained only when it passes Minimum Forward Evidence and exceeds the reverse direction by Minimum Directional Asymmetry.
Qualified edges form a directed network using NeuralMarketsNetworkToolkit:
Net influence = Outbound influence − Inbound influence
The asset with the highest smoothed net influence receives rank #1. Recognition requires separate absolute-evidence and rank-separation thresholds, so being ranked first does not automatically imply meaningful leadership.
READING THE SUMMARY
Recognized — The accepted leader or NO CLEAR LEADER.
Relative candidate — The asset currently ranked #1, even when evidence is insufficient for recognition.
Absolute evidence — Strength and coverage of the candidate’s qualified outgoing relationships. It is not min-maxed and does not force the strongest asset to score 100.
Rank separation — Normalized gap between the top two assets. A small gap means leadership is closely contested.
Leader persistence — Share of the history window occupied by the current recognized leader. No-clear-leader bars remain separate states.
Clear-state share — Percentage of the history window in which any clear leader existed.
Rotation risk — LOW, MEDIUM, HIGH, or UNDEFINED when no leader is recognized.
Concentration — Whether directional influence is concentrated or broadly distributed.
The optional ranking table shows all six assets with net influence, absolute evidence, and normalized leadership.
LEADERSHIP TERRAIN

The waterfall mesh displays all six assets through recent history:
• X-axis: ticker
• Depth: historical slices from NOW toward older bars
• Height: normalized leadership, approximately −1 to +1
Above zero indicates more outbound than inbound influence. Below zero indicates follower behavior. Each historical ridge is drawn as a colored curtain from the zero plane, while rails connect each ticker through time. Older slices fade to keep the current structure prominent.
Look for:
• A sustained elevated ridge — persistent leadership
• A ridge rising toward NOW — strengthening leadership
• A ridge falling toward zero — fading leadership
• Two similar current peaks — close competition
• Rapidly alternating peaks — unstable rotation
• A flat surface near zero — weak directional structure
A leader marker appears only when the recognition requirements are satisfied.
PARAMETER STABILITY

This view rebuilds the network across a 6 × 6 grid:
• X-axis: relationship lookback
• Depth: maximum lag from 1 to 6 bars
• Height and color: robustness
Robustness combines 50% absolute evidence, 30% rank separation, and 20% agreement with the currently recognized leader. Cells without qualified outgoing coverage score zero.
Broad elevated regions indicate that leadership survives several parameter choices. An isolated peak suggests that the result is parameter-sensitive.
HOW TO USE IT
1. Choose a coherent universe
Use a preset or select six related assets. Interpretation is clearest when the group represents one theme, such as cross-asset ETFs, US sectors, or mega-cap stocks.
2. Check the recognized state
If the script reports NO CLEAR LEADER, do not treat the relative candidate as confirmed leadership.
3. Confirm evidence and separation
Prefer cases where the candidate has both meaningful absolute evidence and adequate distance from the runner-up.
4. Check persistence and rotation
Established leadership is generally more credible than a one-bar rank change. Falling persistence, a young leader age, or HIGH rotation risk signals a less settled structure.
5. Inspect Leadership Terrain
Check whether the leader remains above zero through history and whether its ridge strengthens toward NOW. Watch for challengers rising beneath it.
6. Inspect Parameter Stability
Prefer a broad plateau over one sharp peak. If leadership disappears after a small lookback or lag change, it is fragile.
7. Use alerts to trigger review
Alerts identify structural transitions. Combine them with price action, trend, liquidity, and risk management rather than treating them as automatic entries.
UNIVERSE PRESETS

Cross-Asset — SPY, QQQ, IWM, HYG, TLT, DBC

US Sectors — XLK, XLF, XLY, XLI, XLE, XLV

Mega-Cap — NVDA, MSFT, AAPL, META, AMZN, GOOGL
Custom — Six user-selected symbols
IMPORTANT SETTINGS
Relationship Lookback — Estimation window. Shorter values react faster but are noisier.
Maximum Lead Lag — Earlier bars tested. One lag equals one chart bar.
Rank Smoothing — Reduces rank churn at the cost of slower response.
Leadership History — Window used for persistence and rotation statistics.
Minimum Forward Evidence — Minimum blended relationship required for an edge.
Minimum Directional Asymmetry — Required advantage over the reverse direction.
Minimum Absolute Evidence / Rank Separation — Requirements for recognizing a clear leader.
Terrain spacing, skew, separation, and height settings change only the drawing—not the model.
KEY DEFAULTS
Relationship Lookback: 80
Maximum Lead Lag: 5
Directional Weight Power: 1.25
Rank Smoothing: 3
Leadership History: 100
Minimum Forward Evidence: 0.18
Minimum Directional Asymmetry: 0.02
Minimum Absolute Evidence: 15
Minimum Rank Separation: 5%
Terrain History: 8 slices spaced 5 bars apart
ALERTS
Clear Leader Rotation — Fires only on a direct transition between two different recognized leaders. A transition through NO CLEAR LEADER is not counted.
High Rotation Risk — Fires when risk changes to HIGH while a clear leader exists.
Clear Leader Established — Fires when the candidate first satisfies the recognition requirements.
Clear Leader Lost — Fires when the recognized leader no longer satisfies them.
LIMITATIONS
This indicator is descriptive market-structure research, not a calibrated probability or a claim of predictive alpha.
Lagged correlation and directional asymmetry do not establish causality. The model focuses on positive lead-lag relationships and does not explicitly represent inverse edges.
Parameter Stability measures current in-sample robustness, not out-of-sample forecasting performance. The terrain is a 2D perspective projection whose appearance depends on chart zoom.
Results depend on timeframe, available history, liquidity, and alignment between trading sessions. All six symbols should have sufficient data.
Use rank to identify the relative candidate. Use evidence, separation, persistence, terrain, and parameter stability to decide how seriously that ranking should be taken.
Market Leadership Structure 3D compares six assets to show who is driving the group, who is following, and whether leadership is persistent or rotating.
It separates relative rank from absolute evidence. The top-ranked asset is always shown as the relative candidate, but the script reports NO CLEAR LEADER unless that candidate has sufficient evidence, separation from the runner-up, and at least one qualified outgoing relationship.
The indicator provides three views:
• Summary
• Leadership Terrain
• Parameter Stability
HOW IT WORKS
For every asset pair, the model compares both possible lead-lag directions.
Directional evidence blends the strongest positive lagged correlation with the average positive correlation across the tested lags.
Directional advantage A → B = Evidence A → B − Evidence B → A
An edge is retained only when it passes Minimum Forward Evidence and exceeds the reverse direction by Minimum Directional Asymmetry.
Qualified edges form a directed network using NeuralMarketsNetworkToolkit:
Net influence = Outbound influence − Inbound influence
The asset with the highest smoothed net influence receives rank #1. Recognition requires separate absolute-evidence and rank-separation thresholds, so being ranked first does not automatically imply meaningful leadership.
READING THE SUMMARY
Recognized — The accepted leader or NO CLEAR LEADER.
Relative candidate — The asset currently ranked #1, even when evidence is insufficient for recognition.
Absolute evidence — Strength and coverage of the candidate’s qualified outgoing relationships. It is not min-maxed and does not force the strongest asset to score 100.
Rank separation — Normalized gap between the top two assets. A small gap means leadership is closely contested.
Leader persistence — Share of the history window occupied by the current recognized leader. No-clear-leader bars remain separate states.
Clear-state share — Percentage of the history window in which any clear leader existed.
Rotation risk — LOW, MEDIUM, HIGH, or UNDEFINED when no leader is recognized.
Concentration — Whether directional influence is concentrated or broadly distributed.
The optional ranking table shows all six assets with net influence, absolute evidence, and normalized leadership.
LEADERSHIP TERRAIN
The waterfall mesh displays all six assets through recent history:
• X-axis: ticker
• Depth: historical slices from NOW toward older bars
• Height: normalized leadership, approximately −1 to +1
Above zero indicates more outbound than inbound influence. Below zero indicates follower behavior. Each historical ridge is drawn as a colored curtain from the zero plane, while rails connect each ticker through time. Older slices fade to keep the current structure prominent.
Look for:
• A sustained elevated ridge — persistent leadership
• A ridge rising toward NOW — strengthening leadership
• A ridge falling toward zero — fading leadership
• Two similar current peaks — close competition
• Rapidly alternating peaks — unstable rotation
• A flat surface near zero — weak directional structure
A leader marker appears only when the recognition requirements are satisfied.
PARAMETER STABILITY
This view rebuilds the network across a 6 × 6 grid:
• X-axis: relationship lookback
• Depth: maximum lag from 1 to 6 bars
• Height and color: robustness
Robustness combines 50% absolute evidence, 30% rank separation, and 20% agreement with the currently recognized leader. Cells without qualified outgoing coverage score zero.
Broad elevated regions indicate that leadership survives several parameter choices. An isolated peak suggests that the result is parameter-sensitive.
HOW TO USE IT
1. Choose a coherent universe
Use a preset or select six related assets. Interpretation is clearest when the group represents one theme, such as cross-asset ETFs, US sectors, or mega-cap stocks.
2. Check the recognized state
If the script reports NO CLEAR LEADER, do not treat the relative candidate as confirmed leadership.
3. Confirm evidence and separation
Prefer cases where the candidate has both meaningful absolute evidence and adequate distance from the runner-up.
4. Check persistence and rotation
Established leadership is generally more credible than a one-bar rank change. Falling persistence, a young leader age, or HIGH rotation risk signals a less settled structure.
5. Inspect Leadership Terrain
Check whether the leader remains above zero through history and whether its ridge strengthens toward NOW. Watch for challengers rising beneath it.
6. Inspect Parameter Stability
Prefer a broad plateau over one sharp peak. If leadership disappears after a small lookback or lag change, it is fragile.
7. Use alerts to trigger review
Alerts identify structural transitions. Combine them with price action, trend, liquidity, and risk management rather than treating them as automatic entries.
UNIVERSE PRESETS
Cross-Asset — SPY, QQQ, IWM, HYG, TLT, DBC
US Sectors — XLK, XLF, XLY, XLI, XLE, XLV
Mega-Cap — NVDA, MSFT, AAPL, META, AMZN, GOOGL
Custom — Six user-selected symbols
IMPORTANT SETTINGS
Relationship Lookback — Estimation window. Shorter values react faster but are noisier.
Maximum Lead Lag — Earlier bars tested. One lag equals one chart bar.
Rank Smoothing — Reduces rank churn at the cost of slower response.
Leadership History — Window used for persistence and rotation statistics.
Minimum Forward Evidence — Minimum blended relationship required for an edge.
Minimum Directional Asymmetry — Required advantage over the reverse direction.
Minimum Absolute Evidence / Rank Separation — Requirements for recognizing a clear leader.
Terrain spacing, skew, separation, and height settings change only the drawing—not the model.
KEY DEFAULTS
Relationship Lookback: 80
Maximum Lead Lag: 5
Directional Weight Power: 1.25
Rank Smoothing: 3
Leadership History: 100
Minimum Forward Evidence: 0.18
Minimum Directional Asymmetry: 0.02
Minimum Absolute Evidence: 15
Minimum Rank Separation: 5%
Terrain History: 8 slices spaced 5 bars apart
ALERTS
Clear Leader Rotation — Fires only on a direct transition between two different recognized leaders. A transition through NO CLEAR LEADER is not counted.
High Rotation Risk — Fires when risk changes to HIGH while a clear leader exists.
Clear Leader Established — Fires when the candidate first satisfies the recognition requirements.
Clear Leader Lost — Fires when the recognized leader no longer satisfies them.
LIMITATIONS
This indicator is descriptive market-structure research, not a calibrated probability or a claim of predictive alpha.
Lagged correlation and directional asymmetry do not establish causality. The model focuses on positive lead-lag relationships and does not explicitly represent inverse edges.
Parameter Stability measures current in-sample robustness, not out-of-sample forecasting performance. The terrain is a 2D perspective projection whose appearance depends on chart zoom.
Results depend on timeframe, available history, liquidity, and alignment between trading sessions. All six symbols should have sufficient data.
Use rank to identify the relative candidate. Use evidence, separation, persistence, terrain, and parameter stability to decide how seriously that ranking should be taken.

Machine-learning market structure & forecast levels. Publishing levels before the markets move. Educational only.
כתב ויתור
המידע והפרסומים אינם מיועדים להיות, ואינם מהווים, ייעוץ או המלצה פיננסית, השקעתית, מסחרית או מכל סוג אחר המסופקת או מאושרת על ידי TradingView. קרא עוד ב־תנאי השימוש.
Machine-learning market structure & forecast levels. Publishing levels before the markets move. Educational only.
כתב ויתור
המידע והפרסומים אינם מיועדים להיות, ואינם מהווים, ייעוץ או המלצה פיננסית, השקעתית, מסחרית או מכל סוג אחר המסופקת או מאושרת על ידי TradingView. קרא עוד ב־תנאי השימוש.