EMMA SETUPS | Institutional Flow Pro
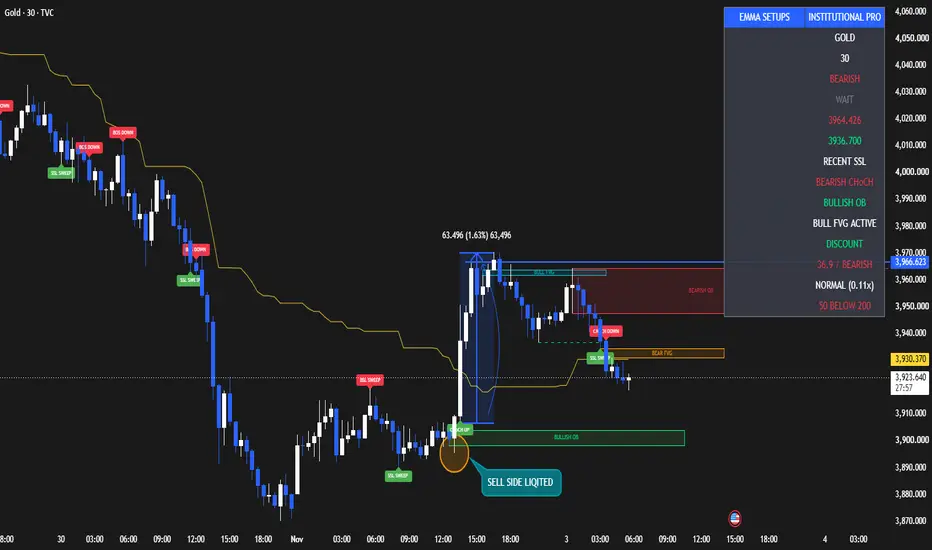
EMMA SETUPS – Institutional Flow Pro
Advanced Smart Money Concepts | Liquidity Detection | Market Structure | Institutional Analysis
Developed by EMMA SETUPS
EMMA SETUPS – Institutional Flow Pro is an advanced Smart Money Concepts (SMC) indicator designed to analyze market structure, liquidity movements, potential institutional trading zones, and price action confirmation.
This indicator combines multiple technical analysis tools into one integrated system, helping traders identify potential market reversals, trend continuation opportunities, liquidity sweeps, and important price areas.
It includes Buy-Side Liquidity (BSL), Sell-Side Liquidity (SSL), Liquidity Sweep Detection, Break of Structure (BOS), Change of Character (CHoCH), Order Blocks, Fair Value Gaps (FVG), Premium & Discount Zones, EMA Trend Analysis, RSI Momentum, Volume Confirmation, and a professional market dashboard.

1. BUY-SIDE LIQUIDITY (BSL)
Buy-Side Liquidity represents potential stop-loss and pending buy-order concentrations above previous swing highs.
**How it works:**
- Detects confirmed swing highs.
- Automatically marks potential liquidity levels.
- Displays liquidity using red dashed lines.
- Monitors price movements around previous highs.
**How to use it:**
Monitor price when it approaches previous swing highs. A move above the level followed by a close below it may indicate a potential Buy-Side Liquidity Sweep.

2. SELL-SIDE LIQUIDITY (SSL)
Sell-Side Liquidity represents potential stop-loss and pending sell-order concentrations below previous swing lows.
**How it works:**
- Detects confirmed swing lows.
- Automatically marks potential liquidity levels.
- Displays liquidity using green dashed lines.
- Monitors price movements around previous lows.
**How to use it:**
Watch for price moving below a previous swing low and then closing back above it. This can indicate a potential Sell-Side Liquidity Sweep.
3. LIQUIDITY SWEEP DETECTOR
The Liquidity Sweep module identifies situations where price moves beyond a previous swing level but closes back inside that level.
**Bullish Liquidity Sweep:**
Price moves below a previous swing low and closes above it.
**Bearish Liquidity Sweep:**
Price moves above a previous swing high and closes below it.
The indicator marks these events with SSL SWEEP and BSL SWEEP labels.
These movements can help traders recognize potential liquidity grabs and possible reversal areas.
## 4. MARKET STRUCTURE – BOS & CHoCH
The Market Structure module identifies potential trend continuation and changes in market direction.
**BOS – Break of Structure**
- Bullish BOS: Price breaks above the previous confirmed swing high.
- Bearish BOS: Price breaks below the previous confirmed swing low.
**CHoCH – Change of Character**
- Bullish CHoCH: Price breaks above a swing high while the previous structure direction was bearish.
- Bearish CHoCH: Price breaks below a swing low while the previous structure direction was bullish.
These signals help traders evaluate market structure and directional changes.
## 5. ORDER BLOCK DETECTION
The indicator identifies simplified bullish and bearish Order Block zones.
**Bullish Order Block:**
The last bearish candle found within the selected search range before a bullish structure break.
**Bearish Order Block:**
The last bullish candle found within the selected search range before a bearish structure break.
**How to use it:**
- Monitor bullish Order Blocks as potential buying areas.
- Monitor bearish Order Blocks as potential selling areas.
- Look for price reaction and additional confirmation when price revisits these zones.
## 6. FAIR VALUE GAP (FVG)
Fair Value Gaps identify three-candle price imbalances.
**Bullish FVG:**
The current candle's low is above the high of the candle two bars earlier.
**Bearish FVG:**
The current candle's high is below the low of the candle two bars earlier.
**How to use it:**
Traders can monitor these gaps as potential areas of price retracement, imbalance mitigation, and market reaction.
Bullish FVGs are displayed in aqua, while bearish FVGs are displayed in orange.
## 7. PREMIUM & DISCOUNT ZONES
This module calculates the midpoint of the highest high and lowest low over the selected lookback period.
**Premium Zone:**
Price trading above the midpoint.
**Discount Zone:**
Price trading below the midpoint.
**Equilibrium:**
The midpoint between the selected range's high and low.
**How to use it:**
- Discount areas can help identify potential buying locations.
- Premium areas can help identify potential selling locations.
- Equilibrium provides a reference for the middle of the selected price range.
## 8. EMA TREND FILTER
The indicator uses two Exponential Moving Averages:
- EMA 50 – Fast Trend.
- EMA 200 – Slow Trend.
**Bullish Trend:** EMA 50 is above EMA 200.
**Bearish Trend:** EMA 50 is below EMA 200.
The EMA filter helps traders evaluate the broader trend direction and can be enabled or disabled through the settings.
## 9. RSI MOMENTUM ANALYSIS
The Relative Strength Index evaluates market momentum.
**Bullish Momentum:** RSI above 50.
**Bearish Momentum:** RSI below 50.
RSI confirmation is included in the BUY and SELL signal conditions to help filter potential trading opportunities.
## 10. VOLUME STRENGTH ANALYSIS
The volume module compares current candle volume with its moving average.
**How it works:**
- Calculates average volume using the selected period.
- Compares current volume against the average.
- Identifies HIGH volume when the configured multiplier is reached.
The default strong-volume multiplier is 1.2.
When the volume filter is enabled, the signal requires sufficient volume confirmation.
## 11. INSTITUTIONAL BUY & SELL SIGNALS
The indicator combines liquidity sweeps, market structure, candle confirmation, RSI, EMA trend and volume analysis.
**BUY SIGNAL CONDITIONS**
1. A Sell-Side Liquidity Sweep occurs.
2. A bullish BOS or CHoCH is confirmed within the configured sweep-validity window.
3. A bullish candle confirmation appears on the structure-break candle.
4. RSI is above 50.
5. EMA trend is bullish, when the EMA filter is enabled.
6. Volume confirmation is satisfied, when the volume filter is enabled.
**SELL SIGNAL CONDITIONS**
1. A Buy-Side Liquidity Sweep occurs.
2. A bearish BOS or CHoCH is confirmed within the configured sweep-validity window.
3. A bearish candle confirmation appears on the structure-break candle.
4. RSI is below 50.
5. EMA trend is bearish, when the EMA filter is enabled.
6. Volume confirmation is satisfied, when the volume filter is enabled.
## 13. TRADINGVIEW ALERT SYSTEM
The indicator includes alert conditions for:
- Institutional BUY Signal.
- Institutional SELL Signal.
- Buy-Side Liquidity Sweep.
- Sell-Side Liquidity Sweep.
- Bullish BOS / CHoCH.
- Bearish BOS / CHoCH.
- Bullish Fair Value Gap.
- Bearish Fair Value Gap.
Traders can configure these alerts directly through TradingView.
---
## HOW TO USE EMMA INSTITUTIONAL FLOW PRO
**Bullish Trading Approach**
1. Identify a Sell-Side Liquidity Sweep.
2. Wait for bullish market structure confirmation.
3. Check the bullish Order Block and FVG.
4. Confirm RSI and EMA direction.
5. Evaluate volume strength.
6. Look for the BUY signal and plan risk management.
**Bearish Trading Approach**
1. Identify a Buy-Side Liquidity Sweep.
2. Wait for bearish market structure confirmation.
3. Check the bearish Order Block and FVG.
4. Confirm RSI and EMA direction.
5. Evaluate volume strength.
6. Look for the SELL signal and plan risk management.
---
RECOMMENDED MARKETS
- XAUUSD – Gold
- EURUSD
- GBPUSD
- USDJPY
- BTCUSD
- ETHUSD
- Major Forex Pairs
- Stock Indices
RECOMMENDED TIMEFRAMES
- 5 Minutes – Short-Term Analysis
- 15 Minutes – Intraday Trading
- 1 Hour – Trend Confirmation
- 4 Hours – Higher-Timeframe Analysis
---
IMPORTANT TECHNICAL NOTES
- Liquidity levels are based on confirmed swing pivots.
- Liquidity sweeps require a wick beyond the swing level and a close back inside.
- BOS and CHoCH are based on confirmed swing breaks.
- Order Blocks use the last opposite-colour candle within the configured search range.
- FVGs are detected using a three-candle price-gap method.
- Premium and Discount are calculated using the selected rolling high-low range.
- The script does not include automatic Order Block mitigation or FVG fill tracking.
- The indicator does not provide automatic Stop Loss or Take Profit calculations.
- Institutional Flow Pro identifies price-action patterns; it does not access actual institutional order-book or bank trading data.
## RISK DISCLAIMER
This indicator is developed for technical analysis and educational purposes. It does not guarantee profitable results or predict future price movements. Always use proper risk management, independent market confirmation, and backtesting before executing live trades.
---
**EMMA SETUPS**
*Follow the Liquidity. Understand the Structure. Identify the Imbalance. Trade with Confirmation.*
Advanced Smart Money Concepts | Liquidity Detection | Market Structure | Institutional Analysis
Developed by EMMA SETUPS
EMMA SETUPS – Institutional Flow Pro is an advanced Smart Money Concepts (SMC) indicator designed to analyze market structure, liquidity movements, potential institutional trading zones, and price action confirmation.
This indicator combines multiple technical analysis tools into one integrated system, helping traders identify potential market reversals, trend continuation opportunities, liquidity sweeps, and important price areas.
It includes Buy-Side Liquidity (BSL), Sell-Side Liquidity (SSL), Liquidity Sweep Detection, Break of Structure (BOS), Change of Character (CHoCH), Order Blocks, Fair Value Gaps (FVG), Premium & Discount Zones, EMA Trend Analysis, RSI Momentum, Volume Confirmation, and a professional market dashboard.
1. BUY-SIDE LIQUIDITY (BSL)
Buy-Side Liquidity represents potential stop-loss and pending buy-order concentrations above previous swing highs.
**How it works:**
- Detects confirmed swing highs.
- Automatically marks potential liquidity levels.
- Displays liquidity using red dashed lines.
- Monitors price movements around previous highs.
**How to use it:**
Monitor price when it approaches previous swing highs. A move above the level followed by a close below it may indicate a potential Buy-Side Liquidity Sweep.
2. SELL-SIDE LIQUIDITY (SSL)
Sell-Side Liquidity represents potential stop-loss and pending sell-order concentrations below previous swing lows.
**How it works:**
- Detects confirmed swing lows.
- Automatically marks potential liquidity levels.
- Displays liquidity using green dashed lines.
- Monitors price movements around previous lows.
**How to use it:**
Watch for price moving below a previous swing low and then closing back above it. This can indicate a potential Sell-Side Liquidity Sweep.
3. LIQUIDITY SWEEP DETECTOR
The Liquidity Sweep module identifies situations where price moves beyond a previous swing level but closes back inside that level.
**Bullish Liquidity Sweep:**
Price moves below a previous swing low and closes above it.
**Bearish Liquidity Sweep:**
Price moves above a previous swing high and closes below it.
The indicator marks these events with SSL SWEEP and BSL SWEEP labels.
These movements can help traders recognize potential liquidity grabs and possible reversal areas.
## 4. MARKET STRUCTURE – BOS & CHoCH
The Market Structure module identifies potential trend continuation and changes in market direction.
**BOS – Break of Structure**
- Bullish BOS: Price breaks above the previous confirmed swing high.
- Bearish BOS: Price breaks below the previous confirmed swing low.
**CHoCH – Change of Character**
- Bullish CHoCH: Price breaks above a swing high while the previous structure direction was bearish.
- Bearish CHoCH: Price breaks below a swing low while the previous structure direction was bullish.
These signals help traders evaluate market structure and directional changes.
## 5. ORDER BLOCK DETECTION
The indicator identifies simplified bullish and bearish Order Block zones.
**Bullish Order Block:**
The last bearish candle found within the selected search range before a bullish structure break.
**Bearish Order Block:**
The last bullish candle found within the selected search range before a bearish structure break.
**How to use it:**
- Monitor bullish Order Blocks as potential buying areas.
- Monitor bearish Order Blocks as potential selling areas.
- Look for price reaction and additional confirmation when price revisits these zones.
## 6. FAIR VALUE GAP (FVG)
Fair Value Gaps identify three-candle price imbalances.
**Bullish FVG:**
The current candle's low is above the high of the candle two bars earlier.
**Bearish FVG:**
The current candle's high is below the low of the candle two bars earlier.
**How to use it:**
Traders can monitor these gaps as potential areas of price retracement, imbalance mitigation, and market reaction.
Bullish FVGs are displayed in aqua, while bearish FVGs are displayed in orange.
## 7. PREMIUM & DISCOUNT ZONES
This module calculates the midpoint of the highest high and lowest low over the selected lookback period.
**Premium Zone:**
Price trading above the midpoint.
**Discount Zone:**
Price trading below the midpoint.
**Equilibrium:**
The midpoint between the selected range's high and low.
**How to use it:**
- Discount areas can help identify potential buying locations.
- Premium areas can help identify potential selling locations.
- Equilibrium provides a reference for the middle of the selected price range.
## 8. EMA TREND FILTER
The indicator uses two Exponential Moving Averages:
- EMA 50 – Fast Trend.
- EMA 200 – Slow Trend.
**Bullish Trend:** EMA 50 is above EMA 200.
**Bearish Trend:** EMA 50 is below EMA 200.
The EMA filter helps traders evaluate the broader trend direction and can be enabled or disabled through the settings.
## 9. RSI MOMENTUM ANALYSIS
The Relative Strength Index evaluates market momentum.
**Bullish Momentum:** RSI above 50.
**Bearish Momentum:** RSI below 50.
RSI confirmation is included in the BUY and SELL signal conditions to help filter potential trading opportunities.
## 10. VOLUME STRENGTH ANALYSIS
The volume module compares current candle volume with its moving average.
**How it works:**
- Calculates average volume using the selected period.
- Compares current volume against the average.
- Identifies HIGH volume when the configured multiplier is reached.
The default strong-volume multiplier is 1.2.
When the volume filter is enabled, the signal requires sufficient volume confirmation.
## 11. INSTITUTIONAL BUY & SELL SIGNALS
The indicator combines liquidity sweeps, market structure, candle confirmation, RSI, EMA trend and volume analysis.
**BUY SIGNAL CONDITIONS**
1. A Sell-Side Liquidity Sweep occurs.
2. A bullish BOS or CHoCH is confirmed within the configured sweep-validity window.
3. A bullish candle confirmation appears on the structure-break candle.
4. RSI is above 50.
5. EMA trend is bullish, when the EMA filter is enabled.
6. Volume confirmation is satisfied, when the volume filter is enabled.
**SELL SIGNAL CONDITIONS**
1. A Buy-Side Liquidity Sweep occurs.
2. A bearish BOS or CHoCH is confirmed within the configured sweep-validity window.
3. A bearish candle confirmation appears on the structure-break candle.
4. RSI is below 50.
5. EMA trend is bearish, when the EMA filter is enabled.
6. Volume confirmation is satisfied, when the volume filter is enabled.
## 13. TRADINGVIEW ALERT SYSTEM
The indicator includes alert conditions for:
- Institutional BUY Signal.
- Institutional SELL Signal.
- Buy-Side Liquidity Sweep.
- Sell-Side Liquidity Sweep.
- Bullish BOS / CHoCH.
- Bearish BOS / CHoCH.
- Bullish Fair Value Gap.
- Bearish Fair Value Gap.
Traders can configure these alerts directly through TradingView.
---
## HOW TO USE EMMA INSTITUTIONAL FLOW PRO
**Bullish Trading Approach**
1. Identify a Sell-Side Liquidity Sweep.
2. Wait for bullish market structure confirmation.
3. Check the bullish Order Block and FVG.
4. Confirm RSI and EMA direction.
5. Evaluate volume strength.
6. Look for the BUY signal and plan risk management.
**Bearish Trading Approach**
1. Identify a Buy-Side Liquidity Sweep.
2. Wait for bearish market structure confirmation.
3. Check the bearish Order Block and FVG.
4. Confirm RSI and EMA direction.
5. Evaluate volume strength.
6. Look for the SELL signal and plan risk management.
---
RECOMMENDED MARKETS
- XAUUSD – Gold
- EURUSD
- GBPUSD
- USDJPY
- BTCUSD
- ETHUSD
- Major Forex Pairs
- Stock Indices
RECOMMENDED TIMEFRAMES
- 5 Minutes – Short-Term Analysis
- 15 Minutes – Intraday Trading
- 1 Hour – Trend Confirmation
- 4 Hours – Higher-Timeframe Analysis
---
IMPORTANT TECHNICAL NOTES
- Liquidity levels are based on confirmed swing pivots.
- Liquidity sweeps require a wick beyond the swing level and a close back inside.
- BOS and CHoCH are based on confirmed swing breaks.
- Order Blocks use the last opposite-colour candle within the configured search range.
- FVGs are detected using a three-candle price-gap method.
- Premium and Discount are calculated using the selected rolling high-low range.
- The script does not include automatic Order Block mitigation or FVG fill tracking.
- The indicator does not provide automatic Stop Loss or Take Profit calculations.
- Institutional Flow Pro identifies price-action patterns; it does not access actual institutional order-book or bank trading data.
## RISK DISCLAIMER
This indicator is developed for technical analysis and educational purposes. It does not guarantee profitable results or predict future price movements. Always use proper risk management, independent market confirmation, and backtesting before executing live trades.
---
**EMMA SETUPS**
*Follow the Liquidity. Understand the Structure. Identify the Imbalance. Trade with Confirmation.*

t.me/+UhZW1s5FLGE0NDc0
we Provide Daily 3/5 Signals on XAUUSD / BTC
Join Our Telegram For More Update
we Provide Daily 3/5 Signals on XAUUSD / BTC
Join Our Telegram For More Update
כתב ויתור
המידע והפרסומים אינם מיועדים להיות, ואינם מהווים, ייעוץ או המלצה פיננסית, השקעתית, מסחרית או מכל סוג אחר המסופקת או מאושרת על ידי TradingView. קרא עוד ב־תנאי השימוש.
t.me/+UhZW1s5FLGE0NDc0
we Provide Daily 3/5 Signals on XAUUSD / BTC
Join Our Telegram For More Update
we Provide Daily 3/5 Signals on XAUUSD / BTC
Join Our Telegram For More Update
כתב ויתור
המידע והפרסומים אינם מיועדים להיות, ואינם מהווים, ייעוץ או המלצה פיננסית, השקעתית, מסחרית או מכל סוג אחר המסופקת או מאושרת על ידי TradingView. קרא עוד ב־תנאי השימוש.