Gaussian Distribution
Gaussian Distribution
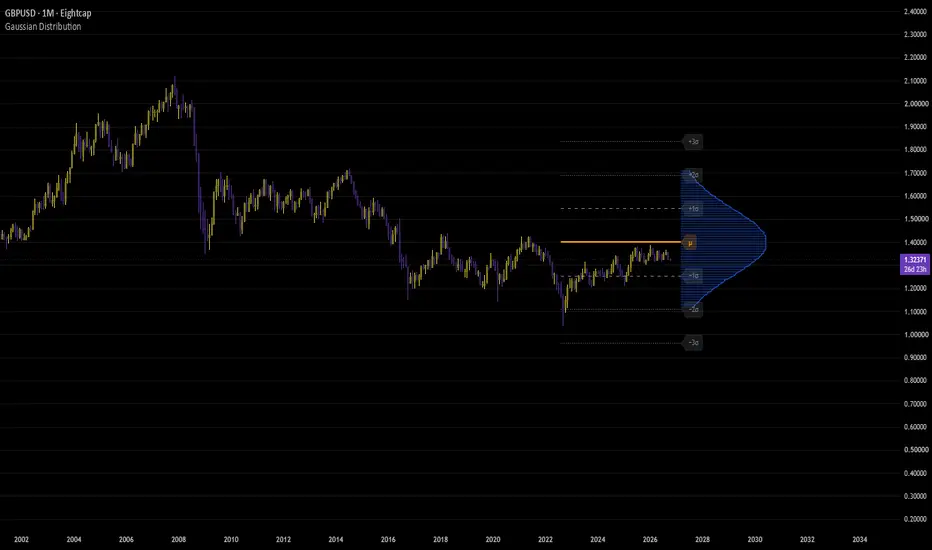
A TradingView indicator that draws a Gaussian (normal) distribution, or "bell curve," of price over a lookback period on the right-hand side of the chart, along with the mean (μ) and ±1σ, ±2σ, and ±3σ reference lines.
What it does
This indicator plots the statistical distribution of price over a configurable lookback window. The shape and width of the bell curve show how tightly price has clustered around its average, and the sigma lines mark ranges that contain roughly 68%, 95%, and 99.7% of a normal distribution.
Practical tips
- Use the sigma lines as a quick read on how "normal" the current move is. A move beyond ±2σ is uncommon; beyond ±3σ is rare and often marks a volatility spike or a potential reversal zone.
- Switch Mean Type between SMA and Median to see how much outliers are distorting the picture.
- Lower the Lookback Length for a faster, more responsive distribution on shorter timeframes; raise it for a calmer, longer-term view.
- Keep Curve Steps around 100 to 120 for a good balance of smoothness and performance. Increase only if the curve looks visibly jagged.
- This is a statistical tool, not a standalone buy/sell signal. Combine it with your usual price action, volume, and trend analysis.
Notes
- The curve and reference lines are recalculated and redrawn on the last bar only, so they represent the current lookback window at the right edge of the chart.
- The percentages described assume price roughly follows a normal distribution, which real markets do only approximately. Treat them as guidelines, not guarantees.
A TradingView indicator that draws a Gaussian (normal) distribution, or "bell curve," of price over a lookback period on the right-hand side of the chart, along with the mean (μ) and ±1σ, ±2σ, and ±3σ reference lines.
What it does
This indicator plots the statistical distribution of price over a configurable lookback window. The shape and width of the bell curve show how tightly price has clustered around its average, and the sigma lines mark ranges that contain roughly 68%, 95%, and 99.7% of a normal distribution.
Practical tips
- Use the sigma lines as a quick read on how "normal" the current move is. A move beyond ±2σ is uncommon; beyond ±3σ is rare and often marks a volatility spike or a potential reversal zone.
- Switch Mean Type between SMA and Median to see how much outliers are distorting the picture.
- Lower the Lookback Length for a faster, more responsive distribution on shorter timeframes; raise it for a calmer, longer-term view.
- Keep Curve Steps around 100 to 120 for a good balance of smoothness and performance. Increase only if the curve looks visibly jagged.
- This is a statistical tool, not a standalone buy/sell signal. Combine it with your usual price action, volume, and trend analysis.
Notes
- The curve and reference lines are recalculated and redrawn on the last bar only, so they represent the current lookback window at the right edge of the chart.
- The percentages described assume price roughly follows a normal distribution, which real markets do only approximately. Treat them as guidelines, not guarantees.

כתב ויתור
המידע והפרסומים אינם מיועדים להיות, ואינם מהווים, ייעוץ או המלצה פיננסית, השקעתית, מסחרית או מכל סוג אחר המסופקת או מאושרת על ידי TradingView. קרא עוד ב־תנאי השימוש.
כתב ויתור
המידע והפרסומים אינם מיועדים להיות, ואינם מהווים, ייעוץ או המלצה פיננסית, השקעתית, מסחרית או מכל סוג אחר המסופקת או מאושרת על ידי TradingView. קרא עוד ב־תנאי השימוש.