Reballo Regime Detector - ER + RelVol + Autocorrelation
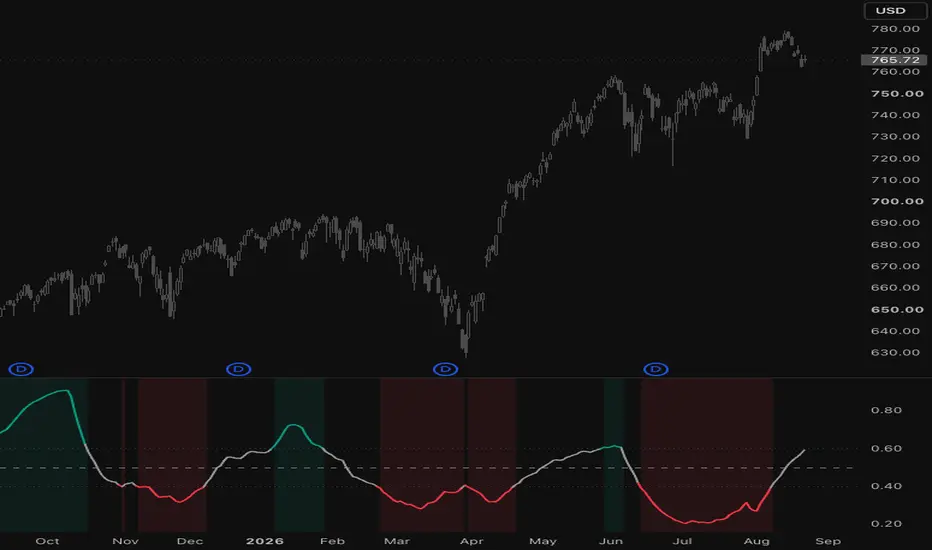
What it measures
Most indicators try to tell you which way price is going. This one asks a different question: is the market in a mood where trend-following works, or one where fading works?
You get one number, the Regime Score, from 0 (ranging / choppy) to 1 (trending). Under the hood it blends three different ways of looking at price, each measured at three speeds (16 / 32 / 64 bars by default).
The three components
1. Efficiency Ratio (Kaufman)
How straight is the path? Net distance ÷ total distance travelled. Move 10 points in 10 points of wiggle: score 1.0. Wander 50 points to end up 10 higher: score 0.2. High = directional, low = chop.
2. Relative Volatility
Short-window vol ÷ long-window vol (4× the short window). Quiet, compressing vol usually goes with clean trends. Expanding vol usually means transitions and churn. Capped at 2 and flipped so that "quiet" scores high.
3. Lag-1 Autocorrelation
Does today's move tend to follow yesterday's? Positive = follow-through (momentum-friendly). Negative = snap-back (mean-reversion-friendly).
Components 2 and 3 get averaged into one "RelVol+AC" number. Then both that and the ER get percentile-ranked over the last year, so a 0.8 on BTC means the same thing as a 0.8 on a sleepy utility stock, and 4H reads the same as daily.
Putting it together
Default mix is 40% Efficiency Ratio / 60% RelVol+AC, smoothed with a 16-bar EMA so it doesn't flip on every bar. Above 0.60 = trending (green). Below 0.40 = ranging (red). The middle is left grey on purpose: that's the "don't know, don't force it" zone.
What's hiding in the Data Window
Ways to use it
Two alerts built in: regime → Trending and regime → Ranging.
Honest limitations
Settings
Open source. Fork it, break it, tell me what you find.
Most indicators try to tell you which way price is going. This one asks a different question: is the market in a mood where trend-following works, or one where fading works?
You get one number, the Regime Score, from 0 (ranging / choppy) to 1 (trending). Under the hood it blends three different ways of looking at price, each measured at three speeds (16 / 32 / 64 bars by default).
The three components
1. Efficiency Ratio (Kaufman)
How straight is the path? Net distance ÷ total distance travelled. Move 10 points in 10 points of wiggle: score 1.0. Wander 50 points to end up 10 higher: score 0.2. High = directional, low = chop.
2. Relative Volatility
Short-window vol ÷ long-window vol (4× the short window). Quiet, compressing vol usually goes with clean trends. Expanding vol usually means transitions and churn. Capped at 2 and flipped so that "quiet" scores high.
3. Lag-1 Autocorrelation
Does today's move tend to follow yesterday's? Positive = follow-through (momentum-friendly). Negative = snap-back (mean-reversion-friendly).
Components 2 and 3 get averaged into one "RelVol+AC" number. Then both that and the ER get percentile-ranked over the last year, so a 0.8 on BTC means the same thing as a 0.8 on a sleepy utility stock, and 4H reads the same as daily.
Putting it together
Default mix is 40% Efficiency Ratio / 60% RelVol+AC, smoothed with a 16-bar EMA so it doesn't flip on every bar. Above 0.60 = trending (green). Below 0.40 = ranging (red). The middle is left grey on purpose: that's the "don't know, don't force it" zone.
What's hiding in the Data Window
- Each component's rank on its own, so you can see what is actually moving the score.
- Two derived weights, Divergence Multiplier and Convergence Multiplier (range 1 ± strength). If you run trend and mean-reversion signals side by side, these are meant to tilt between them: scale trend signals by Divergence, counter-trend signals by Convergence. At strength 0.5, a fully trending regime gives trend signals 1.5× weight and counter-trend signals 0.5×.
Ways to use it
- As a filter: only take breakouts / momentum entries when it's green, only fade when it's red.
- As a sizing knob: use the multipliers to lean in or out instead of switching strategies on and off.
- As a sanity check: when it flips, peek at the Data Window to see whether vol, path efficiency or autocorrelation moved first.
Two alerts built in: regime → Trending and regime → Ranging.
Honest limitations
- Needs about a year of bars (252 by default) before the ranking means anything.
- It tells you what the regime is, not when it's going to change.
- It doesn't care about direction. A clean crash scores as "trending" too.
Settings
- Fast / Medium / Slow — 16 / 32 / 64 — speeds for all three measures
- Weight: ER / RelVol+AC — 0.4 / 0.6 — how much each side counts
- Percentile Rank Lookback — 252 — the "last year" window
- Score Smoothing — 16 — EMA on the final score
- Trending Above / Ranging Below — 0.60 / 0.40 — where the shading kicks in
- Multiplier Strength — 0.5 — only touches the hidden multipliers
Open source. Fork it, break it, tell me what you find.

כתב ויתור
המידע והפרסומים אינם מיועדים להיות, ואינם מהווים, ייעוץ או המלצה פיננסית, השקעתית, מסחרית או מכל סוג אחר המסופקת או מאושרת על ידי TradingView. קרא עוד ב־תנאי השימוש.
כתב ויתור
המידע והפרסומים אינם מיועדים להיות, ואינם מהווים, ייעוץ או המלצה פיננסית, השקעתית, מסחרית או מכל סוג אחר המסופקת או מאושרת על ידי TradingView. קרא עוד ב־תנאי השימוש.