מעודכן
Engulfing Context Score [IEF]
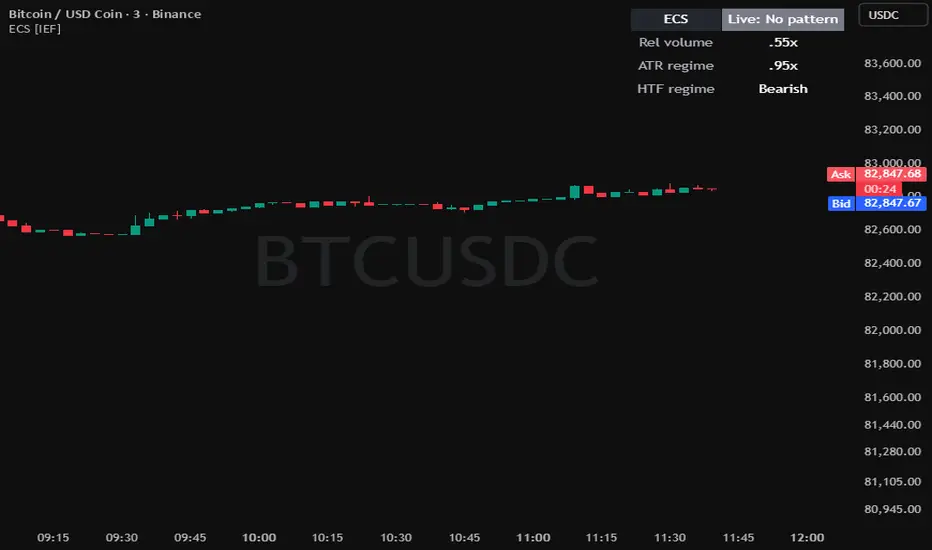
Engulfing Context Score (ECS) is a candle-event analyzer that ranks two-candle reversal candidates using a configurable 0-100 scoring heuristic. The score measures how closely a candle matches the chosen criteria. The weights and thresholds are design choices, not statistically calibrated estimates. The score has not been validated as a predictor of returns or reversal success.
PATTERN DEFINITION
The base candidate consists of two opposite-color candles, with a minimum previous body relative to the preceding ATR and a minimum current/previous body ratio. Defaults are 0.10 ATR and 1.20 times the previous body. Full body engulfment and a directional close beyond the previous high or low are enabled by default. Disabling full engulfment admits reversal candidates that may not engulf the previous body.
CALCULATION
Six components are normalized to 0-1 and combined by their weights. The final score is 100 times their weighted sum divided by the actual sum of weights, then rounded. At least one weight must be positive.
1. Body expansion: current/previous body ratio minus one, capped between zero and one. A body twice the previous size receives the maximum contribution.
2. Close location: bullish candidates use (close-low)/(high-low); bearish candidates use (high-close)/(high-low). The range denominator has a one-tick floor.
3. Rejection wick: bullish candidates use twice the lower-wick/range ratio; bearish candidates use twice the upper-wick/range ratio, capped at one. This is a geometric description of the wick, not proof of order flow or buyer/seller intent.
4. Participation: current volume divided by its 30-bar simple-average baseline. The normalized contribution is (relative volume-0.75)/1.25, capped between zero and one. If volume or its positive baseline is unavailable, the component receives a neutral 0.5 and the dashboard shows N/A. The script cannot determine whether a feed provides actual traded volume or tick volume.
5. Volatility context: 14-bar ATR divided by its 50-bar simple-average baseline. The contribution rises linearly from zero at 0.60x to one at 1.50x, then declines to zero at 3x. An unavailable or zero ATR baseline uses a 1x fallback. This measures volatility, not liquidity.
6. Confirmed context regime: 20- and 50-period EMAs from the preceding completed bar of the selected context timeframe. Bullish alignment contributes one to bullish candidates; bearish alignment contributes one to bearish candidates. Nonaligned regimes contribute zero.
Default weights are 25, 20, 15, 15, 10 and 15 respectively. They express the author's heuristic priorities and are user-adjustable. The default minimum score is 65.
PURPOSE AND CONTRIBUTION
The underlying engulfing pattern, ATR, relative volume and EMAs are established tools. This implementation's contribution is the transparent event-ranking framework that integrates candle geometry with contextual measurements in a single normalized score. Geometry describes the two-candle event, participation and volatility describe its surrounding conditions, and the completed-bar regime describes directional alignment. This lets users compare candidates under stated criteria rather than simply applying independent indicator gates. It does not claim a uniquely discovered pattern or proven trading advantage.
CONFIRMATION AND TIMEFRAMES
The context timeframe must be equal to or higher than the chart timeframe. A lower selection raises an explanatory error. The default is 60 minutes, so users on charts above 60 minutes must increase it. Equal timeframes use the preceding chart bar. Higher timeframe requests use an expression offset of one bar with lookahead enabled, so historical chart bars do not receive future context values.
Qualified signals and below-threshold markers appear only at chart-bar close. Dashboard readings marked Live are provisional and may change before close. Data-feed revisions can also alter historical calculations.
HOW TO USE
Start with the default settings and study the scored B (bullish) and S (bearish) labels. Increasing the minimum score selects fewer candidates; decreasing it selects more. Scores describe fit to the selected model, not expected profit.
Enable Show confirmed candidates below threshold to see small circles for lower-scoring candidates. These markers do not include candidates suppressed solely by cooldown. The default three-bar cooldown is shared across both directions and skips the next three bars after a qualifying signal.
Adjust weights to test an explicit hypothesis. Set a weight to zero to remove its contribution. Use volume-based criteria only when the instrument's feed is appropriate. Labels can be replaced by triangles, and qualifying-bar coloring is optional. The dashboard shows the current candidate state, relative volume, ATR regime and context direction. Alerts are available for qualifying bullish and bearish events. At most 500 score labels are retained by the script.
LIMITATIONS
A score of 80 does not mean an 80% probability of reversal. Engulfing candidates can fail during persistent trends, gaps, news or thin trading. Results vary with symbol, timeframe, session, feed and settings. There is no strategy backtest, win-rate claim or calibrated probability model. Higher timeframe context is delayed until the relevant bar completes. Conventional time-based candlestick charts are recommended; synthetic chart prices may produce different patterns.
DISCLAIMER
This open-source indicator is for educational and informational purposes only and is not financial, investment, or trading advice. Its scores, markers and alerts are not recommendations to buy or sell. It does not generate orders or calculate position size. Trading involves risk, including loss of capital. Historical observations do not guarantee future results. Users are responsible for their own analysis and decisions.
PATTERN DEFINITION
The base candidate consists of two opposite-color candles, with a minimum previous body relative to the preceding ATR and a minimum current/previous body ratio. Defaults are 0.10 ATR and 1.20 times the previous body. Full body engulfment and a directional close beyond the previous high or low are enabled by default. Disabling full engulfment admits reversal candidates that may not engulf the previous body.
CALCULATION
Six components are normalized to 0-1 and combined by their weights. The final score is 100 times their weighted sum divided by the actual sum of weights, then rounded. At least one weight must be positive.
1. Body expansion: current/previous body ratio minus one, capped between zero and one. A body twice the previous size receives the maximum contribution.
2. Close location: bullish candidates use (close-low)/(high-low); bearish candidates use (high-close)/(high-low). The range denominator has a one-tick floor.
3. Rejection wick: bullish candidates use twice the lower-wick/range ratio; bearish candidates use twice the upper-wick/range ratio, capped at one. This is a geometric description of the wick, not proof of order flow or buyer/seller intent.
4. Participation: current volume divided by its 30-bar simple-average baseline. The normalized contribution is (relative volume-0.75)/1.25, capped between zero and one. If volume or its positive baseline is unavailable, the component receives a neutral 0.5 and the dashboard shows N/A. The script cannot determine whether a feed provides actual traded volume or tick volume.
5. Volatility context: 14-bar ATR divided by its 50-bar simple-average baseline. The contribution rises linearly from zero at 0.60x to one at 1.50x, then declines to zero at 3x. An unavailable or zero ATR baseline uses a 1x fallback. This measures volatility, not liquidity.
6. Confirmed context regime: 20- and 50-period EMAs from the preceding completed bar of the selected context timeframe. Bullish alignment contributes one to bullish candidates; bearish alignment contributes one to bearish candidates. Nonaligned regimes contribute zero.
Default weights are 25, 20, 15, 15, 10 and 15 respectively. They express the author's heuristic priorities and are user-adjustable. The default minimum score is 65.
PURPOSE AND CONTRIBUTION
The underlying engulfing pattern, ATR, relative volume and EMAs are established tools. This implementation's contribution is the transparent event-ranking framework that integrates candle geometry with contextual measurements in a single normalized score. Geometry describes the two-candle event, participation and volatility describe its surrounding conditions, and the completed-bar regime describes directional alignment. This lets users compare candidates under stated criteria rather than simply applying independent indicator gates. It does not claim a uniquely discovered pattern or proven trading advantage.
CONFIRMATION AND TIMEFRAMES
The context timeframe must be equal to or higher than the chart timeframe. A lower selection raises an explanatory error. The default is 60 minutes, so users on charts above 60 minutes must increase it. Equal timeframes use the preceding chart bar. Higher timeframe requests use an expression offset of one bar with lookahead enabled, so historical chart bars do not receive future context values.
Qualified signals and below-threshold markers appear only at chart-bar close. Dashboard readings marked Live are provisional and may change before close. Data-feed revisions can also alter historical calculations.
HOW TO USE
Start with the default settings and study the scored B (bullish) and S (bearish) labels. Increasing the minimum score selects fewer candidates; decreasing it selects more. Scores describe fit to the selected model, not expected profit.
Enable Show confirmed candidates below threshold to see small circles for lower-scoring candidates. These markers do not include candidates suppressed solely by cooldown. The default three-bar cooldown is shared across both directions and skips the next three bars after a qualifying signal.
Adjust weights to test an explicit hypothesis. Set a weight to zero to remove its contribution. Use volume-based criteria only when the instrument's feed is appropriate. Labels can be replaced by triangles, and qualifying-bar coloring is optional. The dashboard shows the current candidate state, relative volume, ATR regime and context direction. Alerts are available for qualifying bullish and bearish events. At most 500 score labels are retained by the script.
LIMITATIONS
A score of 80 does not mean an 80% probability of reversal. Engulfing candidates can fail during persistent trends, gaps, news or thin trading. Results vary with symbol, timeframe, session, feed and settings. There is no strategy backtest, win-rate claim or calibrated probability model. Higher timeframe context is delayed until the relevant bar completes. Conventional time-based candlestick charts are recommended; synthetic chart prices may produce different patterns.
DISCLAIMER
This open-source indicator is for educational and informational purposes only and is not financial, investment, or trading advice. Its scores, markers and alerts are not recommendations to buy or sell. It does not generate orders or calculate position size. Trading involves risk, including loss of capital. Historical observations do not guarantee future results. Users are responsible for their own analysis and decisions.
הערות שחרור
Readability update: score labels now default to Normal size instead of Tiny. Added Display > Score label size with Small, Normal, Large and Huge options. Bullish and bearish labels use the selected size. Scoring, pattern criteria, cooldown, bar-close confirmation and alerts are unchanged.B denotes a bullish candidate; S denotes a bearish candidate. The number is the 0-100 weighted context score, not a win probability. Educational and informational only; not financial, investment or trading advice.

— IndicatorEliteFlow
No hype. Just data.
No hype. Just data.
כתב ויתור
המידע והפרסומים אינם מיועדים להיות, ואינם מהווים, ייעוץ או המלצה פיננסית, השקעתית, מסחרית או מכל סוג אחר המסופקת או מאושרת על ידי TradingView. קרא עוד ב־תנאי השימוש.
— IndicatorEliteFlow
No hype. Just data.
No hype. Just data.
כתב ויתור
המידע והפרסומים אינם מיועדים להיות, ואינם מהווים, ייעוץ או המלצה פיננסית, השקעתית, מסחרית או מכל סוג אחר המסופקת או מאושרת על ידי TradingView. קרא עוד ב־תנאי השימוש.