MTF Panel Candle Alignment
# MTF Panel — Candle Alignment
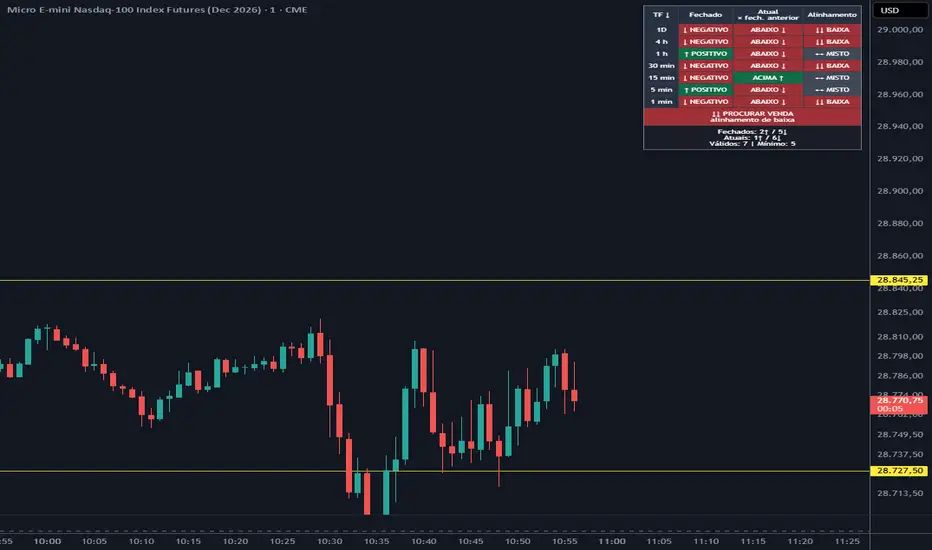
A multi-timeframe dashboard that displays candle direction in a compact table at the top-right corner of your chart. Monitor multiple timeframes without switching charts.
### Dashboard readings
• **Last closed candle:** positive when the close is above the open, negative when below, and doji when equal.
• **Current vs. previous close:** shows whether the current price is above, below, or equal to the previous candle’s closing price on each timeframe.
• **Alignment:** identifies when both readings agree on a bullish or bearish direction. Conflicting readings are marked as mixed.
Directional arrows and colors make each condition easy to recognize.
### Multi-timeframe conclusion
Timeframes are displayed from highest to lowest. The dashboard provides a conclusion based on the selected timeframes:
🔵 **LOOK FOR BUY:** bullish alignment.
🔴 **LOOK FOR SELL:** bearish alignment.
🟡 **WAIT:** insufficient alignment or missing confirmation.
By default, directional alignment requires:
• At least 60% of the last closed candles pointing in the same direction.
• Agreement from the two highest selected timeframes.
• At least three valid timeframes.
• At least 60% of current candles confirming the direction relative to their previous closes.
These requirements are adjustable. Current-candle confirmation can also be disabled.
### Customization
• Seven configurable timeframe slots, defaulting to 1m, 5m, 15m, 30m, 1h, 4h, and daily.
• Individual visibility controls in the indicator settings.
• English and Portuguese language options, with English as the default.
• Adjustable text size.
• Optional explanatory footer.
• Duplicate timeframes are counted only once.
### Usage notes
Use the indicator on a 1-minute chart to monitor all default timeframes. Timeframes below the chart’s timeframe are flagged and excluded from the conclusion.
Current candles are still developing, so their readings and the dashboard conclusion may change before they close. “Current vs. previous close” describes the price’s position relative to the previous close; it does not measure tick-by-tick movement.
This dashboard provides multi-timeframe context. Its conclusion is not an automatic entry signal and does not guarantee results. Use it alongside your trading strategy and risk management.
A multi-timeframe dashboard that displays candle direction in a compact table at the top-right corner of your chart. Monitor multiple timeframes without switching charts.
### Dashboard readings
• **Last closed candle:** positive when the close is above the open, negative when below, and doji when equal.
• **Current vs. previous close:** shows whether the current price is above, below, or equal to the previous candle’s closing price on each timeframe.
• **Alignment:** identifies when both readings agree on a bullish or bearish direction. Conflicting readings are marked as mixed.
Directional arrows and colors make each condition easy to recognize.
### Multi-timeframe conclusion
Timeframes are displayed from highest to lowest. The dashboard provides a conclusion based on the selected timeframes:
🔵 **LOOK FOR BUY:** bullish alignment.
🔴 **LOOK FOR SELL:** bearish alignment.
🟡 **WAIT:** insufficient alignment or missing confirmation.
By default, directional alignment requires:
• At least 60% of the last closed candles pointing in the same direction.
• Agreement from the two highest selected timeframes.
• At least three valid timeframes.
• At least 60% of current candles confirming the direction relative to their previous closes.
These requirements are adjustable. Current-candle confirmation can also be disabled.
### Customization
• Seven configurable timeframe slots, defaulting to 1m, 5m, 15m, 30m, 1h, 4h, and daily.
• Individual visibility controls in the indicator settings.
• English and Portuguese language options, with English as the default.
• Adjustable text size.
• Optional explanatory footer.
• Duplicate timeframes are counted only once.
### Usage notes
Use the indicator on a 1-minute chart to monitor all default timeframes. Timeframes below the chart’s timeframe are flagged and excluded from the conclusion.
Current candles are still developing, so their readings and the dashboard conclusion may change before they close. “Current vs. previous close” describes the price’s position relative to the previous close; it does not measure tick-by-tick movement.
This dashboard provides multi-timeframe context. Its conclusion is not an automatic entry signal and does not guarantee results. Use it alongside your trading strategy and risk management.

כתב ויתור
המידע והפרסומים אינם מיועדים להיות, ואינם מהווים, ייעוץ או המלצה פיננסית, השקעתית, מסחרית או מכל סוג אחר המסופקת או מאושרת על ידי TradingView. קרא עוד ב־תנאי השימוש.
כתב ויתור
המידע והפרסומים אינם מיועדים להיות, ואינם מהווים, ייעוץ או המלצה פיננסית, השקעתית, מסחרית או מכל סוג אחר המסופקת או מאושרת על ידי TradingView. קרא עוד ב־תנאי השימוש.