אינדיקטור

אינדיקטור

אינדיקטור

אינדיקטור

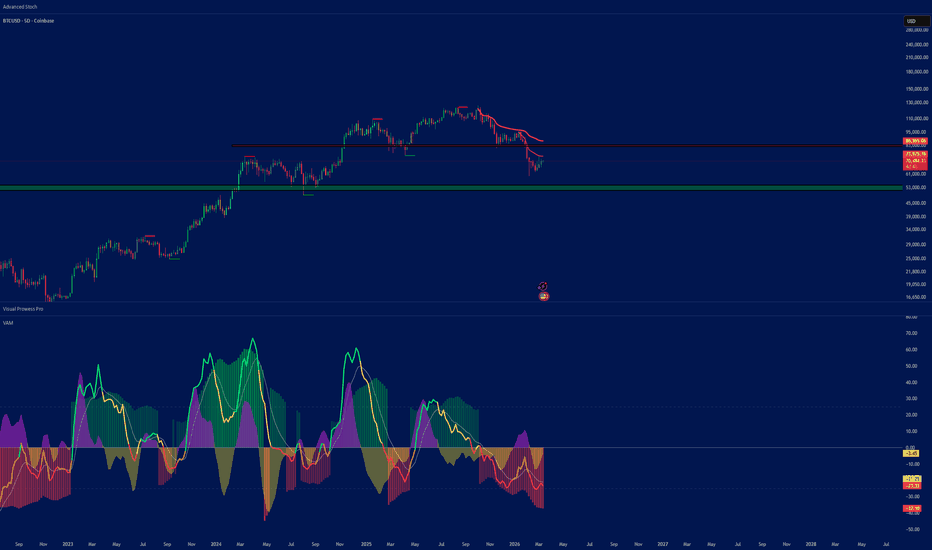
Velocity Acceleration Momentum [VAM]Velocity Acceleration Momentum
Overview
VAM is a multi-layered momentum indicator that measures how fast price is moving (Velocity), whether that speed is increasing or decreasing (Acceleration), and how strong the underlying trend is (ADX). Rather than just telling you the direction of price, VAM tells you the quality and phase of the move you're in.
How It's Calculated
Velocity measures the percentage rate of change of price over a lookback period (default: 14 bars), then smooths it with a 3-period EMA. It answers: "How fast is price moving relative to where it was?"
Acceleration is the change in Velocity over a secondary smoothing window (default: 5 bars), also EMA-smoothed. It answers: "Is momentum speeding up or slowing down?"
Signal Line is an EMA of Velocity (default: 9 bars) — similar in concept to the MACD signal line. When Velocity crosses above/below the Signal Line, it can indicate momentum shifts.
ADX Histogram uses Pine's built-in DMI/ADX calculation. When DI+ > DI−, bars plot positively (green); when DI− > DI+, bars plot negatively (red). The color opacity is gradient-mapped to ADX strength — vivid bars mean a strong trend, faded bars mean a weak/ranging market.
Reading the Velocity Line Colors (Regime Detection)
The Velocity line changes color based on the combination of Velocity and Acceleration:
ColorConditionMeaning🟢 LimeVelocity > 0, Acceleration > 0Rocket — momentum is up and accelerating🟡 YellowVelocity > 0, Acceleration < 0Topping — still positive but losing steam🔴 RedVelocity < 0, Acceleration < 0Freefall — momentum is down and worsening🟠 OrangeVelocity < 0, Acceleration > 0Bottoming — still negative but recovering
How to Trade With It
High level Buy when Velocity Line Green 🟢sell when Velocity drops hard and is Red 🔴
+
ADX BARS TELL YOU THE TREND AND THE TREND STRENTH (COMBINE THIS AND THE VELOCITY LINE)
+
ACCELERATION PUROPLE AND YELLOW WAVE TELLS YOU SHARP DROPS OR ADVANCES IN ACCELERATION
Trend Entries: Look for the Velocity line turning Lime (🟢) with the ADX histogram printing vivid green bars above the +25 line. This is the highest-confidence long setup — price is accelerating upward with confirmed trend strength.
Caution / Exit Signals: When Velocity turns Yellow (🟡) and sharply drops, momentum is fading even if price is still rising. Consider tightening stops or taking partial profits.
Short / Bearish Bias🔴 : Red Velocity + vivid red ADX bars below −25 signal a strong downtrend in Freefall. Avoid longs; look for short setups.
Potential Reversals: Orange Velocity (Bottoming) combined with ADX bars beginning to fade and shift green can be an early signal that a bottom is forming — useful for scaling into longs cautiously.
Signal Line Crosses: When the Velocity line crosses above the white Signal Line, momentum is picking up. Crosses below suggest weakening. Best used as a confirmation filter, not a standalone trigger.
The ±25 Reference Lines mark the ADX threshold commonly used to separate trending (above) from ranging (below) markets. ADX histogram bars inside the ±25 zone suggest low trend conviction — reduce position sizing or wait for confirmation.
Inputs
Source — Price input (default: Close)
Velocity Length — Lookback period for rate-of-change calculation (default: 14)
Acceleration Smooth — Smoothing window for acceleration (default: 5)
Signal Line Length — EMA period for the signal line (default: 9)
ADX Length — Period for DMI/ADX calculation (default: 14)
Show Signal Line — Toggle the white signal line on/off
Show Zone Backgrounds — Toggle ADX-strength background shading
Show ADX Histogram — Toggle the ADX directional histogram אינדיקטור
Ema with Squeeze ColorThis indicator transforms a standard Exponential Moving Average (EMA) into a dynamic, multi-dimensional trend line. Instead of just showing average price, the line's color acts as a heat map for two critical market forces: Volatility Compression (the "Radar") and Normalized Momentum (the "Engine"). By combining these elements directly into the EMA structure, traders can visually identify whether the current trend is accelerating, chopping, or coiling up for a massive breakout, all without taking their eyes off the price action.
► Underlying Logic & Calculations
This script does not rely on standard overbought/oversold logic. The color engine is driven by three distinct mathematical layers:
The Baseline Structure: The foundation is a standard EMA (default 20-period), which tracks the immediate trend direction.
The "Engine" (Normalized Momentum): The script measures raw momentum (ta.mom) and normalizes it against a 20-period standard deviation (volatility). This outputs a 0 to 100% "Engine Power" score, representing how aggressive the current momentum is relative to recent market volatility.
The "Radar" (Pressure Squeeze Index): To detect consolidations and impending breakouts, the script calculates dynamic upper and lower recursive envelopes using a customizable convergence factor. It takes the logarithmic difference between these envelopes and calculates its linear correlation against the bar index to generate a 0 to 100 Pressure Squeeze Index (PSI).
► The Color Matrix & Priority System
The indicator assigns colors based on a strict priority system to filter out noise:
Priority 1 (The Radar Squeeze): If the Squeeze Index exceeds the high threshold (default 70%), the line turns Yellow. This overrides all momentum calculations, warning the trader that volatility is heavily compressed and a breakout is imminent.
Priority 2 & 3 (The Engine Power): If the market is not squeezing, the script checks the direction of the momentum (Bullish vs. Bearish) and assigns a color gradient based on the Engine score:
Strong Explosion (Neon Cyan / Laser Red): Normalized momentum is above 80%. Aggressive trend continuation.
Standard Trend (Green / Pink): Normalized momentum is above 40%. Healthy trend.
Weak / Chop (Lime / Orange to Teal / Light Orange): Normalized momentum is extremely low. The market is exhausted or drifting.
► How to Use It
The Squeeze Play: Look for the EMA to turn Yellow during periods of tight consolidation. Wait for the color to violently shift into a "Strong Explosion" color (Neon Cyan for longs, Laser Red for shorts) to trade the breakout.
Trend Management: Stay in winning trades while the line remains in the strong or medium trend colors. Consider taking profits or trailing stops tightly once the line fades into the "Weak" or "Chop" colors, indicating the momentum engine is running out of gas. אינדיקטור

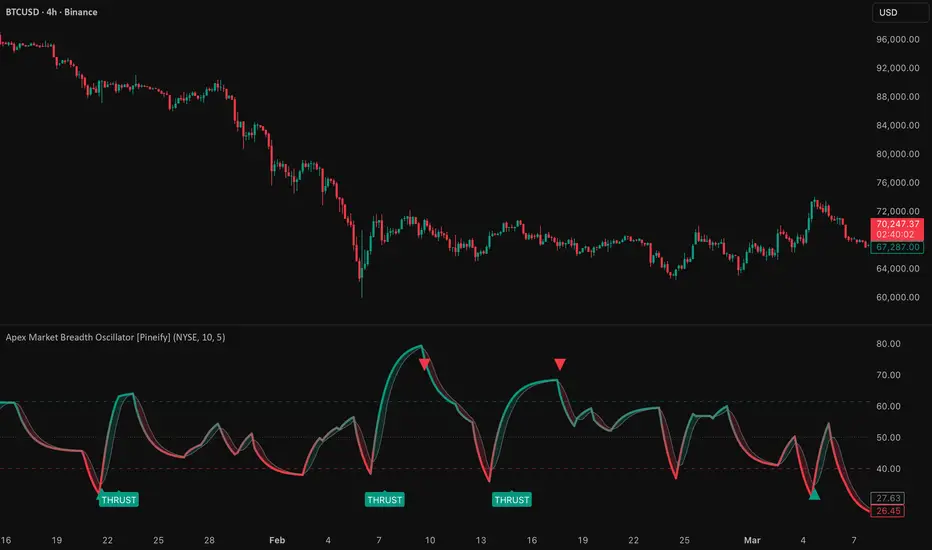
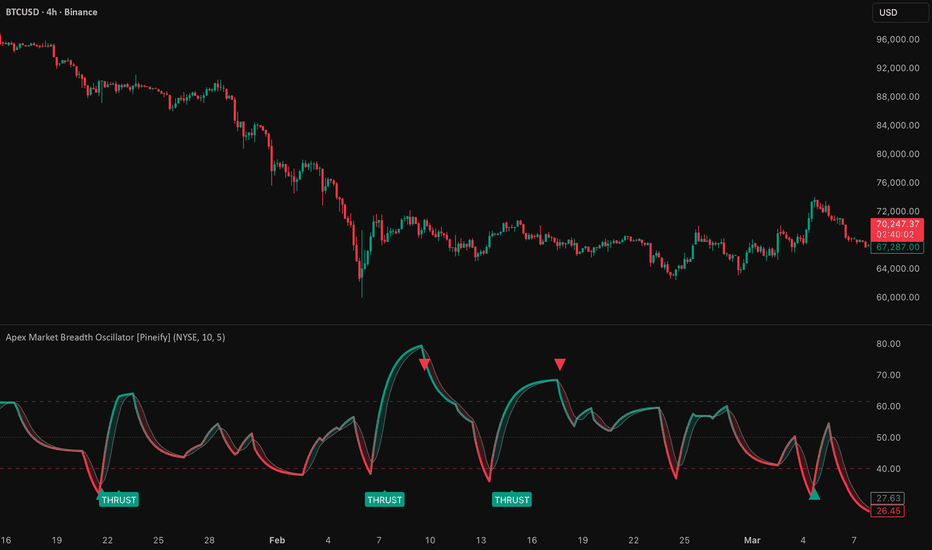
Apex Market Breadth Oscillator [Pineify]Apex Market Breadth Oscillator
The Apex Market Breadth Oscillator is a composite market-internal momentum tool that blends Advance/Decline Issue Breadth with Up/Down Volume Breadth into a single, smoothed oscillator — giving traders a unified view of how broadly the market is participating in a move. Rather than relying on price action of a single index, this indicator looks beneath the surface by measuring both the percentage of stocks advancing and the percentage of volume flowing into advancing stocks, then combining them into one reading. The oscillator is built on the Whaley Breadth Thrust methodology and incorporates Martin Zweig's classic breadth thrust threshold (61.5) as a key reference level. An EMA-smoothed composite line is paired with an SMA signal line for crossover-based timing, while gradient coloring and zone-based buy/sell signals help traders quickly identify oversold recoveries, overbought exhaustion, and rare breadth thrust events that have historically preceded major bull market advances.
Key Features
Composite breadth oscillator — merges Advance/Decline Issue Breadth (ADT) and Up/Down Volume Breadth (UDT) into a single reading that captures both stock participation and capital flow direction.
Whaley Breadth Thrust methodology — calculates the percentage of advancing issues and advancing volume relative to their totals, providing a normalized 0–100 scale for cross-market comparison.
EMA-smoothed oscillator with SMA signal line — the composite is smoothed via EMA for noise reduction while retaining responsiveness; an SMA signal line provides crossover-based momentum shift detection.
Martin Zweig's breadth thrust threshold — the 61.5 level marks the historically significant thrust zone where breadth surges have preceded powerful multi-month rallies.
Zone-based buy/sell signals — buy signals fire only in oversold territory (below 40), sell signals fire only in overbought territory (above 61.5), filtering out low-conviction crossovers in the neutral zone.
Dynamic gradient coloring — the oscillator line transitions smoothly from red (oversold) to green (overbought) based on its position between the 40 and 61.5 levels, providing an instant visual read on market health.
Breadth thrust event labels — rare "THRUST" labels mark the moment the oscillator crosses above 61.5, highlighting high-conviction bullish impulse events.
Multi-exchange support — toggle between NYSE and NASDAQ breadth data to analyze large-cap or growth/tech-weighted market internals.
How It Works
The indicator follows a four-stage calculation pipeline to transform raw market breadth data into actionable signals:
Data sourcing: Four breadth series are pulled from the selected exchange (NYSE or NASDAQ) — advancing issues, declining issues, advancing volume, and declining volume. These are standard USI (US Indices) breadth tickers that represent the internal composition of the market on each bar.
Breadth ratio calculation: Two normalized ratios are computed. The Advance/Decline Thrust (ADT) measures the percentage of advancing issues relative to total issues: ADT = 100 × advancing / (advancing + declining). The Up/Down Volume Thrust (UDT) applies the same formula to volume: UDT = 100 × up volume / (up volume + down volume). Both ratios range from 0 to 100, where 50 represents equilibrium.
Composite smoothing: ADT and UDT are averaged to create a raw composite that reflects both issue participation and volume participation. This raw composite is then smoothed with an Exponential Moving Average (EMA) of configurable length (default: 10). The EMA removes bar-to-bar noise while preserving the oscillator's ability to react quickly to genuine breadth shifts.
Signal line generation: A Simple Moving Average (SMA) of the smoothed composite (default length: 5) serves as the signal line. Crossovers between the faster EMA-smoothed composite and the slower SMA signal line identify momentum inflection points, which are then filtered by zone (oversold or overbought) to produce the final buy and sell signals.
Trading Ideas and Insights
Oversold recovery entries: When the oscillator drops below 40, the market is experiencing broad-based selling — most stocks are declining and declining volume dominates. A buy signal (composite crossing above the signal line while below 40) captures the early momentum shift as breadth begins recovering. These signals identify potential bottoms where risk/reward is most favorable.
Overbought exhaustion exits: When the oscillator rises above 61.5, the market is experiencing an exceptionally broad advance. A sell signal (composite crossing below the signal line while above 61.5) identifies the moment breadth momentum starts fading after an extreme surge. This can be used to take profits or tighten stops on long positions.
Breadth thrust confirmation: The "THRUST" label marks the rare event where the oscillator surges past 61.5. Historically, Zweig Breadth Thrusts — where breadth rapidly transitions from oversold to above the thrust threshold — have preceded significant market gains over the following 6–12 months. These events can be used as high-conviction confirmation for establishing or adding to long-term positions.
Divergence analysis: When a major index makes new highs but the Apex Breadth Oscillator fails to confirm (lower highs on the oscillator), it signals narrowing participation — fewer stocks are driving the rally. This breadth divergence is a classic warning sign of potential market weakness ahead.
Equilibrium as a trend filter: Sustained readings above 50 indicate healthy broad market participation; sustained readings below 50 suggest internal weakness even if headline indices appear stable. Use the 50 level as a simple filter — favor long setups when the oscillator is above 50, and exercise caution or favor short setups when below.
How Multiple Indicators Work Together
The Apex Market Breadth Oscillator integrates several analytical components into a cohesive system, each serving a distinct purpose:
Advance/Decline Issue Breadth (ADT) — participation measurement: ADT answers the question "what percentage of stocks are advancing?" This captures the breadth of participation regardless of the size of individual stock moves. A market where 80% of stocks are rising is fundamentally healthier than one where only 20% are rising — even if both scenarios produce the same index return.
Up/Down Volume Breadth (UDT) — capital flow measurement: UDT answers the question "what percentage of volume is flowing into advancing stocks?" This adds a volume-weighted dimension that ADT alone cannot provide. High UDT values indicate that institutional-scale capital is flowing into advancing stocks, not just a large number of small-cap stocks ticking higher on minimal volume.
EMA composite smoothing — noise reduction: Averaging ADT and UDT and applying EMA smoothing transforms two noisy daily breadth readings into a single, clean oscillator. The EMA's exponential weighting ensures recent breadth conditions have more influence than older ones, keeping the oscillator responsive to current market dynamics.
SMA signal line — timing mechanism: The SMA signal line adds a crossover-based timing layer. While the composite oscillator tells you the current state of market breadth, the signal line crossovers tell you when that state is changing — identifying the inflection points where breadth momentum is shifting from deteriorating to improving (or vice versa).
The synergy is sequential: raw breadth data (issues + volume) → normalized ratios (ADT + UDT) → blended composite → EMA smoothing → SMA signal line → zone-filtered crossover signals. Each layer refines the raw data further, producing signals that require both broad market participation AND volume confirmation AND momentum shift AND extreme positioning to trigger — a multi-filter approach that dramatically reduces false signals compared to using any single breadth measure alone.
Unique Aspects
Dual-breadth composite: Most breadth oscillators use either issue breadth or volume breadth in isolation. The Apex Market Breadth Oscillator combines both into a single composite, ensuring that signals reflect genuine broad-based market moves backed by volume — not just a large number of stocks ticking marginally higher on thin volume.
Zweig-inspired threshold levels: The 61.5 thrust level is not an arbitrary overbought line — it is derived from Martin Zweig's Breadth Thrust indicator, one of the most historically reliable bullish signals in market analysis. The 40 oversold level provides the corresponding floor, creating a framework rooted in decades of market research.
Zone-filtered signals: Rather than generating signals on every crossover (which would produce many false signals in the neutral 40–61.5 zone), the indicator restricts buy signals to oversold territory and sell signals to overbought territory. This zone-based filtering ensures signals only fire at extreme readings where the probability of a meaningful reversal is highest.
Gradient color mapping: The oscillator line uses a continuous gradient from red to green mapped to the 40–61.5 range, rather than a simple binary color switch. This provides an intuitive, at-a-glance reading of where the oscillator sits within the oversold-to-overbought spectrum without needing to check exact values.
How to Use
Add the indicator to your chart. It appears in a separate pane below the price chart, displaying the composite breadth oscillator, signal line, and three reference levels (40, 50, 61.5).
Select your preferred exchange — NYSE for large-cap/value-oriented breadth analysis, or NASDAQ for tech/growth-weighted breadth analysis. The choice depends on which market segment you are trading or want to monitor for confirmation.
Monitor the oscillator's color: red tones indicate the oscillator is near or below the oversold zone (40), suggesting broad market weakness. Green tones indicate the oscillator is near or above the overbought/thrust zone (61.5), suggesting strong broad participation.
Watch for BUY signals (green triangles at the bottom) — these appear when the oscillator crosses above its signal line while in oversold territory (below 40). Consider entering long positions or adding to existing ones.
Watch for SELL signals (red triangles at the top) — these appear when the oscillator crosses below its signal line while in overbought territory (above 61.5). Consider taking profits or tightening stops on long positions.
Pay special attention to THRUST labels (green labels at the bottom) — these mark the rare event where the oscillator surges above 61.5. Historically, these breadth thrust events have preceded significant multi-month market advances and represent high-conviction bullish confirmation.
Use the 50 equilibrium level as a simple trend filter — sustained readings above 50 indicate healthy market internals; sustained readings below 50 suggest underlying weakness.
Compare the oscillator's trajectory with the price index for divergence analysis — if the index makes new highs but the oscillator does not, breadth is narrowing and caution is warranted.
Customization
Market Exchange (default: NYSE): Selects which exchange's breadth data to use. NYSE breadth reflects large-cap, broad market participation. NASDAQ breadth is more sensitive to technology and growth stock activity. Choose based on your trading focus or use both in separate indicator instances for a complete picture.
Oscillator Smoothing (default: 10): Controls the EMA period applied to the raw composite. Lower values (e.g., 5–7) produce a more volatile, responsive oscillator that generates more signals — suitable for short-term trading. Higher values (e.g., 15–21) produce a smoother oscillator with fewer but more reliable signals — suitable for swing or position trading.
Signal Line Length (default: 5): Controls the SMA period of the signal line. Shorter values make the signal line track the oscillator more closely, triggering crossovers sooner but with more potential for whipsaws. Longer values add lag but filter out minor fluctuations, producing more deliberate crossover signals.
Conclusion
The Apex Market Breadth Oscillator provides a comprehensive, under-the-hood view of market health by combining issue breadth and volume breadth into a single composite oscillator. Rooted in the Whaley Breadth Thrust methodology and incorporating Martin Zweig's historically significant thrust threshold, the indicator goes beyond surface-level price analysis to reveal whether rallies and declines are supported by broad participation and institutional volume. Its zone-filtered buy/sell signals, gradient color mapping, and rare breadth thrust labels give traders a structured, evidence-based framework for identifying high-probability turning points and confirming the strength of market moves. Whether used as a standalone market timing tool or as a confirmation layer alongside price-based indicators, the Apex Market Breadth Oscillator delivers actionable insights into the true breadth and conviction behind market movements.
אינדיקטור
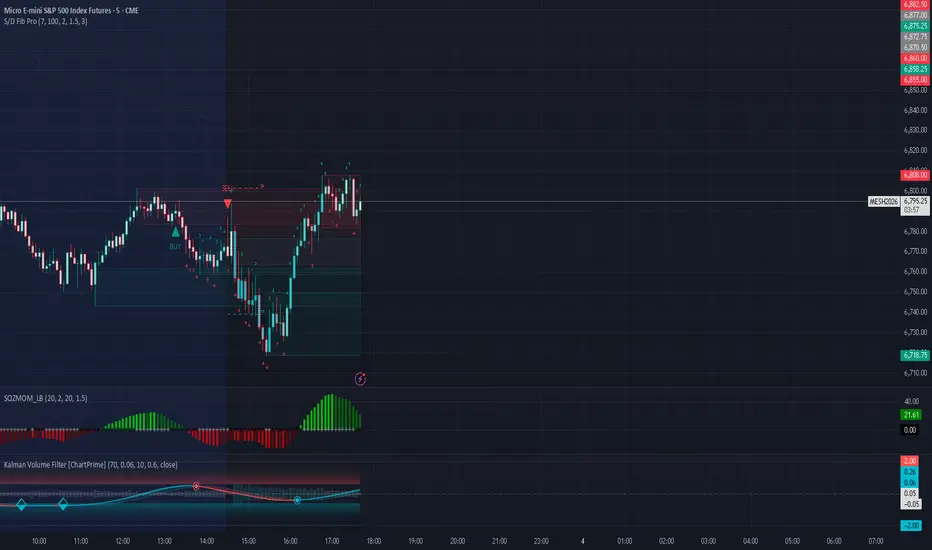
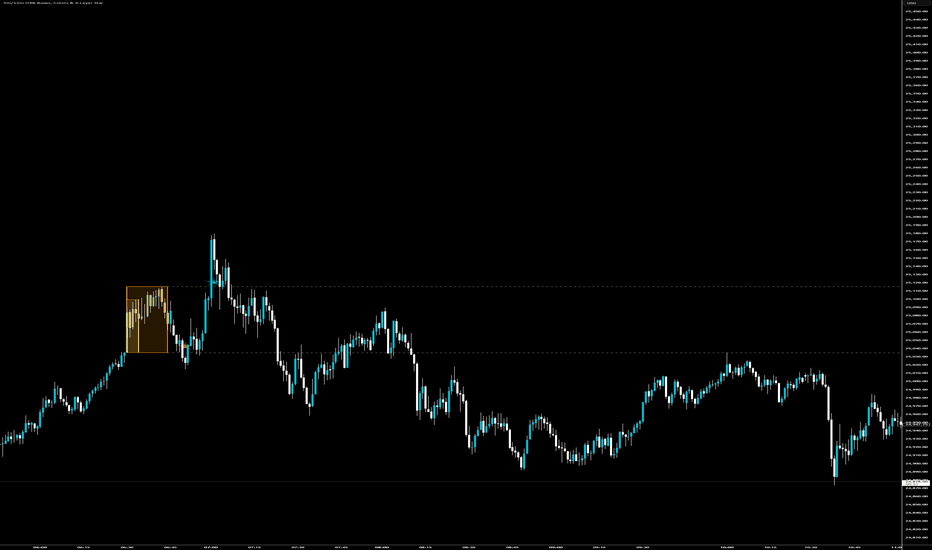
5m/15m ORB Boxes, Colors & 4-Layer StarTitle: 5m/15m Opening Range Breakout (ORB) with Confirmation Logic
Description:
This indicator is designed to visualize and trade the classic Opening Range Breakout (ORB) strategy, specifically optimized for high-volatility morning sessions on indices and equities.
Instead of relying on a single timeframe, this script dynamically plots both the initial 5-minute reaction and the more established 15-minute range, allowing traders to monitor early momentum while filtering out immediate opening bell fakeouts.
Core Features & Visuals:
Dual-Range Boxing: The script automatically detects the 09:30 AM EST New York open and draws two distinct ranges: a 5-minute initial balance box (default yellow) and a 15-minute established range box (default orange). The candle colors are overridden during these formation periods for immediate visual clarity.
Forward-Projecting Levels: Once the 15-minute Opening Range is set, clean extension lines project the high and low of that range into the future session. This provides strict visual boundaries for breakout entries and stop-loss placements without cluttering historical price action.
1-Candle Confirmation Trigger: High-volatility assets frequently sweep the opening range highs or lows to grab liquidity before reversing. To combat this, this indicator uses a strict 1-candle confirmation rule. The breakout logic requires the initial candle to close outside the 15-minute range, and it requires the very next consecutive candle to also close outside the range. This ensures the breakout is holding before a signal is generated.
Custom Multi-Layer Signal: When the confirmation logic is met, the script plots a highly visible, 4-layer overlapping star signal at the exact breakout point.
How to Use:
Traders can use the 15-minute extension lines as a strict "Go/No-Go" filter for the morning session. A bullish bias is adopted only when price holds above the top extension line, and a bearish bias when price holds below the bottom extension line. The multi-layer star signal serves as the mechanical entry trigger once price action has proven it can sustain the breakout.
Settings:
Users can fully customize the colors of the 5-minute box, the 15-minute box, and the extension lines to fit their specific chart themes. אינדיקטור
Stochastic Heat MapTitle: Delta-Filtered Stochastic Heat Map
► Core Concept & Originality
This script modifies the public domain Stochastic Heat Map concept by replacing standard overbought/oversold color gradients with a Volume-Delta confirmation matrix.
The traditional Stochastic Heat Map plots a series of stochastic oscillators to visualize momentum as a wave. However, traditional oscillators are mathematically bound (0 to 100), meaning they often falsely signal "exhaustion" (turning red) during strong, sustained trends simply because the value is pegged near 100. This indicator solves that structural limitation by integrating a Delta Proxy directly into the color engine, cross-referencing momentum levels with actual buying and selling pressure.
► Underlying Logic & Calculations
The Momentum Wave: The script calculates 28 individual Stochastic oscillators. The lookback lengths increment systematically (from fast to slow) to create a visual wave of overall price momentum across multiple cyclical lengths simultaneously.
The Delta Proxy: The script calculates a basic volume delta for each bar. If the Close is greater than or equal to the Open, the volume is treated as positive (buying pressure). If the Close is strictly less than the Open, the volume is treated as negative (selling pressure).
The Color Matrix: The indicator's color output is strictly dictated by the alignment of the Stochastic value and the Delta Proxy:
Bullish Agreement: High Stochastic + Positive Delta = Bright Bullish Colors. This indicates true strength, where volume is actively supporting the high momentum.
Bearish Agreement: Low Stochastic + Negative Delta = Bright Bearish Colors. This indicates true weakness, where volume is actively supporting the downward momentum.
Divergence / Exhaustion: If the Stochastic is high but the Delta is negative (or vice versa), the script outputs muted, darker colors. This warns the trader of a potential loss of volume support at momentum extremes.
► How to Use It
Trend Confirmation: Traders can look for the entire block of 28 lines to align in a bright, single-color theme to confirm a healthy, volume-backed trend.
Spotting Reversals: Watch for color shifts at the extreme peaks and troughs of the wave. If the momentum wave is high but the colors suddenly shift to a bearish theme, it indicates that sellers are taking control of the volume at the top of the range, preempting a potential reversal before the momentum wave actually curves downward. אינדיקטור

אינדיקטור

אינדיקטור

אינדיקטור
אינדיקטור

אינדיקטור

אינדיקטור

אינדיקטור

אינדיקטור

אינדיקטור

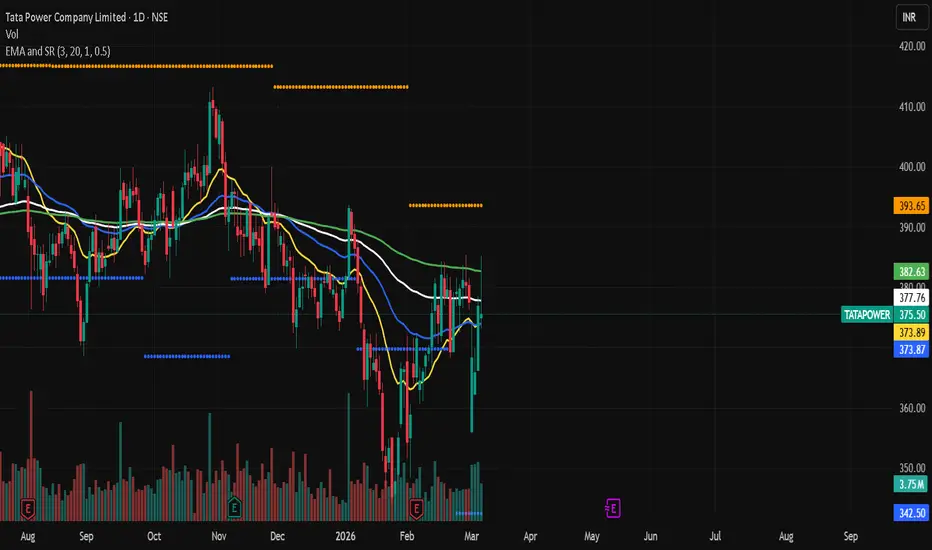
Quadruple EMA with Support and Resistance# EMA Trend + Support & Resistance Strategy
## Overview
A clean, rule-based trading strategy designed for the **Daily timeframe**. It uses four Exponential Moving Averages (EMA 20, 50, 100, 200) as a trend filter combined with dynamic Support & Resistance levels to identify high-probability breakout and breakdown setups.
The logic is intentionally simple — no indicators stacked on indicators, no complex filters. Just price, trend direction, and key levels.
---
## How It Works
### Entry — Long (CE / Buy)
A long entry is triggered when:
- Price closes **above all four EMAs** (20, 50, 100, 200) — confirming strong bullish trend alignment
- Price **breaks above the previous bar's high** — confirming momentum and breakout
### Entry — Short (PE / Sell)
A short entry is triggered when:
- Price closes **below all four EMAs** (20, 50, 100, 200) — confirming strong bearish trend alignment
- Price **breaks below the previous bar's low** — confirming momentum and breakdown
### Exit Logic
- **Stop Loss** — set at the previous bar's low (for longs) or previous bar's high (for shorts)
- **Target** — calculated using the configurable Risk:Reward Ratio (default 3:1)
- **EMA-based dynamic exit** — if price closes below EMA 20 or EMA 50 (for longs), or above EMA 20 or EMA 50 (for shorts), the stop is tightened to force an exit on the next bar, protecting open profit
- **Optional Trailing Stop Loss** — activates after a defined profit % is reached, then trails at a set % distance from the peak
---
## Indicators on Chart
| Line | Color | Meaning |
|------|-------|---------|
| EMA 20 | Yellow | Fast trend / momentum |
| EMA 50 | Blue | Mid-term trend |
| EMA 100 | White | Medium-long trend support |
| EMA 200 | Green | Long-term trend direction |
| Resistance | Orange dots | Swing high levels |
| Support | Blue dots | Swing low levels |
| ▲ Green arrow | Below bar | Long (CE) entry signal |
| ▼ Red arrow | Above bar | Short (PE) entry signal |
---
## Settings
| Input | Default | Description |
|-------|---------|-------------|
| Risk Reward Ratio | 3.0 | Target = Entry + (RR × Risk) |
| Show Support/Resistance | On | Toggle S/R level plots |
| Swing Detection Bars | 20 | Lookback bars for pivot detection |
| One Trade Per Day | On | Limits to one CE and one PE per day |
| Use Trailing Stop Loss | Off | Enable trailing SL after activation |
| Trailing Activation % | 1.0% | Profit % before trailing SL kicks in |
| Trailing Distance % | 0.5% | Distance the trailing SL follows from peak |
---
## Best Used On
- **Timeframe:** Daily (recommended), Weekly
- **Instruments:** Stocks, Indices, ETFs
- Works well on trending instruments where EMA stacking is meaningful
---
## Notes
- This strategy does **not** use candle body filters, volume filters, or session time windows — keeping it universally applicable across timeframes and instruments
- One trade per direction per day is enforced by default to avoid overtrading
- Both CE (long) and PE (short) trades cannot be open simultaneously
---
⚠️ **Disclaimer:** This strategy is for educational and backtesting purposes only. Past performance does not guarantee future results. This is not financial advice. Always do your own research and consult a qualified financial advisor before making any trading decisions. אסטרטגייה

אינדיקטור

אינדיקטור

אינדיקטור

אינדיקטור