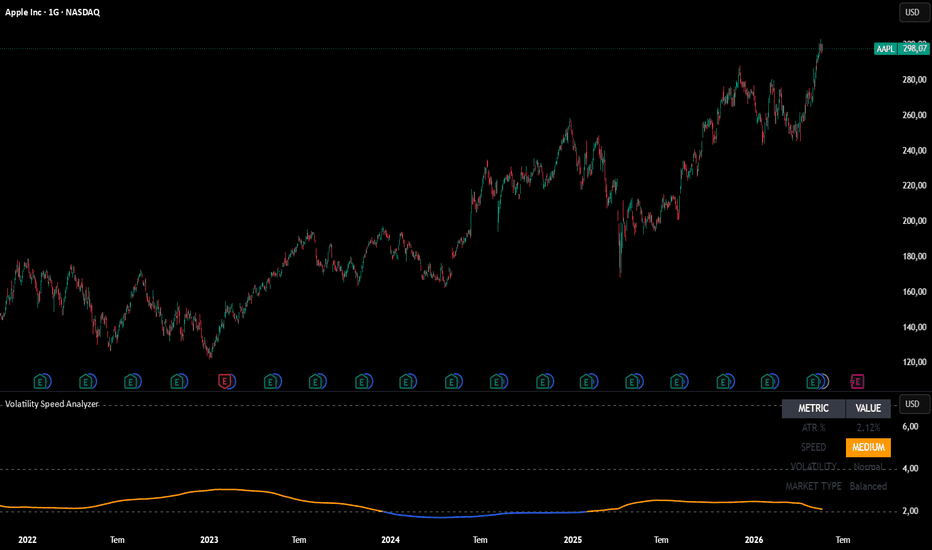
VWAP Daily Bands StandardVWAP Daily Bands is a volume-weighted average price indicator anchored to the daily session, enhanced with adaptive standard deviation bands designed to work accurately across all asset classes — including Forex, Crypto, Commodities, Indices, and Stocks.
━━━━━━━━━━━━━━━━━━━━━━━━━━━━━
THE PROBLEM THIS INDICATOR SOLVES
━━━━━━━━━━━━━━━━━━━━━━━━━━━━━
Most VWAP band implementations calculate standard deviation using only intraday price variance. This creates a well-known flaw: at the start of each session, when very few bars have been processed, the bands collapse to near zero and are practically useless. As the session progresses, the bands gradually widen — but asymmetrically, because early price swings distort the variance calculation.
This indicator solves that with a fixed daily ATR seed.
━━━━━━━━━━━━━━━━━━━━━━━━━━━━━
HOW THE ATR SEED WORKS
━━━━━━━━━━━━━━━━━━━━━━━━━━━━━
Before the session opens, the indicator fetches the previous day's closing price and ATR from the daily timeframe. These two fixed values are used to calculate a minimum band width that holds constant throughout the entire trading day — it does not fluctuate with intraday price movement.
The standard deviation used for the bands is then taken as the larger of two values: the real-time intraday price variance, or the fixed ATR-based seed variance. This means the bands are always at least as wide as the prior day's volatility warrants, while still expanding naturally when intraday price action is more volatile than usual.
The result is symmetric, stable bands from the very first bar of the session.
━━━━━━━━━━━━━━━━━━━━━━━━━━━━━
PROXY VOLUME ENGINE
━━━━━━━━━━━━━━━━━━━━━━━━━━━━━
Many brokers and CFD platforms do not provide real volume data. Without volume, a VWAP calculation loses its core meaning.
This indicator includes a built-in Proxy Volume Engine that automatically detects the current symbol and maps it to a liquid equivalent source with real volume data. For example, XAUUSD is mapped to COMEX:GC1!, EURUSD to FX:EURUSD, BTCUSD to BINANCE:BTCUSDT, and so on — covering over 80 symbols across all major asset classes. If the platform provides native volume, it is used directly. If not, the proxy volume is applied transparently with no action required from the user.
━━━━━━━━━━━━━━━━━━━━━━━━━━━━━
WHAT IS PLOTTED
━━━━━━━━━━━━━━━━━━━━━━━━━━━━━
• VWAP (white) — daily anchor VWAP calculated from HLC3, reset at the start of each session, weighted by effective volume.
• Upper bands (cyan) — 1σ, 2σ, and 3σ above the VWAP, indicating potential resistance or overbought zones.
• Lower bands (red) — 1σ, 2σ, and 3σ below the VWAP, indicating potential support or oversold zones.
━━━━━━━━━━━━━━━━━━━━━━━━━━━━━
SETTINGS
━━━━━━━━━━━━━━━━━━━━━━━━━━━━━
• Show Daily VWAP — toggle the VWAP line on or off.
• Show Band 1σ / 2σ / 3σ — toggle each band pair individually.
• Band Width Multiplier — scales all bands up or down proportionally (default 1.0).
• Daily ATR Period — controls how many days are used to calculate the ATR seed (default 5).
━━━━━━━━━━━━━━━━━━━━━━━━━━━━━
COMPATIBLE WITH
━━━━━━━━━━━━━━━━━━━━━━━━━━━━━
Forex majors, minors and exotics · Crypto (via Binance) · Gold, Silver, Platinum, Palladium · Oil and Natural Gas · Agricultural commodities · US Dollar Index · Major global indices: DOW, NASDAQ, S&P 500, Nikkei, DAX, FTSE, CAC, MIB, ASX, Hang Seng · Top US and European stocks.
━━━━━━━━━━━━━━━━━━━━━━━━━━━━━
NOTES
━━━━━━━━━━━━━━━━━━━━━━━━━━━━━
The VWAP calculation uses Pine Script's native HLC3-based volume-weighted average price as its mathematical foundation. The ATR seed mechanism, Proxy Volume Engine, and adaptive band logic are original contributions developed specifically for this indicator to address real limitations found in standard VWAP band implementations. אינדיקטור

אינדיקטור

אינדיקטור
אסטרטגייה

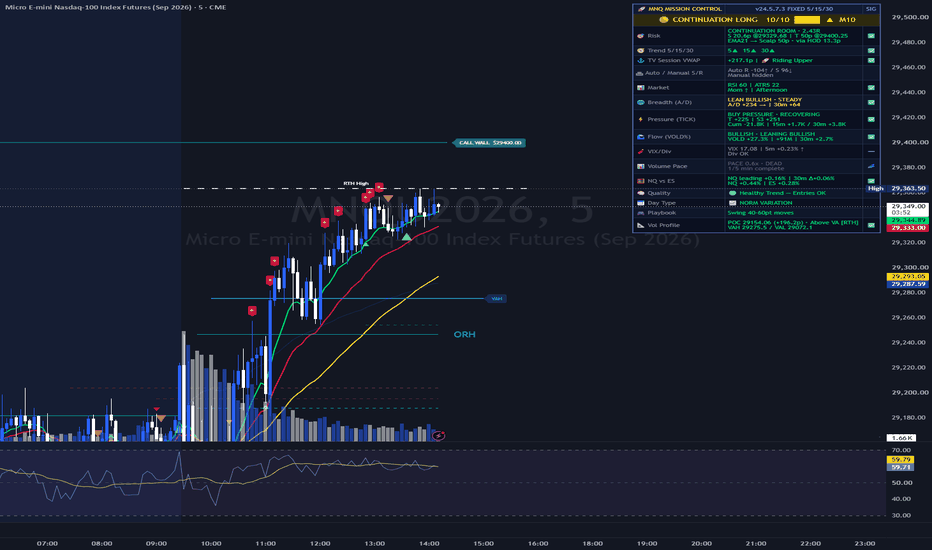
MNQ Mission Control - Smart Block v8Overview
MNQ Mission Control is a comprehensive decision-support dashboard built for intraday futures traders, specifically tuned for NQ/MNQ and ES/MES. Rather than producing buy/sell arrows, it acts as an accountability layer — synthesizing market internals, multi-timeframe trend structure, momentum, support/resistance proximity, and real-time risk/reward into a single unified score that helps traders avoid impulsive entries and stay aligned with higher-probability setups.
The core philosophy: a good dashboard tells you when NOT to trade just as clearly as when to engage. Signals are gated by R:R viability, trend alignment, and breadth confirmation, so the dashboard will actively block trades that look directionally correct but are structurally late or poorly located.
Key Features
Unified Scoring System (0–8 scale)
A dynamic scoring engine that scales based on data availability, weighing trend alignment, momentum, VWAP positioning, internals confirmation, and quality factors. Score is displayed alongside a master state: WAIT, LONG, SHORT, LONG BLOCKED, or SHORT BLOCKED.
NYSE Market Internals Integration
USI:ADD (Advance/Decline) with cumulative tracking and divergence detection
USI:TICK with 30-minute cumulative roll and high/low extremes
USI:VOLD (Volume Difference) with delta tracking
VIX with configurable symbol input (supports TVC:VIX or CBOE:VIX) and trend direction
Cumulative TICK breadth divergence detection vs. price
Configurable Internals Refresh Timeframe
A dedicated input for the internals data refresh timeframe (default suitable for 30s/1m) to balance data freshness against repaint noise.
Multi-Timeframe Trend Engine
A 5/15 trend reading combines lower-timeframe momentum with higher-timeframe structure, producing readings like ▼▼ ALIGNED BEAR, ▲▲ ALIGNED BULL, or mixed states.
VWAP Band Positioning
Real-time classification of price relative to VWAP and its standard deviation bands (Upper Band, Mid-band, Lower Band) with point distance from VWAP.
Array-Based Support/Resistance Management
Dynamic S/R line detection with forward extension, automatic recycling for memory efficiency, and proximity-based level scoring. Resistance levels are framed as decision checkpoints, not automatic exit targets.
Risk/Reward Panel
ATR-based stop distance calculation paired with the nearest logical target (next S/R level), producing a live R:R ratio. The scoring engine uses this to block trades with unfavorable R:R, even when directional signals are otherwise valid.
Quality & Day Type Classification
Quality readings: Trend OK, Trend Expansion, Seller/Buyer Fatigue, Chop, Lunch Chop
Day Type detection: NORM VARIATION, TREND DAY, with live confirmation
Contextual Playbook Field
Strategy guidance that adapts to current conditions — e.g., "Swing 40-60pt moves" in normal variation, "Trend override: hold runners" once a trend day confirms, prompting traders to manage existing positions rather than initiate new entries late in extended moves.
Divergence Detection
Cumulative TICK vs. price divergence with bull/bear labels and visual indicators on the dashboard.
How to Use
Add the indicator to your NQ/MNQ or ES/MES chart (5m or 3m recommended for the primary execution timeframe).
Configure the VIX symbol input to match the feed you monitor elsewhere (TVC:VIX or CBOE:VIX — these can diverge slightly).
Set the Internals Refresh Timeframe based on your preference for freshness vs. stability (30s for active scalping, 1m for swing/positional intraday).
Read the dashboard top-down: Master score → Risk/Reward → Trend → VWAP → Levels → Market state → Internals → VIX → Quality → Day Type → Playbook.
Respect the BLOCKED states. If the dashboard says SHORT BLOCKED with a poor R:R, the directional bias is correct but the entry location is not. Wait for a pullback that improves R:R.
Combine timeframes. A WAIT on the lower TF with a clear directional bias on the higher TF often signals "wait for pullback, then engage."
Recommended Settings
Primary chart: 5m for execution, 3m for aggressive scalping
Secondary chart: 30m for higher-timeframe context
Internals refresh: 1m (balanced) or 30s (responsive)
VIX symbol: Match the feed used elsewhere in your platform
Session: Designed for RTH (9:30–16:00 ET) but functional in pre/post-market with reduced internals reliability
Notes & Disclaimers
Market internals ( USI:ADD , USI:TICK , USI:VOLD ) require NYSE data subscription for accurate real-time values.
VIX feed source matters: TVC:VIX and CBOE:VIX can produce slightly different values due to different update cadences and aggregation. Match this input to whatever you display elsewhere.
This indicator is a decision-support tool, not a signal generator. No indicator removes the need for risk management, position sizing discipline, or trade management skill.
Past performance of any condition or signal does not guarantee future results. Futures trading involves substantial risk of loss.
The "accountability buddy" framing is intentional: the dashboard's primary value is helping you slow down, evaluate context, and avoid low-quality entries — not replacing your judgment. אינדיקטור
SK AI + HD + EQH/EQL Scoring v6.5 CVD SK AI + HD + EQH/EQL Scoring v6.5 CVD
ist ein fortgeschrittener Multi-Faktor TradingView-Indikator für Crypto-Scalping und Intraday-Trading. Das Script kombiniert AI-Trendlogik, adaptive SuperTrend-/LuxAlgo-ähnliche Trailing-Systeme, EQH/EQL-Liquidity Sweeps, Liquidity-Delta-Reversal-Erkennung, CVD-/Moneyflow-Analyse sowie VWAP-, POC-, Fibonacci- und MTF-Trendfilter zu einem gewichteten Scoring-System.
Hauptfunktionen:
AI Neural Trend Engine als primärer Trendfilter
Adaptiver HD/Lux SuperTrend mit Volatilitätsanpassung
EQH/EQL Liquidity Sweep & Reversal Detection
Liquidity Delta Profiler mit Rejection-, Divergence-, Absorption- und Exhaustion-Erkennung
Spot-/Futures-CVD und Moneyflow-Analyse
Multi-Timeframe EMA- und ADX-Bias
VWAP-, POC- und Fibonacci-Konfluenz-Scoring
Dynamisches Score-System für Long-/Short-Signale
Signalqualitäten: WEAK / GOOD / STRONG
Integriertes Risiko-Management mit:
Entry
Stop Loss
Break-Even
TP1 / TP2
Kapitalrisiko %
Dashboard mit Live-Marktstatus und Signalbewertung
Alert-System für TradingView/WunderTrading-Webhooks
Das Script ist darauf ausgelegt, Fehlsignale durch Konfluenz mehrerer Marktstrukturen und Orderflow-/Liquidity-Faktoren zu reduzieren und qualitativ hochwertige Long-/Short-Setups visuell und automatisiert bereitzustellen. אינדיקטור

אינדיקטור

אינדיקטור

אינדיקטור

אינדיקטור

MTF Market State DashboardA multi-timeframe market context dashboard designed to classify market conditions using three independent analytical layers: Trend direction, Trend strength and Participation / Volume flow
Instead of relying on a single indicator or isolated signal, this script combines multiple forms of market information into a structured decision framework intended to help traders evaluate the quality and maturity of a market condition.
The goal of the dashboard is not to predict tops or bottoms, but to help identify:
• aligned market conditions
• conflicting conditions
• strengthening trends
• weakening trends
• and low-conviction environments
Core Idea Behind The Script
Many indicators work well in certain environments and poorly in others.
For example:
• Trend indicators may continue showing bullish conditions during weakening momentum.
• Momentum indicators may react aggressively inside consolidations.
• Volume indicators may show temporary spikes without broader trend confirmation.
This script was built to reduce that fragmentation by separating market behavior into three independent layers:
1. Direction
Defines where the market is currently biased.
2. Strength
Measures whether the move has enough momentum to sustain itself.
3. Participation
Evaluates whether price movement is supported by broader volume-flow behavior.
The dashboard then combines these layers into a unified market-state classification system.
What The Dashboard Tracks
1. Trend Structure Layer
The script evaluates directional bias using:
EMA 200
Used as the higher-level directional filter.
Typical interpretation:
• Price above EMA 200 → bullish macro bias
• Price below EMA 200 → bearish macro bias
EMA 50
Tracks intermediate trend behavior and shorter-term structural changes.
Supertrend
Used as a dynamic trend confirmation layer.
Unlike a static moving average, the Supertrend adapts to volatility and helps identify directional transitions more quickly.
Each trend component is displayed as:
• BULL
• BEAR
along with an “age” value showing how many bars have passed since the last state change.
This allows traders to distinguish between:
• fresh transitions
• mature trends
• and potentially exhausted conditions
2. Trend Strength Layer
ADX (via DMI)
ADX is used to measure trend strength, not trend direction.
Typical interpretation:
• Low ADX → weak or ranging environment
• Rising / high ADX → stronger directional environment
This distinction matters because bullish conditions inside weak trend environments often behave differently from bullish conditions inside expanding trends.
The script uses ADX as a confirmation filter inside the Market State logic.
3. Participation & Volume-Flow Layer
This layer attempts to measure whether directional movement is being supported by participation and flow behavior.
CMF (Chaikin Money Flow)
CMF estimates buying versus selling pressure by evaluating closing location relative to range and volume.
General interpretation:
• Positive CMF → accumulation pressure
• Negative CMF → distribution pressure
CDV (Cumulative Delta Volume Proxy)
Pine Script does not provide true bid/ask delta data.
This script therefore uses a candle-based directional volume proxy to estimate cumulative directional participation.
The CDV layer classifies conditions as:
• Rising
• Falling
• Neutral
Adaptive filtering is included to reduce minor fluctuations and noise.
OBV Breakout Detection
The script also evaluates whether On-Balance Volume is breaking above or below recent ranges.
This is used to identify:
• expanding participation
• weakening participation
• or neutral flow conditions
The OBV component is not intended as a standalone signal generator, but rather as an additional confirmation layer inside the broader market-state framework.
Market State Classification
One of the main purposes of the script is to convert multiple independent readings into a simplified market-state output.
The dashboard derives a “Market State” by combining:
• Trend direction
• Trend strength
• Participation / flow confirmation
Possible classifications include:
• Strong Bull Context
• Bull Context
• Mixed / Wait
• Bear Context
• Strong Bear Context
The classification is not predictive and should not be interpreted as financial advice.
Instead, it is intended to provide a structured summary of current market conditions.
How Market State Is Derived
The logic combines three internal scoring groups:
Trend Score
Built from:
• EMA 200 state
• EMA 50 state
• Supertrend state
Participation Score
Built from:
• CMF bias
• CDV direction
• OBV breakout state
Strength Filter
Built from:
• ADX threshold validation
Example:
• bullish trend structure
• bullish participation
• and strong ADX
→ may classify as “Strong Bull Context”
Whereas:
• bullish trend structure
• weak participation
• and weak ADX
→ may classify as “Mixed / Wait”
This allows the dashboard to identify agreement and disagreement between independent analytical layers.
Multi-Timeframe Logic
The script supports:
• single timeframe mode
• dual timeframe mode
Typical usage example:
• Lower timeframe → execution context
• Higher timeframe → broader directional context
This allows traders to compare:
• local conditions
• against higher timeframe structure
without switching charts repeatedly.
Age Tracking
Each directional state includes an “age” measurement representing the number of bars since the last directional transition.
This is included because newer transitions and older trends may behave differently.
Example:
• Low age → newer condition
• High age → more mature condition
The script does not assume older trends will reverse, but age can provide additional context about trend maturity.
Practical Interpretation
Example: Higher-Conviction Bullish Environment
Possible characteristics:
• EMA structure bullish
• Supertrend bullish
• ADX elevated
• CMF positive
• CDV rising
• OBV breakout bullish
This may indicate alignment between:
• trend
• momentum
• and participation
Example: Mixed Environment
Possible characteristics:
• bullish EMA structure
• falling CDV
• weak ADX
• neutral OBV behavior
This may indicate:
• weakening momentum
• transition behavior
• or lower-conviction conditions
Intended Usage
The script is designed as:
• a context tool
• a filtering framework
• and a market-state dashboard
It is not intended to replace:
• risk management
• execution models
• or broader trading plans
The dashboard is generally most useful when combined with:
• breakout systems
• pullback systems
• trend-following models
• or discretionary execution methods
Customization Options
The script includes:
• 1TF / 2TF modes
• configurable EMA lengths
• Supertrend settings
• ADX threshold controls
• CDV sensitivity adjustment
• OBV breakout lookback settings
• Table themes
• Text sizing
• Dashboard positioning
Notes
• CDV uses a candle-based proxy because true bid/ask delta data is unavailable in Pine Script.
• The dashboard focuses on contextual interpretation rather than direct entry signals.
• The Market State classification is derived from internal scoring logic and should be interpreted as a contextual summary, not a prediction engine.
Summary
This dashboard was designed to organize multiple forms of market information into a single structured framework.
Rather than treating trend, momentum, and participation separately, the script attempts to evaluate how they interact with each other across one or more timeframes.
The result is a compact market-context tool intended to help traders:
• identify alignment
• recognize conflict
• filter weaker conditions
• and evaluate overall market structure more efficiently.
אינדיקטור

אינדיקטור
אינדיקטור

אסטרטגייה
Triple Lens by MOUTriple Lens by MOU
After spending years burning money on candlestick patterns, MACD crossovers, and Elliott Waves, I came to a simple conclusion: most retail technical analysis has been arbitraged into oblivion by quant funds. What survives — and what still works — sits in three places that machines can't fully eat: trend stage, accumulation pattern, and market breadth.
This indicator is what I built for my own trading. It overlays three independent frameworks from three legendary technicians:
Stan Weinstein — Stage Analysis (where are we in the cycle?)
William O'Neil — CANSLIM accumulation (is smart money building?)
Walter Deemer — Market Breadth (is the broader tape supporting us?)
Each lens looks at a completely different dimension. When all three light up green at the same time, you get a ▲ signal on the chart. That's the moment to pay attention.
Why three? Because any single indicator gets gamed. But three independent signals confirming the same direction is a different statistical animal — it's confluence, not coincidence.
One thing I want to be honest about: this isn't a crystal ball. Technical analysis cannot predict the future, period. What a good system can do is take you from 50/50 coin-flip entries to maybe 60-70% odds. That's it. But over hundreds of trades, that edge compounds — and that's where real wealth is built.
A ▲ signal is your green light to consider entering, not a guarantee that you'll win every time. Sizing, stops, and risk management still matter.
Important: This indicator goes blind during earnings. Earnings re-price the fundamentals — and technical analysis is built on the assumption that fundamentals are stable. If a ▲ fires right before an earnings call, wait it out. Let the dust settle, then re-evaluate.
Free to use. No tweaking needed. Built for swing and position traders on daily/weekly timeframes.
If this helps you, drop a boost. If you have feedback, comments are open.
— MOU אינדיקטור

אינדיקטור

אינדיקטור

אינדיקטור
אינדיקטור
אינדיקטור
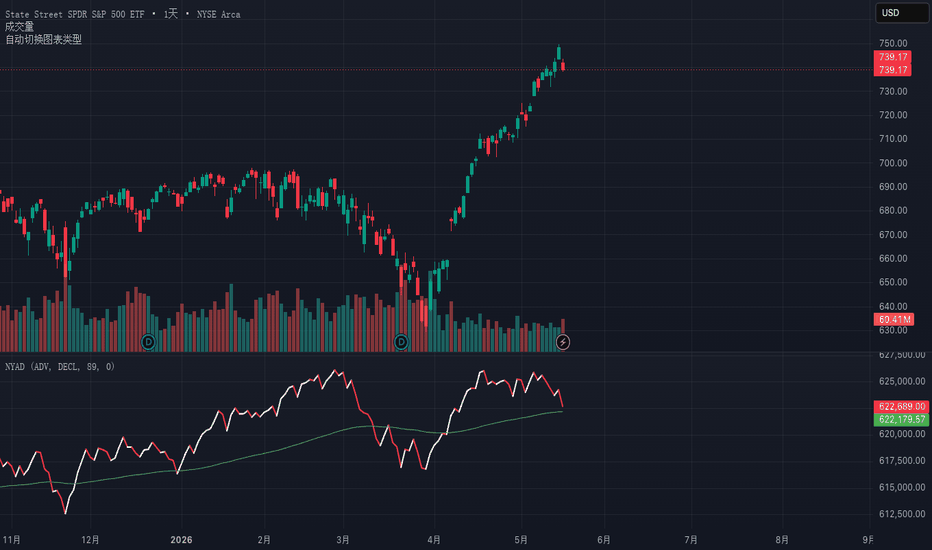
NYSI 8EMA - NYSE McClellan Summation IndexThis indicator plots the NYSE McClellan Summation Index (NYSI), a market breadth indicator based on NYSE advancing and declining issues. It first calculates the ratio-adjusted net advances, then derives the McClellan Oscillator using the difference between the 19-day and 39-day EMAs, and finally accumulates the oscillator to form the NYSI. An 8-day EMA is also included as a short-term trend reference, helping users evaluate market breadth strength, trend shifts, and the relationship between the NYSI and its moving average. A rising NYSI generally suggests improving internal market participation, while a falling NYSI may indicate weakening breadth. Since the NYSI is a cumulative indicator, its absolute value may vary across data vendors, historical starting points, and initialization methods. For this reason, the script includes a Calibration Offset so users can align the indicator with their preferred reference source. This indicator is intended for market breadth analysis and research only and should not be considered investment advice.
本指标用于绘制 NYSE McClellan Summation Index(NYSI,麦克莱伦累加指数),通过 NYSE 上涨家数与下跌家数计算 ratio-adjusted net advances,并进一步使用 19 日 EMA 与 39 日 EMA 的差值得到 McClellan Oscillator,再将其累加形成 NYSI。指标同时提供 8 日 EMA 作为短期趋势参考,帮助观察市场广度的中期强弱、趋势拐点以及 NYSI 与均线之间的关系。NYSI 上升通常代表市场内部参与度改善,下降则可能表示市场广度走弱。由于 NYSI 是累计型指标,其绝对数值可能会因数据源、历史起点和初始化方式不同而与其他平台存在差异,因此本脚本加入了 Calibration Offset,方便用户根据自己的参考数据进行校准。本指标仅用于市场广度分析和研究,不构成投资建议。
אינדיקטור

אינדיקטור

אינדיקטור