Trend Momentum Confluence🇷🇺 На русском
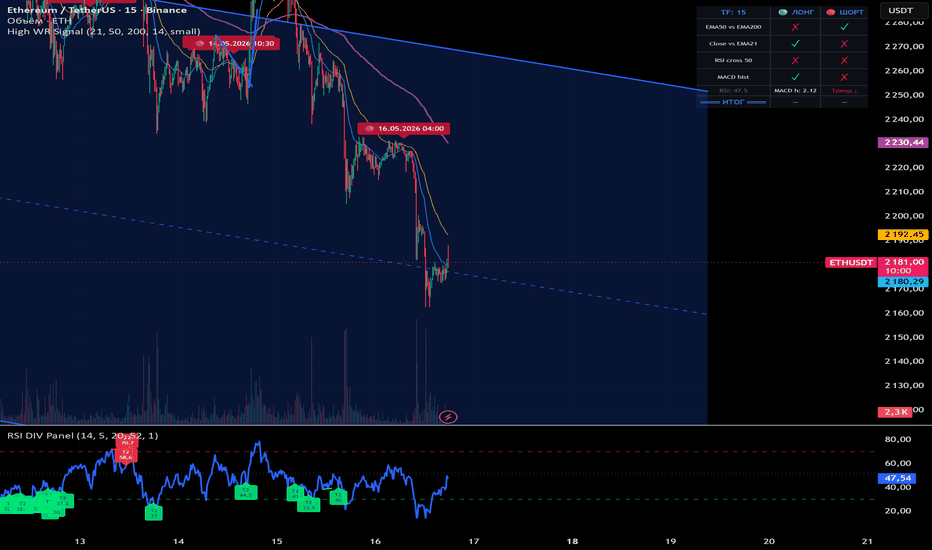
High WR Signal — высоковероятные сигналы по тренду
Краткое описание
Индикатор для поиска точек входа с высокой вероятностью отработки. Подаёт сигнал только когда совпадают четыре независимых условия: глобальный тренд, краткосрочный тренд, разворот импульса и подтверждение момента. Работает на любом таймфрейме и любом активе.
Как работает
В основе — комбинация трёх классических инструментов: трёх EMA, RSI и MACD. Сигнал появляется только тогда, когда все они согласованы.
🟢 Сигнал ЛОНГ — выполняются одновременно:
EMA 50 > EMA 200 — глобальный тренд направлен вверх
Close > EMA 21 — цена выше краткосрочной скользящей
RSI пересекает 50 снизу вверх — импульс разворачивается в сторону покупателей
MACD гистограмма > 0 — подтверждение бычьего момента
🔴 Сигнал ШОРТ — зеркальные условия:
EMA 50 < EMA 200 — глобальный тренд вниз
Close < EMA 21 — цена ниже краткосрочной скользящей
RSI пересекает 50 сверху вниз — импульс уходит к продавцам
MACD гистограмма < 0 — подтверждение медвежьего момента
Почему высокий Win Rate
Входы только по тренду — никаких контртрендовых сделок
Сигнал требует одновременного совпадения 4 условий, что отсекает шум
RSI cross 50 ловит точку перелома силы, а не перекупленность/перепроданность
MACD служит фильтром: даже при разворотах RSI ложные сигналы отсеиваются
Возможности
⚙️ Настраиваемые периоды EMA и RSI
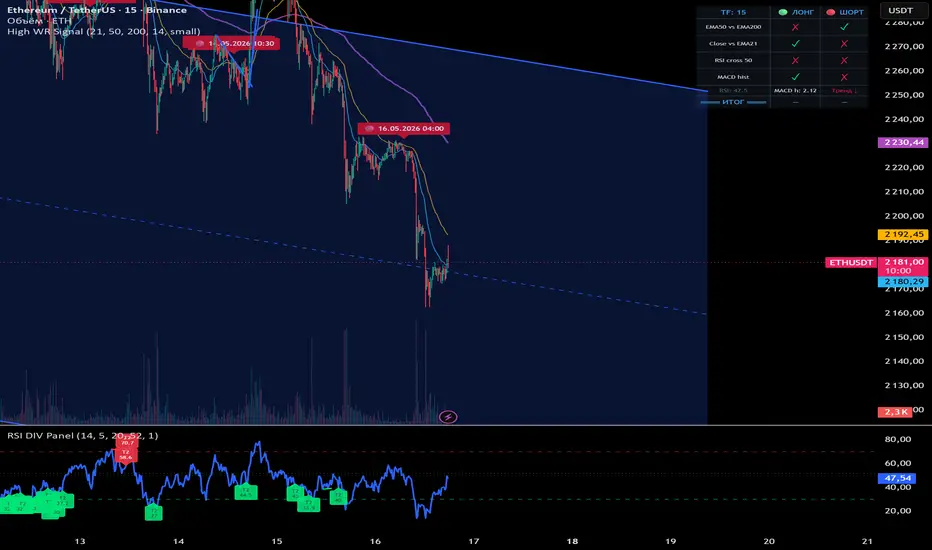
📊 Таблица текущего состояния всех условий в реальном времени
🏷️ Метки сигналов с датой и временем прямо на графике
🔔 Три типа алертов: ЛОНГ, ШОРТ и универсальный
🤖 Поддержка alert() с webhook для автоматизации (боты, биржи)
🛡️ Опция «только на закрытии свечи» — защита от repaint
🎨 Настройка размера меток и отображения EMA
Как использовать
Добавьте индикатор на график любого таймфрейма
Дождитесь появления зелёной или красной метки
Сверьтесь с таблицей в правом верхнем углу — все 4 галочки должны стоять
Для алертов: Alt+A → выберите High WR Signal → нужный сигнал → Once Per Bar Close
Алерты автоматически привязываются к таймфрейму графика: создали на 15m — будут срабатывать по 15-минутным свечам, создали на 1H — по часовым. Можно создавать сколько угодно алертов на разных ТФ параллельно.
Рекомендуемые таймфреймы: 30m, 1H, 2H, 4H. На младших ТФ возможен повышенный шум.
⚠️ Индикатор не является финансовой рекомендацией. Используйте вместе с риск-менеджментом и собственным анализом.
🇬🇧 In English
High WR Signal — High-Probability Trend Signals
Short description
An indicator that finds high-probability entry points by combining four independent confirmations: global trend, short-term trend, momentum reversal and momentum confirmation. Works on any timeframe and any asset.
How it works
Based on a combination of three classic tools: three EMAs, RSI and MACD. A signal is generated only when all of them agree.
🟢 LONG signal — all conditions met simultaneously:
EMA 50 > EMA 200 — global uptrend
Close > EMA 21 — price above short-term moving average
RSI crosses 50 upward — momentum shifts to buyers
MACD histogram > 0 — bullish momentum confirmation
🔴 SHORT signal — mirrored conditions:
EMA 50 < EMA 200 — global downtrend
Close < EMA 21 — price below short-term moving average
RSI crosses 50 downward — momentum shifts to sellers
MACD histogram < 0 — bearish momentum confirmation
Why high Win Rate
Entries are trend-aligned only — no counter-trend trades
Signal requires 4 simultaneous conditions to filter out noise
RSI crossing 50 catches the momentum shift, not overbought/oversold extremes
MACD acts as an additional filter against false RSI signals
Features
⚙️ Configurable EMA and RSI periods
📊 Real-time conditions dashboard
🏷️ Signal labels with timestamp directly on the chart
🔔 Three alert types: LONG, SHORT, and Any Signal
🤖 alert() support with webhook for automation (bots, exchanges)
🛡️ "Bar close only" option — repaint protection
🎨 Customizable label sizes and EMA display
How to use
Add the indicator to any chart and any timeframe
Wait for a green or red label to appear
Check the dashboard in the top-right corner — all 4 conditions should be ✓
For alerts: Alt+A → select High WR Signal → choose alert type → Once Per Bar Close
Alerts are automatically tied to the chart's timeframe: an alert created on 15m fires on 15-minute candles, one created on 1H fires on hourly candles. You can run multiple alerts across different timeframes in parallel.
Recommended timeframes: 30m, 1H, 2H, 4H. Lower timeframes may produce more noise.
⚠️ This indicator is not financial advice. Use together with proper risk management and your own analysis. אינדיקטור
אינדיקטור

my Style Combo IndicatorwtChannelLen = input.int(10, "WT Channel Length")
wtAverageLen = input.int(21, "WT Average Length")
wtMaLen = input.int(4, "WT Signal Length")
emaFastLen = input.int(20, "Fast EMA")
emaMidLen = input.int(50, "Mid EMA")
emaSlowLen = input.int(200, "Slow EMA")
macdFast = input.int(12, "MACD Fast")
macdSlow = input.int(26, "MACD Slow")
macdSignal = input.int(9, "MACD Signal")
obLevel = input.int(60, "Overbought")
osLevel = input.int(-60, "Oversold")
אינדיקטור

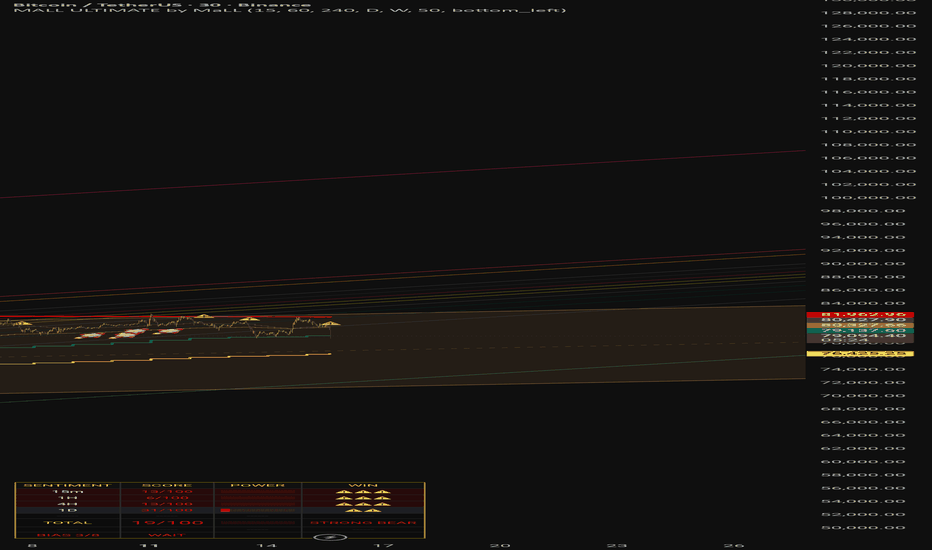
ULTIMATE SYSTEM by MaLLULTIMATE SYSTEM — EMA Structure + Multi-TF Sentiment + Bias Filter
by MaLL
One chart. One system. No noise.
MALL ULTIMATE combines three independent edge layers into a single clean overlay — giving you HTF structure, real-time sentiment, and directional bias simultaneously, without cluttering your chart with unnecessary indicators. LAYER 1 — HTF EMA STRUCTURE
Daily and 4H EMAs (21 / 55 / 200) rendered directly on any timeframe chart. See the big picture compression and expansion at a glance. Know exactly where price sits relative to the major moving averages that institutions actually watch — without switching timeframes. LAYER 2 — MULTI-TIMEFRAME SENTIMENT ENGINE
Eight technical confluence factors scored simultaneously across 15min, 1H, 4H, and 1D — each vote contributing to a weighted total score (0–100). The scoreboard shows who controls each timeframe in real time.
Factors measured per TF: candle direction, close position in range, EMA stack alignment, RSI zone, MACD histogram, volume confirmation, Stochastic positioning, Higher High / Lower Low structure.
Signals appear only when 15min + 1H + 4H align simultaneously above threshold. Double signal when all 4 TF confirm. Built-in cooldown eliminates spam — every 🚀 or ⚠️ means something. LAYER 3 — HTF BIAS FILTER 2026
Eight-point macro scoring system built specifically for the BTC 2026 market structure — volatile, recovery-driven, with sharp bear traps and relief rallies that destroy undisciplined shorts.
Measures: Weekly candle direction, Weekly EMA position, Daily candle, Daily EMA 21/55/200 positioning, EMA stack alignment, and Recovery Mode detection.
SHORT BAN activates automatically when the market is in recovery phase — the feature built directly from months of painful experience shorting relief rallies. אינדיקטור
אינדיקטור

אינדיקטור

אינדיקטור
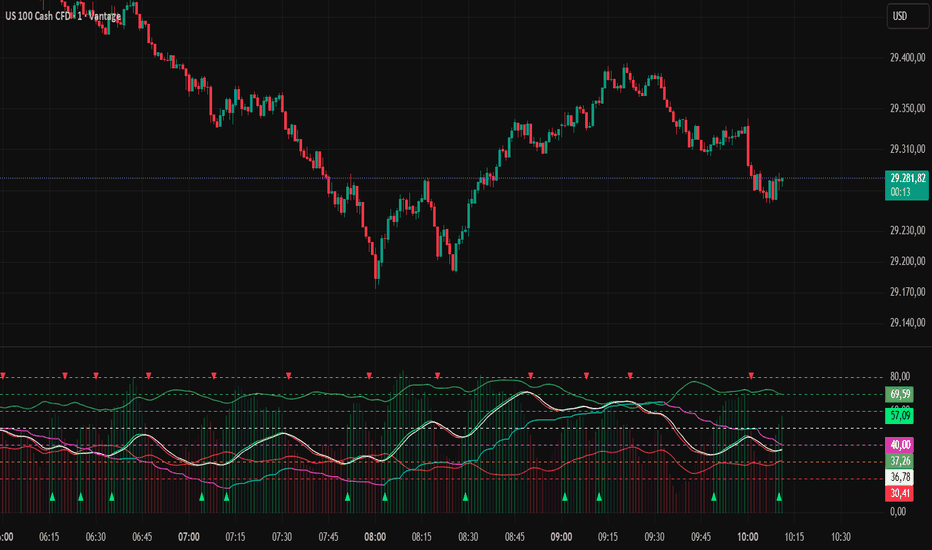
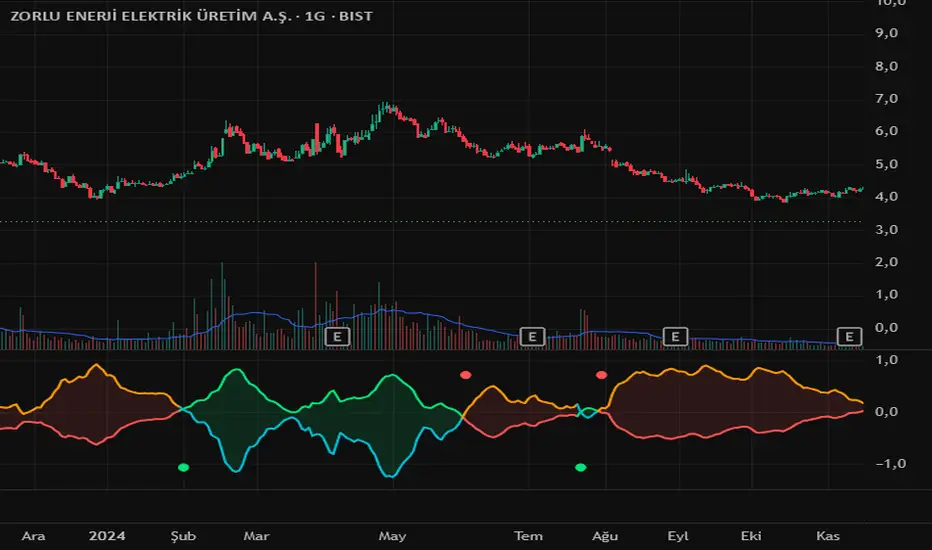
Mirror MomentumThis indicator uses a mirror-based momentum structure built on an adaptive center axis.
Unlike traditional inverted indicators that simply negate price or apply static transformations, this model introduces a dynamic reflection mechanism:
Price is mirrored around a moving EMA-based center
This creates an adaptive reflection axis that evolves with market structure
The mirrored signal is then combined with smoothed momentum
mirrorMomentum = (2 * (center - price)) + momentum
Core Components
Symmetry mapping (reflection around a dynamic center)
Momentum injection (trend force embedded into the mirrored structure)
Adaptive distortion (volatility reshaping the mirror behavior)
This results in a dual-sided momentum oscillator that captures both directional movement and its reflected pressure.
It is not a simple inverse price oscillator, but a center-based adaptive mirrored momentum system.
Structural Interpretation (Important)
The indicator evaluates the distance (spread) between momentum and its mirrored structure as a measure of internal trend strength.
Wide separation between lines → strong trend expansion (trend continuation phase)
Narrowing of the lines → compression phase (trend exhaustion or potential reversal zone)
In addition, extreme wide expansion zones often correspond to major tops and bottoms, meaning that signals tend to behave more reliably within trending conditions.
Therefore, signals are generally more suitable for trend-following confirmation rather than standalone prediction, and the structure is better interpreted visually for identifying potential reversal zones.
🇹🇷 Türkçe Açıklama
Bu indikatör, dinamik merkez ekseni üzerine kurulu mirror (ayna) tabanlı bir momentum yapısı kullanır.
Klasik tersleme indikatörlerinden farklı olarak (sadece fiyatı negatiflemek veya sabit çevirme yapmak gibi), bu model adaptif bir yansıma mekanizması içerir:
Fiyat, EMA tabanlı hareketli bir merkez etrafında yansıtılır
Bu sayede piyasa yapısına göre değişen bir “dinamik ayna ekseni” oluşur
Daha sonra bu yansıma, momentum ile birleştirilir
mirrorMomentum = (2 * (center - price)) + momentum
Temel Bileşenler
Simetri haritalaması (dinamik merkez etrafında yansıma)
Momentum enjeksiyonu (trend gücünün yapıya eklenmesi)
Adaptif bozulma (volatiliteye göre şekil değiştiren ayna davranışı)
Bu yapı, hem yönü hem de karşıt hareketi yakalayan çift taraflı bir momentum osilatörü üretir.
Bu sistem klasik “inverse price” indikatörü değildir; merkez bazlı adaptif mirror momentum yapısıdır.
Yapısal Yorum (Önemli)
İndikatör, momentum ile mirror yapı arasındaki mesafeyi (spread’i) trend gücü olarak yorumlar.
Çizgilerin geniş açılması → güçlü trend genişlemesi (trend devam fazı)
Çizgilerin daralması → sıkışma (zayıflama / olası dönüş bölgesi)
Ayrıca en geniş açılma bölgeleri genellikle majör tepe ve dip bölgelerine denk gelir, bu yüzden sinyaller trend koşullarında daha sağlıklı çalışır.
Bu yapı, tek başına tahmin aracı olmaktan çok trend takibi ve görsel analiz için daha uygundur, özellikle dönüş bölgelerini gözle okumak için güçlü bir yapı sunar. אינדיקטור

Zweig Breadth Thrust + Divergence█ OVERVIEW
This indicator implements Martin Zweig's Breadth Thrust signal and adds a pivot-based breadth divergence detector. The thrust identifies rare, high-conviction moments when the market shifts explosively from oversold to overbought breadth within a compressed time window. The divergence layer provides ongoing analytical value between thrust events by flagging when price and breadth participation diverge at swing points.
The formula follows Greg Morris's documentation in The Complete Guide to Market Breadth Indicators (2nd ed., 2015), Chapter 5. All parameters match Zweig's original specification and are configurable for experimentation.
═══════════════════════════════════════════════════════════════════
█ ZWEIG BREADTH THRUST
Formula
Breadth Ratio = Advances / (Advances + Declines)
Ratio EMA = EMA(Breadth Ratio, 10)
The indicator uses NYSE advancing and declining issues via USI:ADV and USI:DECL .
Signal logic
The thrust is a state machine with three phases:
• ARMED: The ratio EMA drops below 0.40, indicating deeply oversold breadth. The indicator begins counting bars.
• THRUST: If the ratio EMA then rises above 0.615 within 10 bars, the thrust signal fires. A green triangle marks the bar where the signal completes.
• FAILED: If 10 bars elapse without the ratio EMA reaching 0.615, the window expires and the indicator returns to idle. It must drop below 0.40 again to re-arm.
If the ratio EMA drops below 0.40 again while already armed, the bar counter resets. Per Morris: "Once it moves from below 0.4 to above it, the signal occurs when it then moves above 0.615. If it has not done that within 10 days it has to start over from below 0.4."
An orange background highlights bars where the indicator is in the armed state.
Historical context
Thrust signals are rare. Morris documents 8 occurrences between 1965 and 2014: December 1971, October 1974, January 1975, August 1982, August 1984, March 2009, October 2011, and October 2013. Additional signals have fired since, including November 2023 and April 2025. Zweig's research found an average gain of 24.6% in the 11 months following a thrust, and most bull markets begin with one.
═══════════════════════════════════════════════════════════════════
█ BREADTH DIVERGENCE
The divergence detector identifies when the reference index price and the breadth ratio EMA disagree at swing points:
• Bearish divergence: Price makes a higher swing high while the ratio EMA makes a lower swing high. Participation is narrowing even as price pushes to new highs.
• Bullish divergence: Price makes a lower swing low while the ratio EMA makes a higher swing low. Breadth is improving even as price deteriorates.
Swing highs and lows are identified using pivot detection with a configurable lookback (default: 5 bars left and right). Price and ratio pivots are tracked independently so they do not need to occur on the same bar. When a new ratio pivot is confirmed, it is compared against the two most recent price pivots (and vice versa) to identify the divergence pattern.
Divergences are drawn as dashed lines connecting the two ratio pivot points, with a label at the current pivot. Red dashed lines indicate bearish divergences; green dashed lines indicate bullish divergences.
═══════════════════════════════════════════════════════════════════
█ INDEX OVERLAY
The Reference Index setting controls which price series is used for divergence detection:
• NYSE Composite (default): Uses INDEX:NYA . The natural pairing since the breadth data is NYSE-sourced.
• S&P 500 : Uses SP:SPX . Useful for detecting divergences between NYSE breadth and S&P 500 price, which can reveal when the large-cap index is masking broader weakness.
Important: The thrust calculation always uses NYSE breadth data regardless of the index selection. TradingView does not provide S&P 500-specific advance/decline feeds. The index toggle only affects which price series the divergence detector compares against the breadth ratio.
═══════════════════════════════════════════════════════════════════
█ STATUS TABLE
A status table (position configurable) displays:
• Ratio EMA: Current value of the 10-period EMA of the breadth ratio. Color-coded green above the thrust threshold, red below the armed threshold, gray between.
• State: ARMED (orange) when the ratio EMA has dropped below 0.40 and the thrust window is open, or IDLE (gray) otherwise.
• Bars Left: Remaining bars in the thrust window before expiration.
• Last Thrust: How many bars ago the most recent thrust signal fired, or "None visible" if none has occurred in the loaded chart history.
═══════════════════════════════════════════════════════════════════
█ ALERTS
Five alert conditions are available:
• Thrust Completed: The ratio EMA moved from below 0.40 to above 0.615 within the thrust window.
• Thrust Armed: The ratio EMA dropped below 0.40, opening the thrust window.
• Thrust Failed: The thrust window expired without the ratio EMA reaching 0.615.
• Bearish Divergence: Price made a higher high while the breadth ratio EMA made a lower high.
• Bullish Divergence: Price made a lower low while the breadth ratio EMA made a higher low.
═══════════════════════════════════════════════════════════════════
█ SETTINGS
Zweig Breadth Thrust
• EMA Length: Period for the exponential moving average of the breadth ratio. Default: 10.
• Low Threshold (Armed): The ratio EMA must drop below this level to arm the thrust. Default: 0.40.
• High Threshold (Thrust): The ratio EMA must rise above this level to complete the thrust. Default: 0.615.
• Thrust Window (bars): Maximum number of bars allowed between arming and thrust completion. Default: 10.
Divergence Detection
• Pivot Lookback: Number of bars to the left and right for pivot detection. Default: 5.
• Show Divergences: Toggle divergence lines and labels on or off.
Index Overlay
• Reference Index: NYSE Composite or S&P 500. Controls which price series is used for divergence detection.
Display
• Show Status Table: Toggle the status table.
• Show Armed Background: Toggle the orange background highlight during armed windows.
• Table Position: Top-right, top-left, bottom-right, or bottom-left.
═══════════════════════════════════════════════════════════════════
█ METHODOLOGY NOTES
Morris tested modifications to Zweig's original parameters, including substituting a simple moving average for the EMA and shortening the EMA period to 8. Neither improved results. The defaults in this indicator match the canonical formulation.
The divergence detector uses the breadth ratio EMA (not price) as the primary series for drawing lines. This keeps all visual elements in the indicator's own pane. The price comparison happens internally using pivots from the selected reference index.
This indicator is designed for daily charts. On intraday timeframes, the breadth data resolves to daily values via request.security , so the thrust logic will still operate on daily bars regardless of the chart timeframe.
═══════════════════════════════════════════════════════════════════
█ PROVENANCE AND ATTRIBUTION
The Zweig Breadth Thrust is universally attributed to Martin Zweig (1942-2013), who published The Zweig Forecast newsletter from 1971 to 1997 and wrote Winning on Wall Street (Warner Books, 1986; revised edition 1994). The specific 0.40 / 0.615 / 10-day formulation does not appear in the 1986 first edition but is present in the 1994 revised edition (pp. 121-129). Whether the indicator was first published in the book or in the newsletter is unclear from available sources.
The formula documented in this indicator follows Greg Morris, The Complete Guide to Market Breadth Indicators (2nd ed., 2015), Chapter 5: Advance-Decline Ratio Indicators. Morris credits Zweig as the creator and provides the most rigorous published documentation of the methodology, including his own commentary on common misimplementations.
Additional references:
• Arthur Hill, StockCharts.com commentary on the Zweig Breadth Thrust (2023)
• Tom McClellan, McClellan Financial Publications אינדיקטור

10Y Yield x Oil Price█ OVERVIEW
This indicator plots the product of the US 10-Year Treasury yield and the price of crude oil. The resulting composite captures a specific macro stress condition: when the cost of money and the cost of energy are both elevated simultaneously, the real economy is being squeezed from two directions at once. Historically, extreme readings in this product have preceded severe economic contractions.
The concept is drawn from Luke Gromen's macro framework at FFTT, where he identifies this combined measure as a concise summary of stagflationary pressure on the economy.
═══════════════════════════════════════════════════════════════════
█ CONCEPT
Interest rates and energy prices are the two most pervasive input costs in any modern economy. Elevated rates raise the cost of capital, slow credit creation, and compress asset valuations. Elevated oil prices increase transportation, manufacturing, and agricultural input costs, feeding directly into consumer prices. When both are high simultaneously, the economy faces a pincer: tightening financial conditions on one side, rising real-world costs on the other.
Neither variable in isolation tells the full story. Rates can be high during healthy expansion (late 1990s), and oil can be high during loose monetary policy (2005 to 2007). The product of the two, however, spikes only when both pressures converge. This convergence historically coincides with or immediately precedes recessions.
═══════════════════════════════════════════════════════════════════
█ HISTORICAL REFERENCE POINTS
Going back to 1980, the yield × oil product has reached extreme levels only twice before:
• January 1980 : The Fed funds rate had been ratcheted above 13% and oil had doubled following the Iranian Revolution. What followed was a vicious double-dip recession (January to July 1980, then July 1981 to November 1982) that drove unemployment above 10%.
• March 2008 : The 10-year yield sat above 3.5% while oil surged past $100 on its way to $147 in July. The global financial crisis was already underway, with Bear Stearns collapsing that same month. The S&P 500 would lose more than half its value over the following year.
Both prior extremes resolved through demand destruction and economic contraction severe enough to pull one or both inputs sharply lower. The indicator's current reading context is left to the chart.
═══════════════════════════════════════════════════════════════════
█ HOW TO USE
This is a macro context indicator, not a trade signal generator. It belongs on a weekly or monthly chart as a background condition monitor alongside your existing framework.
Reading the chart
• Rising toward or above the red reference line : The economy is experiencing the same dual squeeze that preceded the two worst economic outcomes of the last 45 years. Risk management should be prioritized over return seeking.
• Between the yellow and red reference lines : Elevated but not extreme. Conditions are stressful but not historically unprecedented. Warrants caution.
• Below the yellow reference line : The dual squeeze is not present. Either rates, oil, or both are low enough that the economy is not being compressed from both sides.
Important caveats
• The reference hlines are approximate visual guides, not precise thresholds. The exact values of the January 1980 and March 2008 peaks depend on whether you use spot or front-month oil, daily or monthly yield data, and which exact date you measure. Adjust the hline levels to match what you see on your chart's data.
• This indicator says nothing about when the resolution occurs. January 1980 conditions persisted for months before the recession officially began. March 2008 was already in crisis but the worst was still six months away. Extreme readings are a condition, not a timer.
• The product can decline by either input falling. A drop driven by collapsing oil demand (2008 scenario) means something very different from a drop driven by rate cuts (stimulative policy). The direction of the decline matters as much as the decline itself.
═══════════════════════════════════════════════════════════════════
█ SETTINGS
• 10-Year Yield Symbol : defaults to TVC:US10Y . Can be changed to FRED:DGS10 or any other yield source.
• Oil Symbol : defaults to NYMEX:CL1! (WTI front-month continuous). Can be changed to TVC:USOIL , NYMEX:BZ1! (Brent), or any other crude benchmark.
═══════════════════════════════════════════════════════════════════
█ ATTRIBUTION
The yield × oil product as a macro stress indicator is attributed to Luke Gromen, founder of FFTT (Forest for the Trees). Gromen has highlighted this combined metric in his subscriber research and public commentary as a concise measure of stagflationary pressure, noting that its extreme readings have historically coincided with only the most severe economic stress episodes since 1980.
Disclaimer : This indicator is an educational and analytical tool. It does not constitute investment advice. Past historical patterns do not guarantee future outcomes. Always conduct your own research and risk management. אינדיקטור

Sector Relative Strength (DTR)█ OVERVIEW
This indicator ranks the eleven SPDR sector ETFs (plus SPY as a benchmark) by a weighted multi-timeframe rate-of-change composite, plotted as a single line with an accompanying ranking table. The approach replicates a well-known sector rotation framework that uses three overlapping momentum windows to identify which sectors are gaining or losing relative strength on a weekly basis.
The composite score (labeled "DTR") weights a short-term, medium-term, and long-term rate of change so that the effective center of the measurement sits at approximately sixteen weeks. Sectors are ranked by this score each week and the rank change column (R/C) tracks rotational momentum: which sectors are climbing or falling in the standings.
█ HOW IT WORKS
The DTR score for each sector is computed as:
DTR = W1 × ROC(8 weeks) + W2 × ROC(16 weeks) + W3 × ROC(32 weeks)
where each ROC is a simple percent change (current weekly close versus the close N weeks ago), and the default weights are 50% / 25% / 25%. This weighting places half the emphasis on recent momentum while anchoring the composite with longer-term trend context. The weighted average lookback under default settings is:
(0.50 × 8) + (0.25 × 16) + (0.25 × 32) = 16 weeks
All price data is forced to weekly resolution via request.security , so the indicator produces identical results regardless of the chart timeframe. The twelve sectors are ranked in descending order by DTR score each week.
█ SECTOR UNIVERSE
The indicator tracks twelve symbols:
• XLK Technology
• XLV Health Care
• XLE Energy
• XLF Financials
• XLC Communication Services
• XLY Consumer Discretionary
• XLP Consumer Staples
• XLI Industrials
• XLB Materials
• XLRE Real Estate
• XLU Utilities
• SPY S&P 500 (benchmark)
SPY is included as the twelfth entry so you can see where the broad market sits relative to individual sectors. A sector ranked above SPY is outperforming the market on the composite momentum measure; a sector ranked below SPY is underperforming.
█ READING THE CHART
Plotted line
The yellow line shows the DTR score for one selected sector. When the chart symbol is one of the twelve tracked ETFs, that sector is plotted automatically. When the chart symbol is anything else (an individual stock, a futures contract, crypto), the indicator plots whichever sector is selected in the "Plot Sector" dropdown, which defaults to SPY.
• DTR above zero: the selected sector has positive weighted momentum across the composite lookback
• DTR below zero: negative weighted momentum
• DTR rising: momentum is accelerating
• DTR falling: momentum is decelerating, even if still positive
The green/red background shading reflects the sign of the plotted DTR score.
Ranking table
The table (toggled via settings) displays all twelve symbols sorted by DTR score, with five columns:
• Rank : current position (1 = strongest)
• Sector : ticker and sector name
• DTR : the composite score
• R/C : rank change from the prior week (positive = improving, shown in green; negative = deteriorating, shown in red)
• 8w ROC : the short-term rate of change alone, for additional context
The currently plotted sector is highlighted with a yellow background in the table. Rows with positive DTR scores have green-tinted backgrounds; negative scores have red-tinted backgrounds.
What to look for
• Sectors at the top of the table with positive and rising R/C values are in strong rotational momentum. These are the sectors institutional capital is flowing into.
• Sectors falling in rank (negative R/C) even while DTR is still positive are showing early deceleration. This is often where rotation out of a sector begins before price breaks down.
• When SPY sits in the bottom half of the rankings, most sectors are outperforming the broad market, which can indicate a broad-based rally. When SPY is near the top, few sectors are keeping up, suggesting narrow market leadership.
• Clusters of defensive sectors (XLU, XLP, XLV) rising in rank while cyclicals (XLK, XLY, XLI) fall is a classic late-cycle rotation signal.
█ INPUTS
• Short / Medium / Long ROC (weeks) : the three lookback periods, defaulting to 8, 16, and 32 weeks
• Weight: Short / Medium / Long ROC : the weight applied to each period, defaulting to 0.50, 0.25, 0.25. These should sum to 1.0 for a properly scaled composite, though the script does not enforce this, allowing deliberate over- or under-weighting
• Plot Sector : which sector's DTR score to plot when the chart symbol is not in the universe. Ignored when the chart symbol matches one of the twelve tracked ETFs
• Show Ranking Table : toggle the table on or off
• Table Position : corner placement of the ranking table
█ LIMITATIONS AND NOTES
• The indicator requires at least 32 weeks of weekly data history to compute the longest default ROC. On symbols or exchanges with limited history, early bars will show na values.
• All data is pulled at weekly resolution. The DTR score updates once per week at the weekly close. Intraweek movements are not reflected until the current weekly bar closes.
• The sector universe is hardcoded to the eleven SPDR Select Sector ETFs plus SPY. These ETFs use the GICS classification system. Some sectors (notably XLC, which replaced the old Telecom sector in 2018) have limited history prior to their inception date.
• The R/C column compares the current week's rank to the prior week's rank. A single week of rank change can be noisy; persistent rank trends over multiple weeks are more informative.
• The weights are user-configurable but the "centered at N weeks" interpretation only holds when weights sum to 1.0.
█ METHODOLOGY NOTES
This approach to sector relative strength analysis is well-established in the technical analysis community. The multi-timeframe weighted ROC method has been used by practitioners including Tom Dorsey (Dorsey Wright & Associates) and other relative strength analysts for decades. The specific weighting scheme implemented here (50% short / 25% medium / 25% long, centered at approximately 16 weeks) comes from a publicly shared analysis of Fidelity sector fund rankings at the time of the March 2000 dot-com peak, which demonstrated the framework's ability to capture sector rotation during a major market inflection.
The SPDR sector ETFs used in this implementation are the most liquid and widely tracked sector vehicles available on US exchanges, making them the natural modern equivalent of the Fidelity sector fund universe used in the original analysis.
═════════════════════════════════════════════════════════════════════════
Disclaimer : This script is provided for educational and informational purposes only. It is not financial advice. Past indicator behavior does not guarantee future results. אינדיקטור

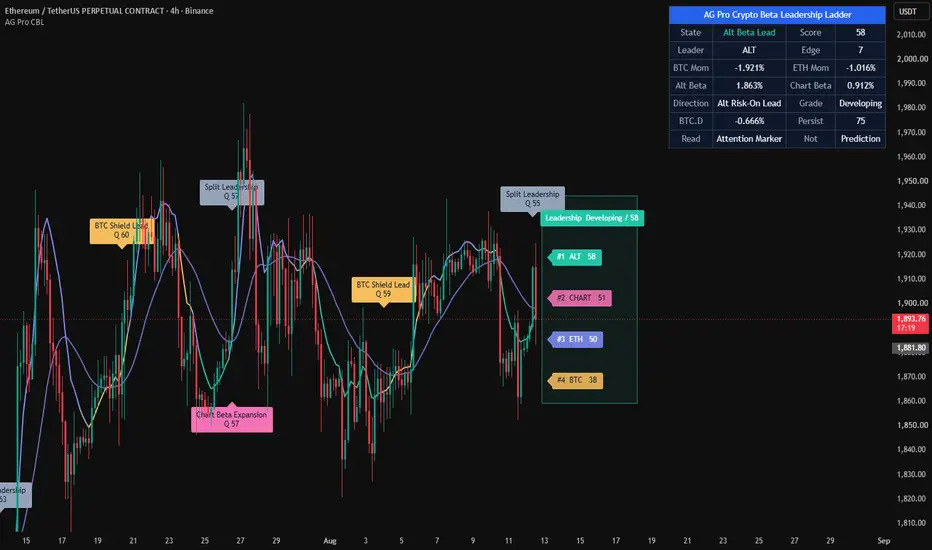
Crypto Beta Leadership Ladder [AGPro Series]Crypto Beta Leadership Ladder
🧠 Core Idea
When crypto risk appetite changes, who is actually leading the move: BTC, ETH, broad alt beta, or the active chart itself?
📌 Overview / What it does
Crypto Beta Leadership Ladder is a market leadership and relative beta map for crypto traders.
The script compares BTC, ETH, broad altcoin market-cap behavior, high-beta altcoin breadth, BTC dominance, ETH dominance, and the active chart into a single leadership framework.
It produces a right-side leadership ladder, a live leadership path, selective transition labels, optional compact markers, and an AG Pro dashboard panel. It does not predict price, automate trades, or tell users what to buy or sell.
🎯 Purpose & Design Philosophy
This script was built to solve a common crypto-market problem: price may move, but leadership often rotates underneath the move.
Sometimes BTC is leading defensively. Sometimes ETH begins to participate. Sometimes broad alt beta expands. Sometimes the active chart is outperforming the market. These are different market conditions, and they should not be interpreted the same way.
The goal is to help traders read crypto leadership quality instead of reacting only to candle direction.
⚡ Why This Script Is Different
Most tools focus on one symbol, one moving average, one dominance chart, or one relative-strength line.
This script does NOT draw liquidation zones, funding stress maps, stablecoin liquidity pulses, basis corridors, or open-interest commitment zones.
Instead, it builds a leadership ladder from multiple crypto-market proxies and ranks BTC, ETH, alt beta, and chart beta as a live market hierarchy.
⚙️ Methodology
1. Context Detection
The script reads BTC, ETH, TOTAL2, TOTAL3, BTC dominance, and ETH dominance sources.
2. Relative Beta Mapping
It compares performance, dominance change, chart beta versus BTC, and altcoin breadth versus BTC.
3. Leadership Ranking
BTC, ETH, ALT, and CHART scores are ranked into a leadership stack. The gap between the first and second rank controls whether leadership is clear or split.
4. Visual Output
The script displays a right-side rank ladder, a leadership path, selective event labels, optional rank markers, and a compact dashboard.
🗺️ How to Read the Chart
The top ladder rail shows the current leadership rank.
The middle rail shows the second rank and whether leadership is close or split.
The lower rail shows the third rank and the active beta spread context.
The leadership path moves with the market and changes color by active leadership state.
Event labels highlight major transitions such as BTC Shield Lead, ETH Leadership, Alt Beta Lead, Chart Beta Expansion, or Split Leadership.
The panel summarizes leader, score, edge, BTC relative change, ETH relative change, alt beta, chart beta, dominance shift, persistence, state, and grade.
🚦 Signals & States
• BTC Leadership → BTC is leading defensively versus the broader crypto market
• ETH Leadership → ETH participation is stronger than BTC and broad alt context
• Alt Beta Lead → high-beta altcoin breadth is leading the crypto market
• Chart Beta Expansion → the active chart is outperforming BTC with expanding beta
• Split Leadership → leadership is mixed and no single group has clear control
• Balanced Leadership → leadership is present but not strong enough to be dominant
• Data Missing → one or more reference sources are unavailable
🔔 Alerts Logic
Alerts can be enabled for BTC Leadership, ETH Leadership, Alt Beta Leadership, Chart Beta Expansion, and Split Leadership.
Alerts trigger when the relevant state becomes active and the leadership state changes.
Alerts are attention markers only. They are not trade instructions.
🧩 Confluence Logic
The ladder becomes more meaningful when rank edge, dominance shift, chart trend, and persistence align.
For example, an Alt Beta Lead state with positive chart beta and falling BTC dominance suggests a stronger risk-on leadership environment than a single isolated altcoin move.
📊 When to Use
• Crypto market rotation analysis
• BTC versus altcoin leadership checks
• ETH participation monitoring
• Altcoin beta expansion environments
• Market regime comparison across timeframes
⚠️ When NOT to Use
• Symbols with poor liquidity
• Very low timeframes with noisy dominance behavior
• Markets where reference symbols are unavailable
• During extreme news shocks without broader context
🎛️ Key Inputs
• Leadership Momentum Length → controls the main comparison window
• Leadership Baseline Length → controls slower leadership context
• Leadership Edge Threshold → controls how strong rank separation must be
• Beta Expansion Threshold → controls chart outperformance sensitivity
• Ladder Projection Bars → controls right-side ladder length
• Label Font Size / Panel Font Size → controls visual readability
🖥️ Interface & Visual Design
The interface is designed as a leadership stack rather than a zone map.
The ladder avoids white or pale-gray primary visuals so it remains visible on both dark and light chart backgrounds.
The panel uses the AG Pro blue header with a single merged title row and a compact information hierarchy.
🧪 Practical Usage Workflow
1. Read the panel state.
2. Check which asset group leads the ladder.
3. Compare edge and persistence.
4. Read the leadership path color.
5. Use event labels as attention markers, not trade signals.
🔍 Interpretation Guidelines
Clear leadership means one group is controlling relative market behavior.
Split leadership means the market may be rotating, pausing, or lacking conviction.
Chart Beta Expansion means the active symbol is outperforming BTC, but it still requires broader confirmation.
🚫 What This Script Is NOT
This script is not a prediction engine.
It is not a financial-advice tool.
It is not an automated trading system.
It does not guarantee that leadership will continue.
It does not replace risk management or broader market analysis.
⚠️ Limitations & Transparency
Reference-symbol availability may vary by exchange, region, and TradingView data feed.
Dominance data may behave differently from exchange-traded pairs on lower timeframes.
Leadership can rotate quickly during volatile crypto sessions.
Different timeframes may show different leadership states.
🧠 Market Context Notes
BTC leadership often reflects defensive crypto behavior.
ETH leadership can suggest higher participation in major smart-contract assets.
Alt beta leadership can suggest broader risk appetite, but it may also be more volatile.
Split leadership often appears during transitions, pauses, or uncertain market regimes.
🧾 Use Case Examples
When BTC leads while BTC dominance rises, the market may be defensive even if price is moving.
When alt beta leads while BTC dominance falls, broader risk appetite may be improving.
When the active chart expands versus BTC while rank edge improves, that symbol may deserve closer attention.
🧱 System Philosophy
Crypto markets are not led by one chart all the time.
This script treats leadership as a rotating hierarchy and visualizes that hierarchy directly on the chart.
🔐 Non-Promise Statement
No script can guarantee future price behavior.
This tool maps leadership context; it does not provide certainty.
📉 Risk Disclosure
Trading involves risk.
Users are responsible for their own decisions.
This script is provided for educational and analytical purposes only and does not constitute financial advice.
📚 Educational Note
Use the ladder to study how crypto leadership rotates between BTC, ETH, alt beta, and the active chart across different market regimes.
אינדיקטור

Pivot Point 15/60 prdHourly Pivot Point Crossover by 15-Minute Pivot Point is a multi-timeframe approach in technical analysis that combines pivot levels calculated on the hourly (H1) chart with those on the 15-minute (M15) chart. It helps intraday traders identify high-probability entries, confirm trend direction or reversals, and manage trades more effectively.
What Are Pivot Points?
Pivot points are calculated from the prior period's high, low, and close prices to generate a central Pivot (PP) and multiple support (S1, S2, S3) and resistance (R1, R2, R3) levels. The standard (floor) formula is:
PP = (High + Low + Close) / 3
R1 = (2 × PP) – Low
S1 = (2 × PP) – High
Higher/lower levels follow similar expansions.
These levels act as dynamic support/resistance. For hourly pivots, calculations use the previous hour's data (they update hourly). For 15-minute pivots, they update every 15 minutes, making them more responsive to short-term price action.
Understanding the "Crossover"
A "crossover" in this context typically refers to situations where:
Price or the 15-minute pivot levels (PP, R1/S1 etc.) interact with or break through the hourly pivot levels.
The shorter-term (M15) structure shifts relative to the higher-timeframe (H1) pivots, e.g., M15 PP crossing above/below H1 PP, or price on the 15-min chart breaking a key H1 level with confirmation from M15 pivots.
Alignment or divergence between the two timeframes (e.g., price holding above H1 PP while M15 shows bullish crossover of its own levels).
This is part of multi-timeframe analysis, where the hourly chart provides the broader intraday bias (trend/context), and the 15-minute chart offers precise entry timing and short-term signals.
How It Can Be Helpful in Trading
Trend Bias and Direction:
If price is above the hourly PP, it suggests a bullish bias on the H1 timeframe. Look for long opportunities on the 15-min chart when M15 pivots align or crossover positively (e.g., price reclaims M15 PP and pushes toward H1 R1).
Below hourly PP → bearish bias; favor shorts on M15 breakdowns.
Entry and Confirmation:
Bounce/Reclaim Setup: Price pulls back to an hourly support (e.g., H1 S1 or PP) and shows a bullish reversal on the 15-min chart (M15 PP crossover or price reclaiming M15 levels with volume/candlestick confirmation). This provides confluence for entries.
Breakout Setup: A decisive break of an hourly level (e.g., above H1 R1) confirmed by 15-min momentum or M15 pivot crossover reduces false breakouts. The faster 15-min pivots help time the entry precisely.
Support/Resistance Confluence:
When H1 and M15 levels cluster (e.g., H1 PP near M15 R1), it creates a stronger zone. Price reactions at these zones are often sharper.
Risk Management:
Stops can be placed just beyond the opposing pivot (e.g., below a support level).
Targets often use the next pivot levels on either timeframe (e.g., aim for H1 R1/R2 from an M15 entry).
Helps avoid trading against the higher-timeframe structure ("Never stand against the pivot" is a common rule).
Filtering Noise and Improving Probability:
The 15-min chart alone can be noisy; overlaying hourly pivots adds context and filters low-quality signals.
Common in forex, indices, and futures day trading/scalping on 5-15 min charts.
Practical Tips for Implementation
Chart Setup: Display both hourly and 15-min pivots on your 15-min trading chart (most platforms allow multi-timeframe pivots or indicators).
Combine with Other Tools: Use with candlestick patterns, volume, RSI/MACD for divergence, or moving averages for extra confirmation.
Best Sessions: Works well during active market hours (e.g., London/New York overlap) when liquidity supports pivot reactions.
Timeframe Alignment: Hourly provides the "bigger picture" for the session; 15-min for execution. Some traders also reference daily pivots for even higher context.
Limitations: Pivots are lagging in calculation but leading in projected levels. They work best in ranging or moderately trending markets; strong trends may ignore inner levels. Backtest and combine with price action. אינדיקטור

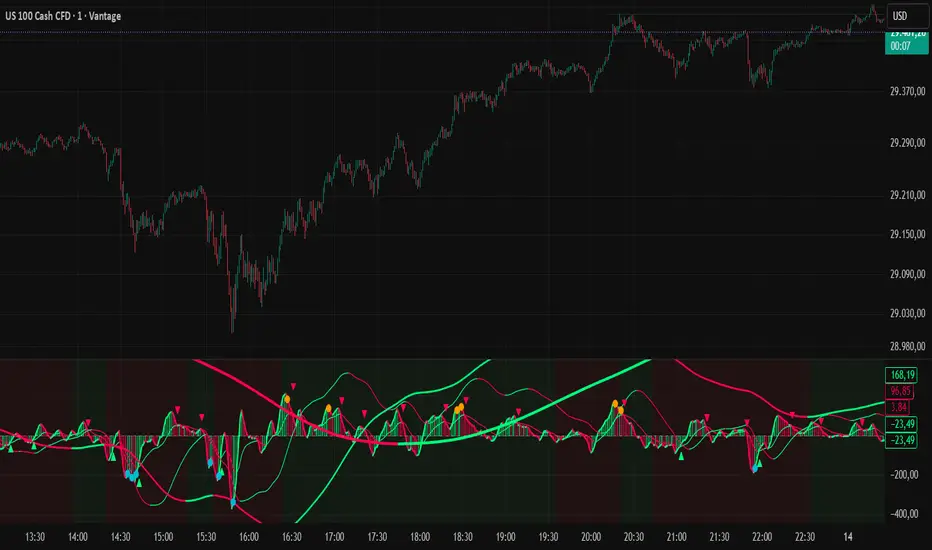
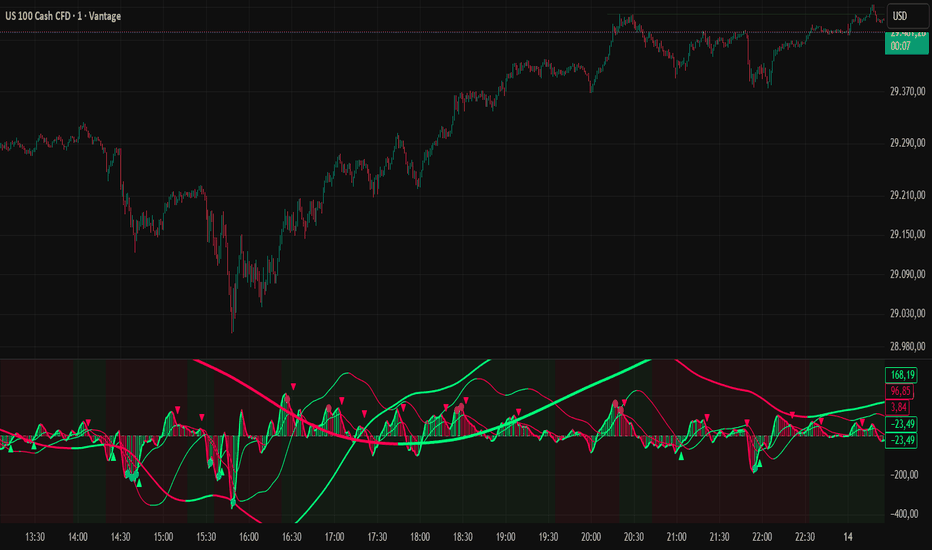
Momentum Bias Index PRO - M1 SWEET SPOTThe original Momentum Bias Index by AlgoAlpha was designed as a general-purpose momentum oscillator for detecting bullish and bearish market pressure. While the original concept worked well for broad market analysis, it was not specifically optimized for the extremely fast and aggressive behavior of NASDAQ on the 1-minute timeframe.
This custom PRO version was completely rebuilt and fine-tuned specifically for NASDAQ M1 scalping and intraday momentum trading.
Instead of measuring only standard momentum, this upgraded version combines:
raw momentum acceleration
EMA flow pressure
directional expansion
adaptive bias smoothing
higher timeframe trend control
into a single institutional-style momentum engine.
Why We Rebuilt the Original
The original version had several limitations when used on NASDAQ M1:
momentum spikes were often too noisy
trend phases were not stable enough
fast reversals created too many false shifts
higher timeframe direction lacked smoothness
momentum strength alone was not enough to measure real market pressure
NASDAQ on the 1-minute chart behaves differently from slower markets. It moves in aggressive liquidity waves, fast momentum expansions, and rapid algorithmic pullbacks.
Because of this, the original oscillator needed a complete restructuring to better detect:
real directional pressure
continuation phases
exhaustion moves
hidden pullbacks
institutional trend flow
What Makes This PRO Version Different
1. Flow Engine Integration
The biggest upgrade is the custom EMA Flow Engine.
The indicator now calculates the pressure difference between fast and slow EMAs and injects this information directly into the momentum calculation.
This creates a much more realistic representation of actual market pressure.
The result:
stronger trend detection
earlier momentum shifts
better continuation signals
cleaner trend structure
2. NASDAQ M1 Sweet Spot Tuning
Every setting was optimized specifically for NASDAQ M1 behavior.
The current tuning focuses on:
ultra-fast reaction speed
controlled smoothing
reduced fake spikes
stable directional bias
high trend responsiveness
This allows the indicator to react early while still filtering a large amount of lower-quality market noise.
3. Smoothed HTF Bias Line
The original higher timeframe logic was redesigned.
Instead of using a raw higher timeframe signal, this version applies additional smoothing to create a stable institutional-style bias filter.
The HTF line now acts as:
a directional trend guide
a trend continuation filter
a pullback confirmation tool
a market state detector
This dramatically improves trend stability during fast NASDAQ sessions.
4. Expansion & Compression Detection
The dynamic average bands now help visualize:
momentum expansion
exhaustion zones
compression phases
pressure imbalance
Strong histogram expansion outside the bands often signals aggressive directional movement, while contraction phases can indicate pullbacks or temporary liquidity pauses.
Advantages Over the Original
Compared to the original Momentum Bias Index, this PRO version offers:
much faster reaction speed
cleaner trend continuation behavior
better NASDAQ adaptation
stronger institutional flow detection
smoother higher timeframe direction
reduced market noise
more stable pullback structure
earlier momentum transitions
improved momentum expansion detection
Best Use Cases
This indicator was specifically designed for:
NASDAQ M1 scalping
intraday momentum trading
trend continuation setups
pullback entries
higher timeframe bias filtering
liquidity expansion detection
It performs especially well during:
New York Open
NASDAQ momentum sessions
breakout environments
trend continuation phases
Final Concept
This is no longer just a standard momentum oscillator.
It has evolved into a hybrid momentum-flow engine that combines:
directional bias
momentum acceleration
EMA pressure flow
higher timeframe structure
dynamic expansion analysis
into one highly responsive NASDAQ M1 trading tool.
The goal was simple:
Create a cleaner, faster, and more institutionally aligned version of the original Momentum Bias Index specifically for high-speed NASDAQ trading. אינדיקטור

Smart Entry Predictive Fib TP SLSmart Entry — Predictive Fib Zones with TP / SL Levels
This indicator combines Fibonacci retracement, EMA, SMA, RSI and Volume POC (Point of Control) to generate a single clear trading decision — BUY or SELL — with exact entry, take profit and stop loss levels drawn directly on the chart.
How it works:
The script analyses the last 30 candles to auto-detect the swing high and low, then calculates all key Fibonacci levels (0.236, 0.382, 0.5, 0.618, 0.705, 0.786). A directional bias score is computed from RSI position, EMA9/EMA21 alignment, price vs SMA50, and volume pressure. Because BUY% and SELL% are derived from the same inverse bias, they can never both read high at the same time.
What you get on the chart:
ENTRY line — exact price to enter
TP 1, TP 2, TP 3 — three take profit targets with % gain and R:R ratio per level
STOP LOSS line — with % risk clearly labelled
Volume POC — the highest-volume price node over the lookback period, used to refine the entry price
Projected zone boxes to the right showing where price is likely to react before it gets there
Live info table with all levels, RSI, EMA alignment, volume status and bias
Indicators used: Fibonacci · EMA 9/21 · SMA 50 · RSI 14 · Volume POC
For educational purposes. Always manage your own risk. אינדיקטור

אינדיקטור

אינדיקטור

אינדיקטור

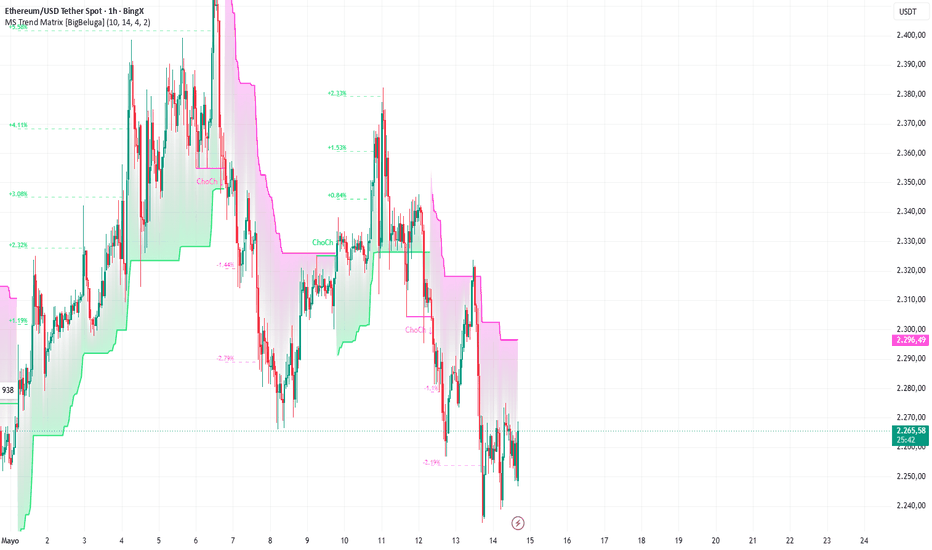
Market Structure Trend Matrix [BigBeluga]CTURE TREND MATRIX
// ═══════════════════════════════════════════════════════════════════════════════
//
// OVERVIEW
// ────────
// A comprehensive technical analysis framework for traders who demand precision
// in identifying market regimes and trend expansions.
// Combines automated Market Structure (MS) detection with volatility-adjusted
// risk parameters (ATR), providing a systematic roadmap for navigating price action.
//
// ARCHITECTURE & CORE LOGIC
// ──────────────────────────
// • Automated Structure Mapping: A pivot-detection engine (MS Length) that scans
// for institutional-grade swing highs and lows, ignoring retail noise.
// Structural lines are drawn only when significant supply or demand zones are breached.
//
// • ChoCh Engine (Change of Character): When price crosses a recent pivot high or
// low, the indicator prints a "ChoCh ↑ / ↓" label. This represents a fundamental
// shift in market sentiment — the current trend has likely ended and a new cycle begins.
//
// • Infinite Expansion Targets: Sequential levels calculated using ATR multipliers
// that expand and contract with current market volatility. Each time price hits a
// target, the next level is projected automatically.
//
// • Volatility-Anchored Trailing Stop: A dynamic ATR-based stop that acts as a
// "ratchet" mechanism — it moves closer to price during trend expansion but stays
// firm during minor pullbacks, providing a clear exit point if the trend fails.
//
// ADVANCED FEATURES
// ─────────────────
// • Target History Control (Show History): toggle historical target lines and
// percentage labels on/off to keep the chart clean.
// • Dynamic Trailing Stop Visibility (Show Trailing Stop).
// • Percentage profit labels at each target hit, measured from the ChoCh entry.
// • Volatility-adjusted spacing: both the trailing stop and target steps use ATR
// calculations — effective across all asset classes (Crypto, Forex, Equities…).
//
// HOW TO INTERPRET
// ────────────────
// • Bullish State (green): Activated when price breaks above a major Pivot High.
// Projects upward expansion targets and keeps the trailing stop below price.
// → BUY signal printed at the ChoCh ↑
//
// • Bearish State (pink/purple): Activated when price breaks below a major Pivot Low.
// Projects downward targets and keeps the trailing stop above price.
// → SELL signal printed at the ChoCh ↓
//
// • Target Hit: each time a target level is reached, the % gain from the ChoCh
// entry is displayed on the chart.
//
// • Stop Hit: if price crosses the Trailing Stop against the active trend direction,
// an EXIT signal is printed.
//
// RECOMMENDED USAGE
// ─────────────────
// • Scalping / Day Trading → MS Length 5-8, 1m-5m charts.
// • Swing Trading → MS Length 15-20, D1 / H4 charts.
// • Risk-Reward Management → Distance ChoCh ↔ Trailing Stop = objective risk.
// Sequential targets = profit milestones.
//
// SIGNALS INCLUDED IN THIS SCRIPT
// ────────────────────────────────
// → Bullish ChoCh confirmed (green arrow below the bar)
// → Bearish ChoCh confirmed (pink arrow above the bar)
// → Price reaches a target (label with % gain above/below the bar)
// → Price crosses the Trailing Stop against the trend
// Configurable TradingView alerts available for all 4 events above.
// ═══════════════════════════════════════════════════════════════════════════════ אינדיקטור
אינדיקטור
אסטרטגייה

אסטרטגייה

אינדיקטור