אינדיקטור
מתנדי רוחב

Crisis indicatorWhat This Indicator Does
This indicator acts as an early warning system for potential market crises by tracking 5 of the most reliable financial danger signals that have predicted major market declines throughout history.
The 5 Crisis Signals Monitored
1. Yield Curve Inversion
- What it measures: When short-term interest rates become higher than long-term rates
- Why it matters: This has predicted every US recession since 1955
- Trigger: Yield curve drops below your set threshold (default: 0
אינדיקטור

Trend / Range / Down Days Counter v6
Trend Duration Tracker v6
A trend-state indicator that automatically detects whether the market is currently in an:
UPTREND
DOWNTREND
RANGE
and displays how long the current condition has been active directly on the chart.
Features
• Automatic Market State Detection
The indicator continuously analyzes price action and trend direction using:
EMA slope
Price position relative to EMA
ATR-based noise filtering
to classify the market environment in real time.
• Trend Duration Display
Shows
אינדיקטור

Calculador de Lotajes - copyCalculador de Lotajes - copyCalculador de Lotajes - copyCalculador de Lotajes - copyCalculador de Lotajes - copyCalculador de Lotajes - copyCalculador de Lotajes - copyCalculador de Lotajes - copyCalculador de Lotajes - copyCalculador de Lotajes - copyCalculador de Lotajes - copyCalculador de Lotajes - copyCalculador de Lotajes - copyCalculador de Lotajes - copyCalculador de Lotajes - copy
אינדיקטור

ORB Breakout - 30min (MNQ/GC)**ORB Breakout — 30min (MNQ/GC)**
Identifies high-probability breakout setups during the first 2 hours of the regular NYSE session, optimized for futures traders (MNQ, GC).
**Triggers when ALL 4 conditions are met simultaneously:**
- ✅ Price closes above the 30-minute Opening Range High (9:30–10:00 AM EST)
- ✅ Current bar volume is ≥ 1.5× the average volume of the opening range bars
- ✅ Price is above VWAP
- ✅ Time is before 11:30 AM EST (within the first 2 hours of session)
**Visuals:**
- Da
אינדיקטור

Orange FlagHow it works
The indicator pulls daily data from four market internals and assigns points based on whether each one is at an extreme reading:
YRHI-YRLO spread (52-week new highs minus new lows on NASDAQ): +3 points if ≥ 75
MMTW (Russell 2000 stocks above 50-day MA): +2 points if ≥ 55
S5FI (S&P 500 stocks above 50-day MA): +2 points if ≥ 65
VIX: +1 point if < 15
Maximum score is 8 points. When the total reaches 5 or higher, the chart background paints orange to flag a risk-on extreme.
How to
אינדיקטור

אינדיקטור

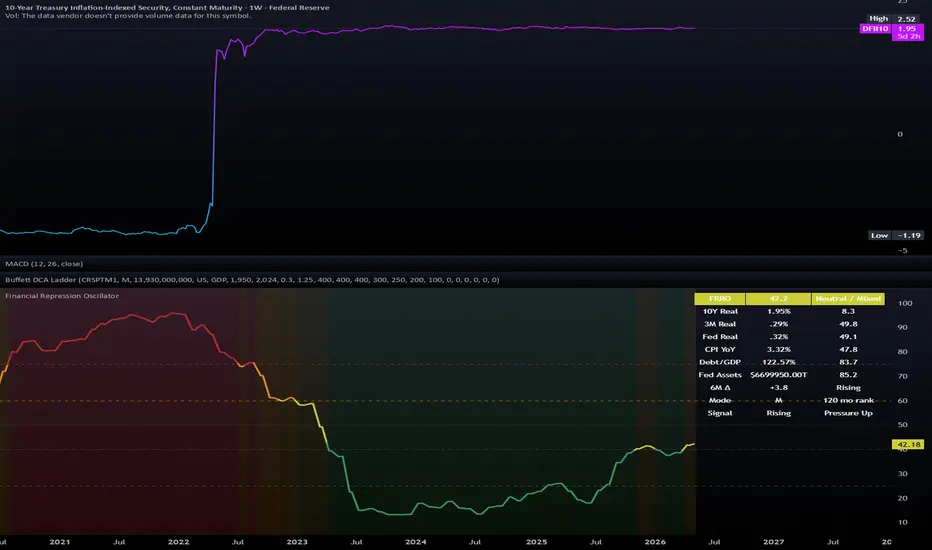
Financial Repression OscillatorThe Financial Repression Oscillator is a macro-regime indicator designed to help visualize whether current conditions are more consistent with a restrictive real-rate environment or a financial-repression-like environment.
It combines several public FRED macroeconomic series into a single bounded oscillator from 0 to 100. The goal is not to generate trade signals, but to provide a compact way to monitor real rates, inflation pressure, debt burden, and Federal Reserve balance-sheet conditions to
אינדיקטור
Lomo Timeframes & Delta VolumePodrás visualizar el sesgo del activo en diferentes temporalidades y el delta volume en tiempo real. Muy funcional y visual para saber dirección del activo.
אינדיקטור

IS Ghostbusters - Visual Session Levels & Auto-Hedge LogicGhostbusters is a visual execution tool designed for traders who operate based on fixed intraday levels and seek disciplined risk management. The script does more than just project entry, stop loss, and take profit levels; it acts as a real-time session monitor, validating executions and automatically managing hedge operations.
+1
Key Features:
Precision "Touch" Detection: Unlike standard indicators that wait for a candle to close, Ghostbusters uses intrabar prices (High/Low) to detect the ex
אינדיקטור

Fibonacci Retracement Low
Fibonacci Retracement Low for bitcoin and other coins.
# Fibonacci Retracement Low — Bitcoin & Altcoins
## 📐 What is Fibonacci Retracement?
Fibonacci Retracement is a technical analysis tool derived from the **Fibonacci sequence**, a mathematical series discovered by Leonardo Fibonacci in the 13th century. The sequence — 0, 1, 1, 2, 3, 5, 8, 13, 21... — produces a ratio (~1.618) known as the **Golden Ratio (φ)**, which appears repeatedly in nature, art, and financial markets.
In trading,
אינדיקטור

ADDQ Breadth Oscillator [Signal Vision]
ADDQ Breadth Oscillator
📊 ADDQ Breadth Oscillator (Advanced Market Internal)
The ADDQ Breadth Oscillator is a momentum-based tool designed to visualize the internal health of the NASDAQ by tracking Net Advancing Issues (ADDQ).
Unlike standard price indicators, this oscillator looks "under the hood" of the market to see if price movement is supported by broad participation or if it’s being driven by just a few heavyweights.
🔍 How it Works
This indicator pulls the NASDAQ Advance-Decline Li
אינדיקטור

אינדיקטור

900 S/R Scanner v4support and resistance tool , that i made for myself , its show the 900 moving average on different time frames live.
just first tool that made if you have update suggestions write a comment
אינדיקטור

אינדיקטור

Auto-Logger MTF + Calendar Backtestkalender backtest ini membuat kita tidak perlu ribet cek backtesting dan tidak perlu harus forward testing sehingga akan sangat memudahkan para trader
אסטרטגייה

BankNifty 15m Clear TP/SL StrategyBanknifty 5/10min TP/SL- trade on banknifty NSE with 5/10 min chart and get TP and SL marked on chart itself
אסטרטגייה

Auto-Logger Multi-Timeframe Analyzer by mucismulti time frame untuk cek history backtest bahkan winrate dari tiap indikator agar kita bisa tau win dan lose tanpa perlu forward test yang lama
אינדיקטור

Gann Fan v15 [Phases + Signals]Gann Fan v15 is a strategy inspired by the classic Gann Fan and Gann Angles methodology attributed to W.D. Gann. Gann’s original approach studied the relationship between price, time, geometry, and market angles to identify trend strength, diagonal support and resistance, and potential changes in market behavior.
Credit:
The base concept of the fan angles comes from the Gann Fan / Gann Angles method attributed to W.D. Gann. This script does not claim to reproduce Gann’s original work exactly.
אסטרטגייה

SPX/SPY Weighted Sector Tape Quality DashboardSPY/SPX Weighted Sector Tape Quality Dashboard
- Purpose:
Provides a real-time view of SPY/SPX sector participation using sector ETF movement and approximate S&P 500 sector weights.
- Weighted Sector Impact:
Calculates each sector’s contribution by multiplying the sector’s percent move by its market weight.
- Real-Time Sector Table:
Displays each sector in a TradingView table with sector name, weight, percent move, weighted impact, and quick read.
- Color-Coded Heatmap:
Uses green/red shadin
אינדיקטור

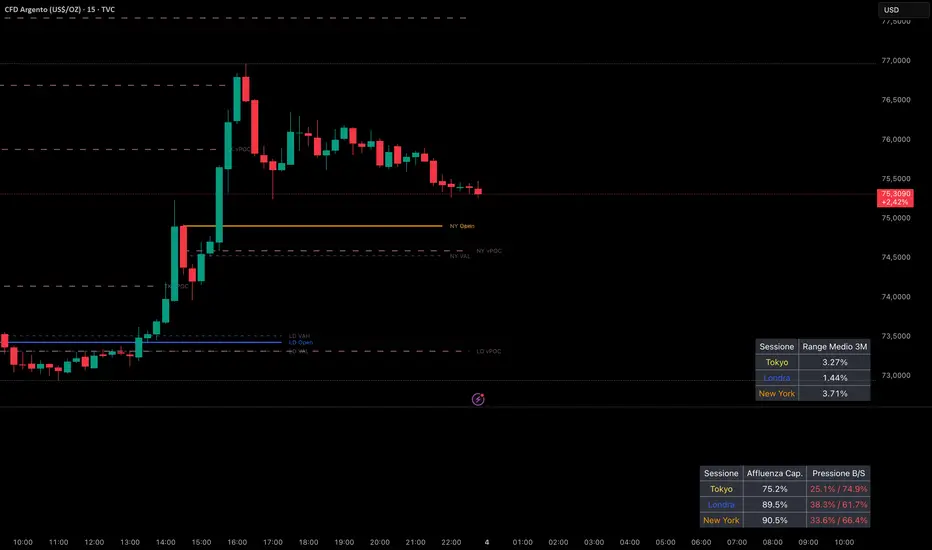
Universal Session Open V.3 - TF 1/15DESCRIZIONE DELLO SCRIPT:
Cos'è Universal Session Open V3?
L’Universal Session Open V3 è un indicatore avanzato studiato per lavorare sui timeframe a 1 e 15 minuti. È progettato per i trader che vogliono unire la ciclicità del tempo (le sessioni di borsa) con la precisione millimetrica dei volumi (Volume Profile e vPOC).
Lo scopo di questo strumento è mappare con esattezza l'attività delle tre sessioni principali (Tokyo, Londra e New York) per individuare i livelli in cui le istituzioni hanno a
אינדיקטור
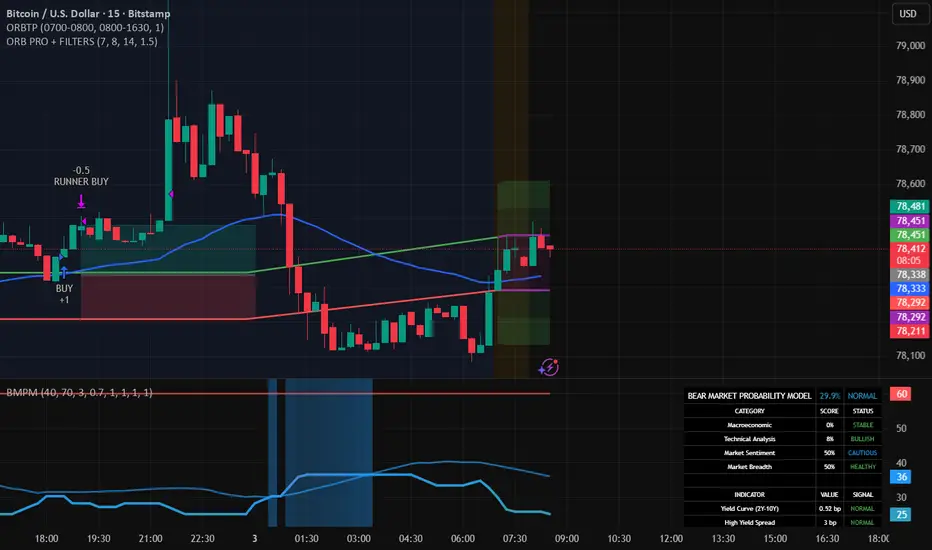
ORB PRO + FILTERS (elwinpoedeklapopsnoede)Short and simple:
👉 This Pine script trades an Opening Range Breakout with filters.
What it does:
Determines the range between 07:00–08:00 (highest and lowest price)
Waits until the US session (14:00–23:00 NL time) begins
Goes long if price breaks above the range
Goes short if price breaks below the range
Only trades in the direction of the trend (EMA 50)
Risk management:
Stop loss = opposite side of the range
Take profit = 1:1 risk/reward (close 50%)
It lets the rest run with a trail
אסטרטגייה
Weekly First Bar Vertical LinesWeekly First Bar Vertical Lines
Weekly First Bar Vertical Lines
Weekly First Bar Vertical Lines
Weekly First Bar Vertical Lines
Weekly First Bar Vertical Lines
Weekly First Bar Vertical Lines
אינדיקטור

Auto-Logger Signal Trackerotomatis laporan SL TP winrate dari semua indikator anda dalam satu klik di depan layar anda
אסטרטגייה
