אינדיקטור

אינדיקטור
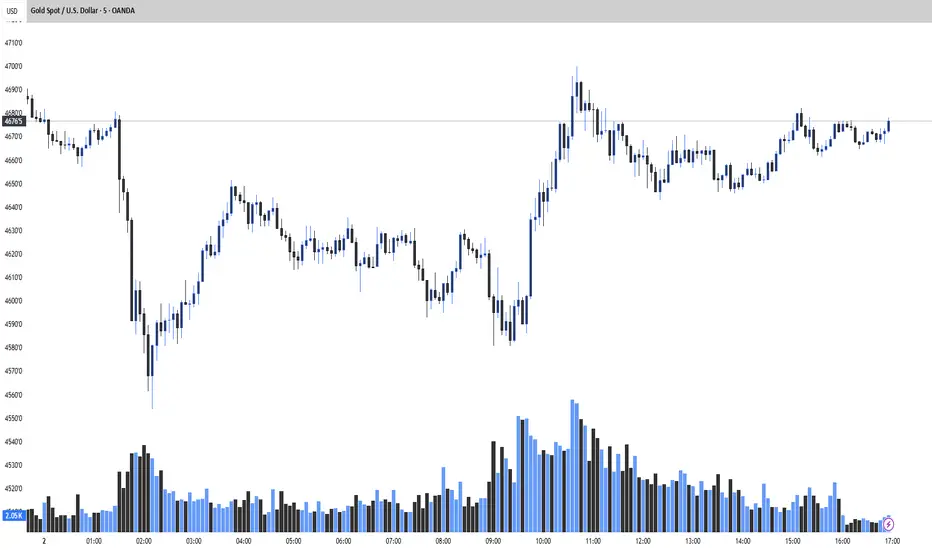
Pro SMC Call/Put System V4 StrictThis V4 strict Pine Script is a structured intraday trading indicator designed mainly for 1-minute charts like SPY, SPX, or QQQ, with optional 5-minute trend confirmation to improve signal quality. It combines short-term trend using EMA 9 and EMA 21, higher-timeframe key levels such as previous day high/low and previous week high/low, and smart-money-style structure concepts like BOS, CHoCH, equal highs, and equal lows. It divides the prior day’s range into premium, discount, and equilibrium so it can judge whether price is in a better area for calls, puts, or no trade. The script is intentionally strict: it avoids giving signals in equilibrium chop, flat EMA conditions, tiny-range candles, and poor locations where many false trades happen. Calls are favored only when bullish trend, bullish location, volume, candle strength, and reclaim or retest conditions align, while puts are favored only when bearish trend, bearish location, volume, candle strength, and rejection or failed retest conditions align. It also includes a more realistic stop-loss model that uses nearby structure and ATR caps so the stop is not absurdly wide from a random wick, and it projects TP1 and TP2 using a mix of structure and fallback risk-reward logic. In practice, it is meant to reduce bad entries, especially random calls at premium and random puts at discount, and guide you toward cleaner breakout-retest or rejection-based trades rather than constant signals inside noisy range conditions.
אינדיקטור

אינדיקטור

אינדיקטור

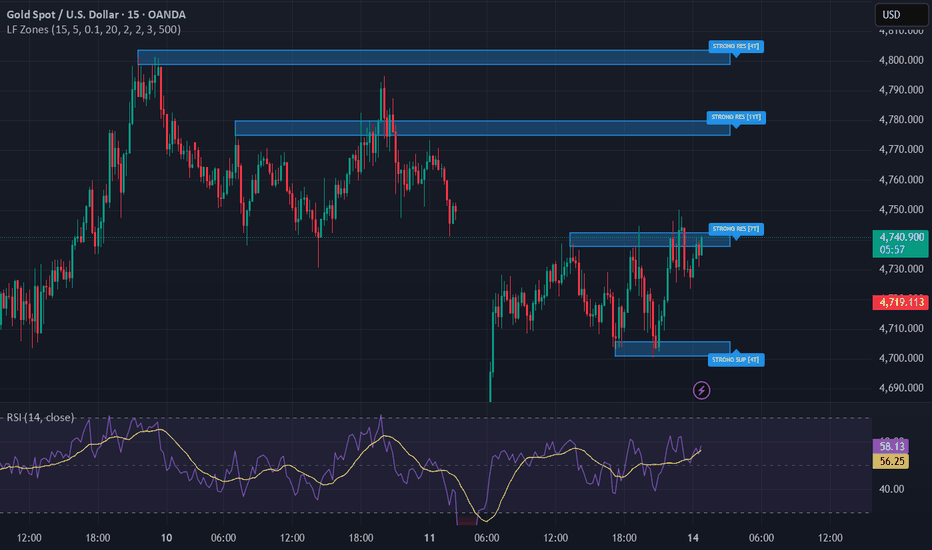
LiquidFlow Reversal EngineLiquidFlow Reversal Engine v1.0
Core Components
1. Order Flow Momentum Engine
Calculates buying vs selling pressure from candle structure × volume
Tracks cumulative order flow delta with fast/slow EMA crossover for trend direction
Detects OF divergences (price vs momentum disagreement)
Candles are color-coded: green shades = bullish OF, red shades = bearish OF
2. Liquidity Zone Detection
Identifies zones from pivot highs/lows with configurable lookback
Real zones (blue, solid border): 2+ touches + volume confirmation — these are used for entries
Fake zones (grey, dashed border): single wick grabs with low volume — these are filtered OUT
Fake detection uses wick-to-range ratio (>60% wick + low volume = likely stop hunt)
3. Fibonacci Auto-Levels
Auto-detects swing high/low over 80 bars, plots 0.236/0.382/0.500/0.618/0.786
Adds confluence scoring when price aligns with fib + liquidity zone
4. RSI + Divergence
Standard RSI with OB/OS detection
Pivot-based divergence detection (higher RSI lows on lower price lows = bullish div)
Entry Logic (Reversal Only — Never Breakouts)
LONG signal requires ALL of:
Price at a real support zone (not fake)
OF momentum shifting bullish (strong pressure or divergence)
RSI oversold/recovering or showing bullish divergence
Price bouncing (close > open, close > prior low) — NOT breaking down
SHORT signal — mirror logic at real resistance zones.
Dashboard (top-right)
Shows: OF Trend, OF Strength, RSI, Divergences, Fib position, Zone status, Signal, Confluence score (out of 8). אינדיקטור
אינדיקטור

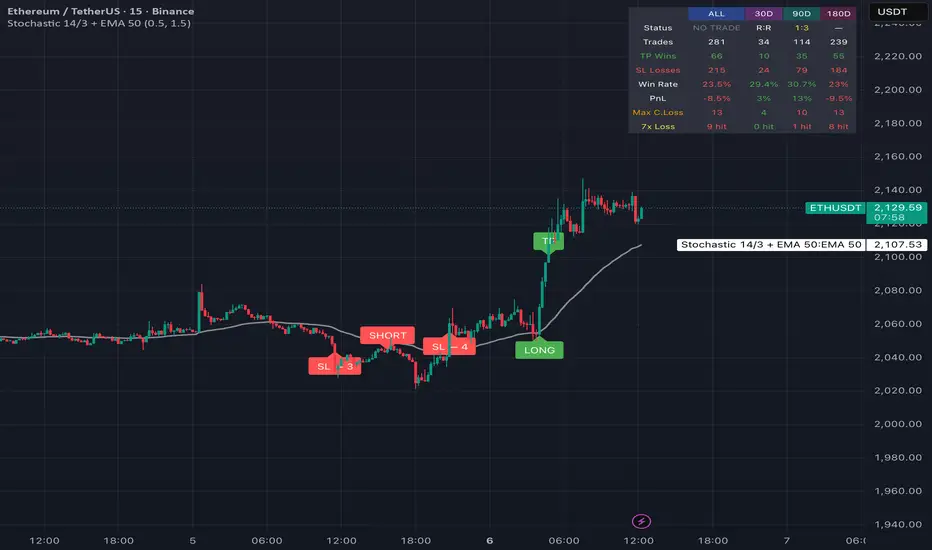
AI Stochastic 14/3 + EMA 50📊 Stochastic 14/3 + EMA 50 — Signal Tracker with Full Dashboard
This indicator generates LONG and SHORT signals based on Stochastic %K/%D crossover in extreme zones, filtered by EMA 50 trend direction. Every signal is tracked with automatic TP and SL levels, and a comprehensive performance dashboard shows real-time stats across multiple time periods.
━━━━━━━━━━━━━━━━━━━━━━━━━━━━━━━
🔹 STRATEGY LOGIC
LONG Entry:
• Stochastic %K was below 20 (oversold)
• %K crosses above %D
• Price is above EMA 50 (uptrend confirmed)
SHORT Entry:
• Stochastic %K was above 80 (overbought)
• %K crosses below %D
• Price is below EMA 50 (downtrend confirmed)
Trade Management:
• SL: 0.5% opposite side (adjustable)
• TP: 1.5% favour side (adjustable)
• Risk:Reward = 1:3
• No new trade while one is active
━━━━━━━━━━━━━━━━━━━━━━━━━━━━━━━
🔹 DASHBOARD (Top Right)
Live performance table with 4 columns:
• ALL — Full history stats
• 30D — Last 30 days
• 90D — Last 90 days
• 180D — Last 6 months
Each column tracks:
✅ Total Trades
✅ TP Wins / SL Losses
✅ Win Rate %
✅ Net PnL %
✅ Max Consecutive Losses
✅ 7x Consecutive Loss Counter
Color coded:
• Win Rate: Green (≥25%) / Red (<25%)
• PnL: Green (positive) / Red (negative)
• Max C.Loss: Green (<7) / Orange (7-9) / Red (10+)
• 7x Loss: Green (0 hit) / Red (1+ hit)
━━━━━━━━━━━━━━━━━━━━━━━━━━━━━━━
🔹 VISUAL FEATURES
📌 LONG / SHORT labels on entry
📌 TP / SL labels with price levels
📌 Green TP line + Red SL line + White entry line
📌 Consecutive streak counter (SL — 2, SL — 3, TP — 2, etc.)
📌 Only shows streaks when back-to-back same result
━━━━━━━━━━━━━━━━━━━━━━━━━━━━━━━
🔹 SETTINGS
• SL % — Stop loss percentage (default: 0.5%)
• TP % — Take profit percentage (default: 1.5%)
• Both adjustable in indicator settings
━━━━━━━━━━━━━━━━━━━━━━━━━━━━━━━
🔹 BEST USED ON
• Timeframe: 15min
• Pairs: BTC, ETH, BNB, ADA, SOL, AVAX, XRP
• Market: Crypto perpetual futures
• Works on any pair — check the dashboard for each pair's performance before trading
━━━━━━━━━━━━━━━━━━━━━━━━━━━━━━━
🔹 ALERTS
Built-in alert conditions:
• "Long Signal" — fires on confirmed LONG entry
• "Short Signal" — fires on confirmed SHORT entry
• "TP Hit" — fires when take profit is reached
• "SL Hit" — fires when stop loss is reached
Supports webhook for automated trading.
━━━━━━━━━━━━━━━━━━━━━━━━━━━━━━━
⚠️ DISCLAIMER
This indicator is for educational and informational purposes only. Past performance does not guarantee future results. Always manage your risk and never trade with money you cannot afford to lose. The author is not responsible for any financial losses.
אינדיקטור

אינדיקטור

אינדיקטור

אינדיקטור

Daily Bias - ICT Logic [LliterH]█ OVERVIEW
The Daily Bias ICT Next Day Model LliterH is a specialized institutional tool designed to automate the "Next Day Model" of price action narrative. By analyzing the relationship between the daily close and Previous Day liquidity levels (PDH/PDL), this indicator projects a high-probability directional bias for the upcoming session.
█ THE LOGIC: 4 MARKET SCENARIOS
This script identifies the exact closing conditions of the daily candle to define the following states:
Bullish Continuation: Triggered when the daily candle closes above the Previous Day High (PDH).
Bearish Continuation: Triggered when the daily candle closes below the Previous Day Low (PDL).
Bullish Reversal: Occurs when price sweeps the PDL but fails to close below it, closing back inside the range.
Bearish Reversal: Occurs when price sweeps the PDH but fails to close above it, closing back inside the range.
Consolidation: Identified when price remains trapped within the previous range without expansion or a sweep, resulting in a Neutral bias.
█ TIMEFRAME ALIGNMENT (HOW TO USE)
For high-probability results, Lliter H recommends a strict top-down "Timeframe Alignment" approach:
Daily Chart (The Narrative): Identify the projected Daily Bias. This is your directional "North Star."
1-Hour Chart (The POI): Locate a clear Point of Interest (POI), such as a Fair Value Gap (FVG) or Order Block, that aligns with your bias.
15m or 5m Chart (The Execution): Once price reaches the 1H POI, zoom into the 15-minute or 5-minute charts to find a market structure shift or entry trigger.
█ THE CREATOR'S EDGE: FILTERS
POI Confluence : Reversal signals are significantly more valid when they occur within a higher-timeframe POI.
[* ]Candle Formation (OHLC/OLHC):
Bullish Bias: Watch for the OLHC model (Open, Low-sweep, expansion High, Close).
Bearish Bias: Watch for the OHLC model (Open, High-sweep, expansion Low, Close).
Consolidation Avoidance: Staying sidelined during Neutral bias periods is a hallmark of professional risk management.
█ FEATURES
Automated PDH/PDL Mapping: High-definition tracking of institutional liquidity levels.
Bias Dashboard : Real-time UI indicating the current session narrative.
Historical Backtesting Labels : Automatically plots historical bias labels on the daily chart for deep statistical study.
Non-Repainting Logic : Uses optimized request.security to ensure data remains fixed once the daily candle is closed.
█ COMPLIANCE & RECOMMENDATION
This script follows all TradingView professional publication requirements. It is a tool for directional projection, not a standalone signal generator. Professional results require the application of the Timeframe Alignment strategy mentioned above.
█ DISCLAIMER
Past performance is not indicative of future results. Trading involves a significant risk of loss. The "Next Day Model" is a probabilistic projection of market behavior. This script is provided for educational and technical analysis purposes only. Perform your own due diligence before any live execution. אינדיקטור

MTF Pressure Confluence This indicator analyzes buying and selling pressure inside each candle, normalizes it with volume, and evaluates who is in control of price.
It then expands this logic across multiple timeframes to detect when market pressure aligns, providing clear visual signals and a structured decision framework.
⚙️ How It Works
The script measures:
Buying Pressure → strength of closes off the low
Selling Pressure → strength of closes off the high
Force → net difference between buyers and sellers
Each value is:
normalized using EMA
weighted by volume
smoothed to reduce noise
From this, the script determines:
momentum direction
strength of participation
whether pressure is increasing or fading
🧠 Multi-Timeframe Logic
The indicator evaluates pressure conditions on:
1 Minute
3 Minute
5 Minute
Each timeframe is classified as:
Bullish
Bearish
Neutral
Fresh Crossover (early signal)
A signal is only generated when:
✔ all selected timeframes align
✔ momentum confirms (force + slope)
✔ optional filters (EMA / VWAP) are satisfied
📊 Dashboard Table
The built-in table provides a full breakdown of market conditions:
State → BULL / BEAR / X-UP / X-DN
Buy Slope → whether buying pressure is increasing
Sell Slope → whether selling pressure is increasing
Force → net directional bias (+ / -)
Alignment → BUY / SELL when all timeframes agree
This allows traders to quickly assess trend strength, timing, and structure.
🎯 Signals
The script provides multiple signal layers:
Cross Dots
Aqua → bullish pressure crossover
Orange → bearish pressure crossover
Pane Signals
Visual confirmation of alignment in the indicator window
Main Chart Arrows
BUY / SELL labels plotted directly on price
Trigger only when full multi-timeframe confluence is reached
📈 Best Use Cases
Intraday trading (1m–5m scalping)
Momentum continuation setups
Identifying early trend shifts
Filtering out weak or conflicting signals
⚠️ Notes
This indicator is based on price action and volume, not true bid/ask order flow
Designed as a pressure-based momentum model, not a footprint replacement
Best used alongside key levels, VWAP, or structure
🚀 Key Advantage
Unlike traditional indicators, this tool combines:
price structure
volume weighting
momentum expansion
trend filtering
multi-timeframe alignment
➡️ Delivering a clear, structured view of market control and timing אינדיקטור

אינדיקטור
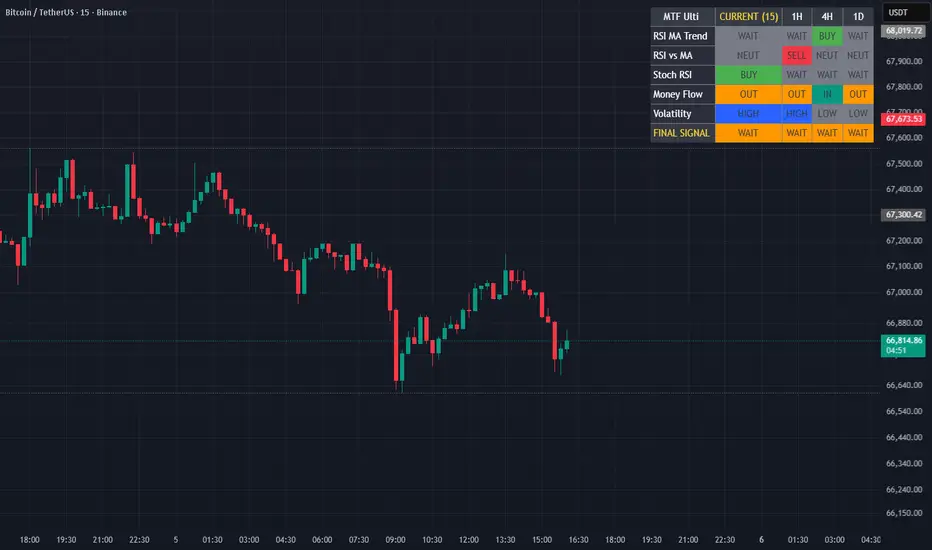
MTF Ultimate Market State DashboardOverview
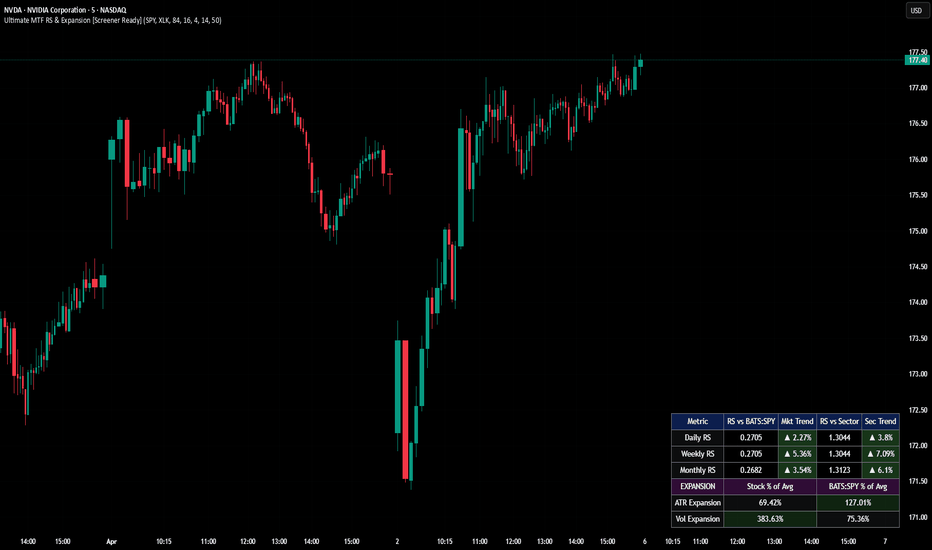
The MTF Ultimate Market State Dashboard is a comprehensive visual tool designed to provide a bird's-eye view of market conditions across multiple timeframes (Current, 1H, 4H, and Daily). Instead of flipping through charts, this dashboard aggregates trend, momentum, and volatility data into a single, clean interface.
Why this Mashup?
Trading in isolation on a single timeframe often leads to "noise" traps. This script combines four core technical pillars to confirm high-probability setups:
RSI & MA Synergy: Detects if the relative strength is trending above its average.
Stochastic RSI: Identifies momentum shifts and overbought/oversold exhaustion.
Money Flow Index (MFI): Integrates volume-weighted momentum to ensure price moves are backed by liquidity.
ATR Volatility: Monitors if the current price action is expanding or contracting relative to historical norms.
How it Works (The Logic)
The dashboard calculates data from higher timeframes using request.security.
RSI MA Trend: Signals a 'BUY' if the RSI Moving Average is below 50 but sloping upwards (recovery phase), and 'SELL' if above 50 but sloping downwards (distribution phase).
RSI vs MA: A direct comparison. If RSI > MA and rising, it indicates bullish dominance.
Final Signal: This is a confluence logic. A 'BUY' signal is triggered only when the RSI Trend, RSI vs MA, and Stoch RSI are all bullish AND the Money Flow Index is above 50.
Repaint Protection: Users can toggle Allow Repaint. When off, it uses closed-bar data (lookahead_off) to ensure signals are stable and reliable for live trading.
How to Use
Trend Alignment: Look for columns where multiple timeframes show the same color (Confluence).
Scalping: Use the 'Current TF' row for quick entries while ensuring the '4H' or '1D' trend is in your favor.
Volatility Filter: Use the 'Volatility' row to avoid trading in "dead" markets where ATR is significantly below its average. אינדיקטור

אינדיקטור

XAUUSD Quant SMC (10Min)Estrategia XAUUSD: Convergencia de Estructura y Optimización de Descuento (SMC)
Esta estrategia automatizada para Pine Script v5 implementa un modelo de ejecución basado en Smart Money Concepts (SMC), priorizando la preservación de capital mediante un control de riesgo algorítmico y filtros de tendencia de alta jerarquía.
Fundamentos Teóricos
El sistema opera bajo la premisa de que el precio se mueve de forma fractal, buscando liquidez tras quiebres de estructura confirmados. Se enfoca exclusivamente en el mercado del Oro (XAUUSD) debido a su alta volatilidad y profundidad de mercado, factores necesarios para la validación de zonas de oferta y demanda.
1. Filtros de Direccionalidad de Alta Jerarquía
La estrategia no busca reversiones. Utiliza un motor de análisis multi-timeframe (MTF) para asegurar que la ejecución en micro-tendencias (10Min) esté alineada con el flujo de órdenes institucional de marcos temporales mayores:
Contexto Diario (1 Semana): Define el sesgo direccional a largo plazo.
Estructura de 4 Horas (4H): Actúa como filtro de impulso para evitar periodos de distribución o acumulación lateral.
2. Confirmación de Estructura (BOS)
La validación de la entrada requiere un Break of Structure (BOS) en la temporalidad de 15 minutos. Este evento técnico confirma que el mercado ha superado un punto de pivot relevante, validando la continuación del movimiento previo y estableciendo un nuevo rango de negociación.
3. Ejecución en Zona de Descuento
Una vez detectado el BOS, el algoritmo proyecta niveles de retroceso de Fibonacci. La entrada se programa en el nivel 0.618, buscando optimizar la relación Riesgo/Beneficio (RR). Este nivel representa la "zona de descuento" (en compras) o "zona premium" (en ventas), donde la probabilidad de continuación es estadísticamente superior tras la toma de liquidez interna.
Protocolo de Gestión de Riesgo Cuantitativo
El núcleo de la estrategia es su gestión de riesgo inflexible, diseñada para mitigar el impacto de las rachas de pérdidas y evitar el sobre-apalancamiento.
Riesgo Fijo: 1% del valor actual del capital por cada operación. El lotaje se recalcula dinámicamente en cada señal en función de la distancia al Stop Loss.
Ventana Operativa: Limitada de 07:00 a 13:00 (GMT+1). Este rango captura la volatilidad de apertura de Londres y el solapamiento inicial con Nueva York, periodos donde los BOS tienen mayor validez.
Límites de Pérdida (Circuit Breakers):
Diario: -1% (Límite de un trade por día).
Semanal: -3% acumulado.
Mensual: -6% acumulado.
Objetivo Semanal (Safe Exit): Alcanzado un beneficio del +3% en la semana, el script cesa la actividad operativa para asegurar el rendimiento y evitar el riesgo de mercado innecesario.
Especificaciones Técnicas y Configuración
Activo: XAUUSD.
Temporalidad de ejecución: 10Min (Análisis en 1 Semana, 4H, 15M).
Versión de Script: Pine Script v5 (Sin Lookahead Bias).
Nivel de Entrada: 0.618 Fibonacci.
Stop Loss: Colocado en el origen del impulso (inicio del rango de Fibonacci).
Notas de Implementación
Para obtener resultados de backtesting realistas, se recomienda configurar un deslizamiento (Slippage) de 3 a 5 ticks y aplicar comisiones equivalentes a las de una cuenta ECN (Raw Spread). El script utiliza funciones de seguridad para solicitar datos de otras temporalidades solo al cierre de cada vela, eliminando cualquier sesgo de anticipación de datos futuros. אסטרטגייה

SMA and Day ATP(Variable)**Why Variable Anchored VWAP (ATP 2D, 3D, etc.) Changes the Way You Read Price**
Most traders stick to fixed anchors like Daily, Weekly, or Monthly VWAP. That works—but it also locks you into rigid cycles that don’t always match how the market is actually moving.
**Variable Anchored VWAP (2D, 3D, 5D…) introduces flexibility.**
Instead of forcing price into calendar-based structure, you define the accumulation window.
---
### 🔹 What this logic really does
* Aggregates price × volume over a **custom multi-day block**
* Resets after a defined number of sessions (e.g., every 2 or 3 days)
* Tracks the **average participation price across that block**
This creates a **mid-frequency structure** between Daily and Weekly.
🔹 Key benefits
**1. Captures short-term institutional positioning**
Daily VWAP is too reactive.
Weekly VWAP is too slow.
👉 2D/3D VWAP sits in between—often aligning with **real accumulation/distribution phases**.
**2. Filters intraday noise**
Single-day VWAP is sensitive to:
* Opening volatility
* News spikes
* Low liquidity moves
👉 Multi-day anchoring smooths this out, giving a **cleaner directional bias**.
**3. Improves trend clarity**
When price holds above a 2D/3D VWAP:
* It reflects **sustained buying across sessions**, not just intraday strength
Same logic applies for bearish structure.
**4. Early trend detection vs Weekly VWAP**
Weekly VWAP reacts late.
👉 A 2D or 3D anchor often shifts direction **before weekly confirmation**, helping you catch moves earlier without dropping to noisy lower timeframes.
**5. Better pullback zones**
Variable VWAP acts as a **dynamic support/resistance band**:
* Rising VWAP → pullbacks into it often get bought
* Falling VWAP → rallies into it often get sold
Because it represents **multi-session average cost**, not just one day.
🔹 Practical structure
* **Daily VWAP → execution**
* **2D / 3D VWAP → short swing bias**
* **Weekly VWAP → dominant trend**
When these align, probability improves significantly.
🔹 Important distinction
This is **not a rolling VWAP**.
✔ Fixed block logic:
Day 1–2 → reset
Day 3–4 → reset
It reflects **discrete accumulation phases**, not continuous averaging.
🔹 Final thought
Markets don’t move in neat calendar units.
They move in **phases of accumulation and expansion**.
Variable Anchored VWAP helps you track those phases more realistically—bridging the gap between noise and structure.
אינדיקטור

אינדיקטור

אינדיקטור

אסטרטגייה

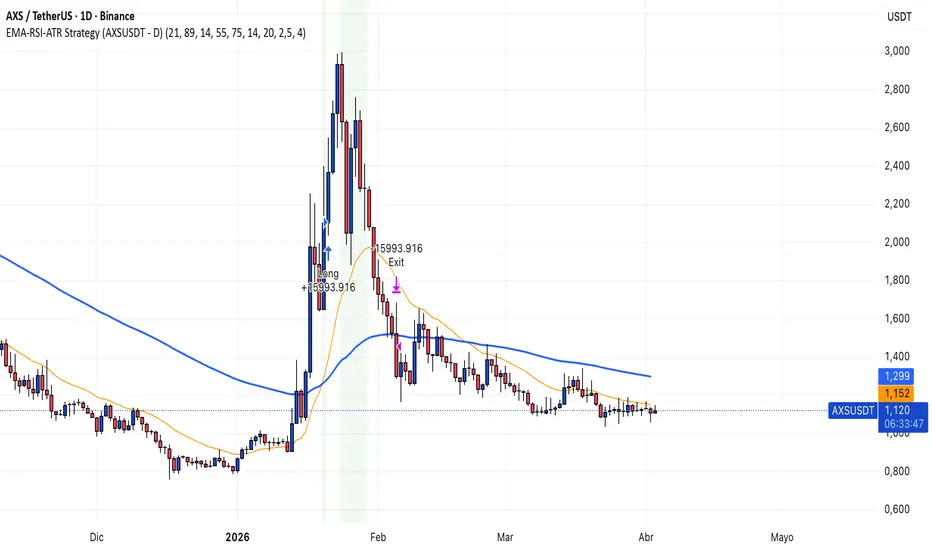
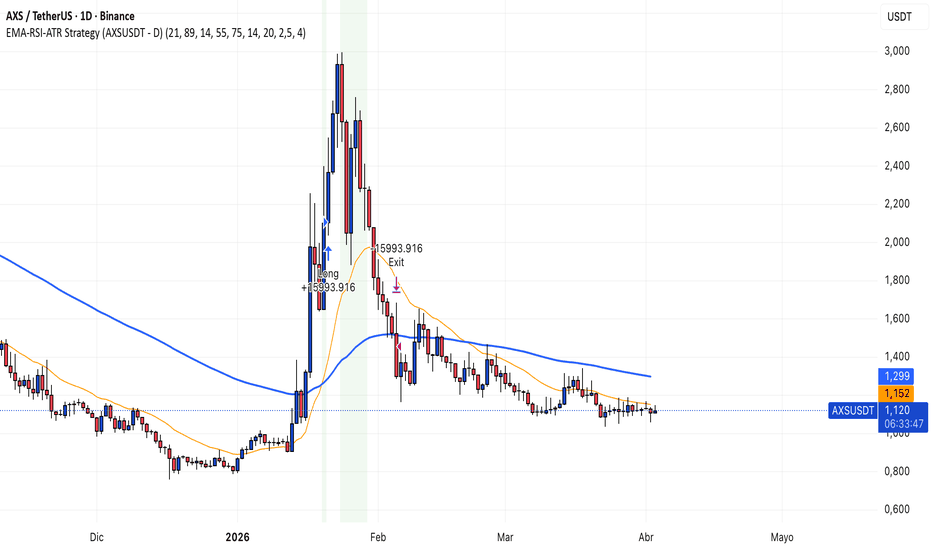
EMA-RSI-ATR Strategy (AXSUSDT - D)Estrategia EMA-RSI-ATR (AXSUSDT - Diario)
Esta es una estrategia cuantitativa de seguimiento de tendencia (Trend Following) diseñada para operar en los mercados de criptomonedas de alta y media capitalización. El sistema utiliza una combinación de filtros de tendencia, fuerza relativa y volatilidad para identificar entradas de alta probabilidad en activos volátiles.
🎯 Filosofía del Sistema
El objetivo es capturar el "cuerpo" de los movimientos direccionales fuertes. La estrategia está programada para ignorar mercados en consolidación (laterales) y solo ejecutar órdenes cuando el momentum y la volatilidad confirman que un movimiento tiene altas probabilidades de continuación.
🛠️ Configuración de Indicadores (El "Core")
Estructura de Tendencia (Doble EMA):
Utilizamos la EMA 21 (rápida) y la EMA 89 (lenta).
Solo se permiten compras si la EMA 21 está por encima de la EMA 89 y el precio cierra por encima de la media rápida. Esto garantiza que operamos a favor del flujo institucional.
Filtro de Momentum (RSI de 14 periodos):
Rango Operativo: 55 - 75.
Este filtro es crítico: el valor de 55 asegura que hay fuerza compradora real, mientras que el límite de 75 nos protege de entrar en "clímax" de compras donde el riesgo de retroceso es máximo.
Filtro de Volatilidad (ATR):
Comparamos el ATR actual contra su media móvil de 20 periodos.
Si el mercado no tiene volatilidad (está plano), la estrategia no opera. Esto evita el "desgaste" de la cuenta por señales falsas en rangos estrechos.
🛡️ Gestión de Riesgo y Salidas
La estrategia prioriza la supervivencia del capital mediante niveles dinámicos basados en la volatilidad del activo:
Stop Loss Técnico: Situado a 2.5x ATR del precio de entrada. Esto permite que cada criptomoneda "respire" según su propia volatilidad.
Take Profit: Situado a 4.0x ATR. Buscamos un ratio riesgo/beneficio positivo superior a 1:1.5.
Costes de Operación: El script ya descuenta automáticamente un 0.075% de comisión y aplica 2 ticks de slippage para reflejar resultados de trading real en exchanges como Binance, Bybit o OKX.
📈 Recomendaciones de Uso
Activos: Ideal para BTC, ETH, SOL y otras Altcoins con volumen.
Temporalidad: Optimizado para 4H y 1D.
Gestión: El tamaño de posición por defecto es el 40% del equity, lo que permite una gestión de riesgo profesional (aprox. 1.5% - 2% de riesgo real sobre la cuenta por trade).
📝 Instrucciones de Instalación
Copie el código en su Pine Editor.
Añádalo al gráfico.
En la pestaña de "Configuración", puede ajustar los multiplicadores de ATR y los niveles de RSI para adaptarlos a la volatilidad específica del par que esté analizando.
Descargo de responsabilidad: Los resultados pasados no garantizan beneficios futuros. Realice su propio backtesting antes de operar con capital real.
💡 Un último consejo para tu publicación:
Cuando estés publicando, en la sección de "Categoría", asegúrate de marcar:
Trend Analysis (Análisis de tendencia)
Momentum
Volatilidad אסטרטגייה
אינדיקטור