[3Commas] Silicon Vault Long - INTC DCA Strategy Silicon Vault Long — INTC DCA Strategy
🔷 What it does:
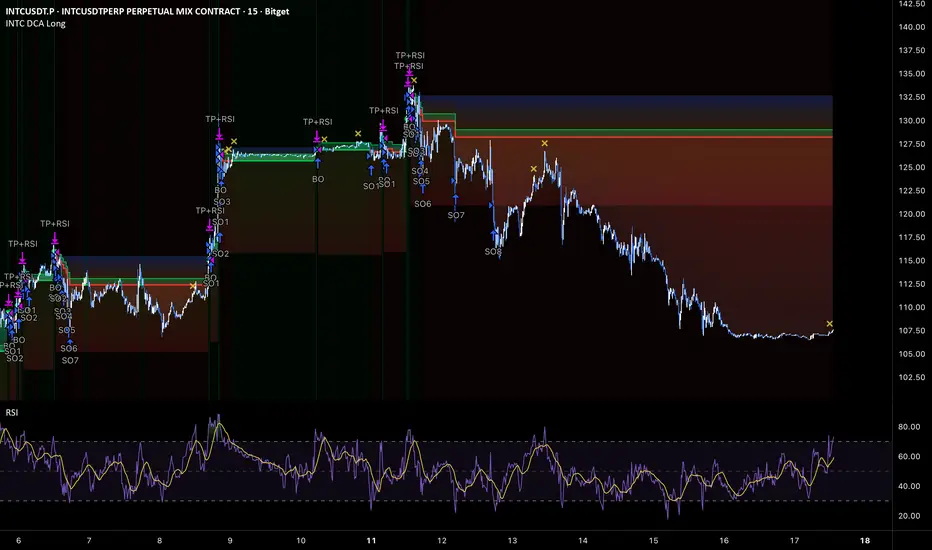
This strategy executes a long-only Dollar-Cost-Averaging approach on tokenized Intel (INTCUSDT) perpetuals, using an RSI-based exit gate to capture momentum-confirmed take-profits on overbought rebounds. It opens base orders continuously when no active deal exists, layers a structured 8-level safety order ladder during price drawdowns, and exits only when RSI crosses above the overbought threshold AND the position has accumulated the minimum profit target from the average entry. Calibrated for the volatility profile of tokenized semiconductor stocks, where structural bullish drift in mega-cap tech combines with intraday volatility unique to perpetual contracts on equity tokens.
- Base Order entry: nonstop — opens immediately when no active deal exists
- Safety Order ladder: 8 levels with cumulative deviation (step coef 1.22), all SOs equal size
- Exit: RSI(14) on 15m crosses above 70 AND profit ≥ 0.6% from average entry (dual-gate close)
- 2× leverage (isolated), no stop loss
🔷 Who is it for:
Traders looking to apply DCA logic to tokenized semiconductor / tech equity perpetuals.
Bot operators who automate execution through webhook integration with a DCA Bot.
Traders seeking exposure to mainstream tech stocks through perpetual contracts during structural bull phases.
Discretionary traders who want a signal framework with momentum-confirmed exits rather than fixed-percentage closes.
🔷 How does it work:
Long Entry: A base order opens whenever no active deal exists and the bar is confirmed within the configured window. There is no signal-based entry filter — the strategy reloads continuously, treating each new deal as a fresh DCA cycle. This is appropriate for instruments with sustained upward bias, as Intel's tokenized perpetual demonstrates during the reference period.
Short Entry: Not used — strategy is long-only by design.
Exit Management: The full position closes when two conditions align simultaneously — RSI(14, 15m) crosses above 70 (momentum-confirmed overbought signal) AND unrealized profit from average entry reaches the minimum threshold (default 0.6%). The dual gate prevents premature exits during shallow rebounds and prevents structural exits when profit is below threshold. The strategy carries no stop loss; invalidation is replaced by the depth of the safety order ladder (cumulative −8.88% from base across 8 levels) plus the underlying bullish drift assumption for tokenized equities.
🔷 Why it's unique:
Dual-gate exit logic — most DCA strategies use either a fixed-percentage TP or a signal-only exit. This combines them: the RSI signal acts as a momentum-confirmed exit trigger, but only fires when the position is also profitable above the minimum threshold. This filters out RSI-triggered exits that would close deep-averaged positions at a loss, ensuring every signaled close is both timing-confirmed and economically rational.
Semiconductor sector focus — calibrated for tokenized semiconductor stocks (Intel, AMD, NVDA proxies) where chip-cycle volatility creates the kind of intraday range that DCA bots monetize through structured averaging. Intel's specific volatility profile of 2025–2026 produced an ideal regime for this framework.
Bot Integration — entry and exit alerts ship with webhook-ready JSON payloads. Bot ID, Email Token, and pair label are exposed as inputs and automatically embedded into the alert message format.
🔷 Considerations Before Using the Indicator:
Market & Timeframe: Designed for a 15-minute chart on tokenized equity perpetuals with active intraday range. Best suited to mega-cap tech instruments with sustained bullish drift and regular pullback structure (Intel, AMD, MSFT, GOOGL, NVDA proxies). Less suited for sustained downtrends or instruments without structural upside bias — tokenized stocks have an embedded long-term upward expectation that crypto-native pairs do not always share.
Limitations: The strategy carries no stop loss. In sustained downtrends extending beyond the deepest safety order (−8.88% from base), the position holds unrealized loss until either the average is recovered through subsequent bounces or the deal is manually closed. The structural assumption is that the underlying tokenized equity will mean-revert upward over time due to its embedded bullish drift. If this assumption breaks (e.g., during a sustained semiconductor sector bear cycle), the strategy is materially exposed.
Backtesting & Demo Testing: The reference results were generated on Bitget USDT-M Perpetual Futures for INTCUSDT during a strong bullish phase for Intel stock (Jan 2025 — Mar 2026, 437 days). Performance during different equity market regimes (chip cycle downturns, broad tech corrections, rangebound periods) may differ significantly. Always validate on extended history and re-test across multiple instruments before deploying real capital. Demo-trade for at least one month before live deployment. Past performance is not indicative of future results.
Parameter Adjustments: Commission defaults to 0.06% (Bitget USDT-M taker). Adjust for your venue. Leverage is set to 2× isolated — increase or decrease per your risk tolerance. RSI threshold (70) and the minimum profit gate (0.6%) should be tuned per instrument volatility — tighter thresholds for lower-volatility tokenized stocks, wider for high-beta semiconductor tickers. SO step (0.5%) and step coefficient (1.22) define ladder depth; widen the step for instruments with bigger intraday swings.
🔷 STRATEGY PROPERTIES
Symbol: BITGET:INTCUSDT.P (Intel Corp tokenized perpetual on Bitget). Strategy is generic — works on any tokenized equity perpetual.
Timeframe: 15m chart.
Test Period: Jan 2025 — May 17, 2026.
Initial Capital: 500 USDT.
Order Size per Trade: Base Order 11.25 USDT, Safety Orders 7.5 USDT each (×8 = 60 USDT). Maximum cumulative position notional ≈ 71.25 USDT per deal. With 2× isolated leverage, margin requirement ≈ 35.6 USDT.
Commission: 0.06% taker (Bitget USDT-M Perpetual reference). Adjust per venue.
Slippage: 2 ticks — typical taker execution on liquid perpetuals.
Margin for Long and Short Positions: 50% (2× isolated leverage).
Indicator Settings: Default Configuration.
Base Order Volume: 11.25 USDT
Safety Order Volume: 7.5 USDT
Max Safety Orders: 8
Price Step (1st SO): 0.5%
Step Coefficient: 1.22
Volume Coefficient: 1.0
RSI Length: 14
RSI Threshold: 70
RSI Timeframe: 15m
Min Profit: 0.6% from average entry
Strategy: Long Only.
🔷 STRATEGY RESULTS
⚠️ Remember, past results do not guarantee future performance.
Net Profit: +55.96 USDT (+11.19%)
Max Drawdown: 16.75 USDT (3.13%)
Total Closed Trades: 320
Percent Profitable: 88.75% (284 / 320)
Profit Factor: 23.701
Reference TradingView Pine backtest on BITGET:INTCUSDT.P (15m chart) for the available history window Jan 1 2025 — May 17 2026 (252 days). The exceptional win rate (88.75%) and Profit Factor (23.701) reflect the structurally bullish phase for Intel stock during the test window combined with the strategy's deep safety order ladder that absorbs intraday pullbacks. These metrics are regime-dependent and not expected to persist through semiconductor sector downturns or sustained bear cycles. Re-test on your own venue with venue-specific commission before live deployment.
🔷 How to Use It:
🔸 Adjust Settings: Set Base Order and Safety Order volumes proportional to your account size and risk tolerance. The default 11.25 / 7.5-USDT structure is calibrated for a 500-USDT test account with 2× leverage; scale linearly to your equity. RSI threshold can be tightened to 65 for more frequent exits or widened to 75 for fewer, larger captures. The SO step should be widened on instruments with higher intraday volatility.
🔸 Results Review: Verify Maximum Drawdown stays within your personal risk budget. The strategy is configured for a conservative per-deal risk envelope (max position 71.25 USDT, full ladder coverage at −8.88% from base), but extended history may shift this profile. Re-test on your own venue using venue-specific commission and slippage. The strategy's performance on the tested window is regime-dependent — performance during semiconductor sector downturns has not been validated. Demo-trade for at least one month before any live deployment.
🔸 Create alerts to trigger the DCA Bot: Two alert messages are exposed by the strategy — "Deal Start" fires on each new base order, and "Deal Close" fires when the dual-gate exit triggers. Configure both alerts in TradingView with the webhook URL pointing to your DCA Bot's signal endpoint. Once configured, the strategy publishes the signal and the bot handles execution on the exchange autonomously.
🔷 INDICATOR SETTINGS
Base Order Volume (USDT) — Notional value of the initial entry per cycle.
Safety Order Volume (USDT) — Notional value of each averaging-down order; all SOs equal size by default.
Max Safety Orders — Total number of averaging steps available per deal.
Price Step % (1st SO from base) — Percentage deviation from base price for the first safety order.
Martingale Step Coefficient — Multiplier applied to each successive deviation step.
Martingale Volume Coefficient — Size multiplier applied to each successive safety order (default 1.0 = all equal).
Require RSI cross-above for close — Toggle the dual-gate exit; off makes it pure %-profit close.
RSI Length / Threshold / Timeframe — Parameters for the exit RSI signal.
Min Profit % (from avg entry) — Minimum unrealized profit threshold required for the exit gate.
Limit by Date Range — Constrain backtest to a specific date window.
Stats card / Watermark — Display layer controls for on-chart backtest summary and branding.
Webhook — Bot ID, Email Token, and Pair label for DCA Bot signal routing.
👨🏻💻💭 We hope this tool helps enhance your trading. Your feedback is invaluable, so feel free to share any suggestions for improvements or new features you'd like to see implemented.
__
The information and publications within the 3Commas TradingView account are not meant to be and do not constitute financial, investment, trading, or other types of advice or recommendations supplied or endorsed by 3Commas and any of the parties acting on behalf of 3Commas, including its employees, contractors, ambassadors, etc. אסטרטגייה

GS Signal Indicator Final## GS Signal Indicator — Beginner Description
* **GS Signal Indicator** helps you know when a stock is ready, still active, risky, or invalidated.
* It is best used on the **30-minute** and **1-hour** charts.
* The indicator combines trend, momentum, volume, candle strength, and risk into simple signals.
* The system now uses simple signal names:
```text
A = strongest setup
B = main buy setup
```
---
## Main Signals
* **A**
Strongest signal. Best-quality setup.
* **B**
Main buy signal. Structure and timing are both aligned.
* **A↑**
The stock was already in a trade and later upgraded to **A**.
This is usually a confirmation/hold signal, not automatically a new entry.
* **Warn**
Risk is increasing. Be careful, tighten risk, or monitor the trade.
* **Exit**
Exit or avoid. The setup is invalidated.
---
## Screener Status
* **Top A + 1H**
Best condition. 30m has **A** and 1H supports it.
* **Top B + 1H**
Strong condition. 30m has **B** and 1H supports it.
* **30m Only**
30m has **A** or **B**, but 1H is not supporting yet.
* **1H Only**
1H has **A** or **B**, but 30m is not ready yet.
* **Active**
An old **A/B** signal is still valid because no **Warn** or **Exit** appeared after it.
* **Warn**
A warning appeared after the last **A/B** signal. Do not chase.
* **Exit**
An exit appeared after the last **A/B** signal. Ignore the old signal.
The screener version you uploaded is designed to detect actionable states, keep old A/B-type signals visible while no later risk or exit appears, and mark risk/exit status after the last signal.
---
## How to Use It
* Use **30m** for entry timing.
* Use **1H** for confirmation.
* Focus mainly on:
```text
A = strongest setup
B = main buy setup
```
* Best alerts:
```text
Top A + 1H
Top B + 1H
```
* If status is **Active**, the old signal may still be valid, but do not chase if price is already far from the signal area.
* If status is **Warn**, avoid new buying unless a fresh **A** or **B** appears later.
* If status is **Exit**, the old setup is no longer valid.
---
## Simple Trading Rule
```text
Buy / Focus: A or B
Best Quality: Top A + 1H or Top B + 1H
Still Review: Active
Be Careful: Warn
Avoid / Exit: Exit
```
---
## Best Settings
* **Timeframe:** 30m or 1H
* **Display Mode:** Clean
* **Show Dashboard:** ON
* **Show Entry / Stop / Targets:** ON
* **Confirm Candle Close:** ON
Disclaimer
* This indicator is for education and analysis only.
* It does not guarantee profits.
* Always use proper risk management.
אינדיקטור

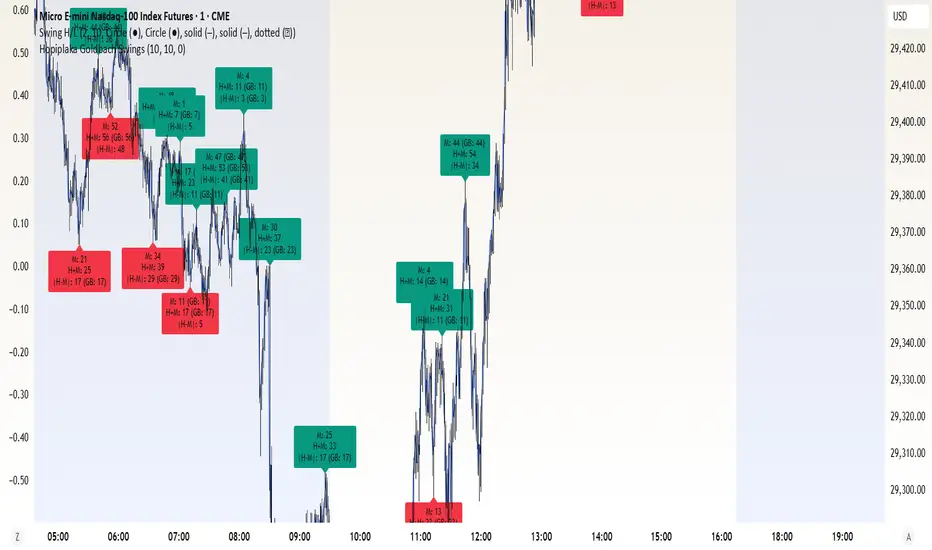
Hopiplaka Goldbach SwingsCore Functionality
Swing Detection: Uses Left and Right Buffer inputs to identify pivot highs and lows using ta.pivothigh() and ta.pivotlow().
Three Reference Points: For every potential swing, it calculates:
Minute: minute(time)
Hour + Minute: hour(time) + minute(time)
|Hour - Minute|: abs(hour(time) - minute(time))
Goldbach/CE Master List: Checks all three references against the master list: 0, 3, 7, 11, 14, 17, 23, 29, 35, 41, 44, 47, 50, 53, 56, 59, 65, 71, 77, 83, 89, 97, 100.
Tolerance: A user-defined tolerance (0 or 1) allows for near-matches.
Display Rules
Conditional Labels: By default, labels only appear if at least one reference point matches a Goldbach number. I've added a toggle to show all swings in gray if you wish to see non-matching pivots.
Color Coding:
Green: Swing High with a Goldbach match.
Red: Swing Low with a Goldbach match.
Gray: Swings with no match (only if "Show All" is enabled).
Inverse Rule (> 60): If a matched Goldbach number is greater than 60, the label displays its complement to 100 (e.g., 89 is displayed as 11). The original reference value (e.g., 89) is still shown for context.
Usage Notes
The script is an overlay, meaning it draws directly on the price chart.
It uses the chart's current timezone to calculate hours and minutes.
You can adjust the Left/Right Buffer to fine-tune the "strength" of the swings (larger buffers result in fewer, more significant pivots) אינדיקטור

Reaction Quality Heat Zones [AGPro Series]Reaction Quality Heat Zones
🧠 Core Idea
Is price reacting with clean quality, or is the zone only producing weak noise and failure pressure?
📌 Overview / What it does
Reaction Quality Heat Zones is a premium TradingView overlay that evaluates the quality of price reactions around a live reference zone. It studies wick rejection, close location, participation, follow-through, and failed-reaction pressure to determine whether the current reaction area deserves attention.
The script produces a forward-projected heat zone, centered zone label, compact event labels, right-side state tags, and an AGPro-style panel. It is designed to show whether a reaction is clean, weak, absorbing pressure, failing, or producing follow-through.
It does not predict price direction, automate trading, or provide guaranteed entries. It is a visual context tool for reading reaction quality.
🎯 Purpose & Design Philosophy
This script was built because many traders can see a reaction after it happens, but struggle to judge the quality of that reaction in real time.
Reaction Quality Heat Zones helps traders evaluate whether a level, area, or market response is actually meaningful, or whether price is only producing low-quality movement around noise.
The mindset is quality-first: not every bounce, rejection, or reaction deserves the same weight.
⚡ Why This Script Is Different
Most tools mark support, resistance, or candle reactions as isolated events.
This script does NOT treat every wick or bounce as equally important.
Instead, it evaluates reaction quality as a combined structure: wick quality, close behavior, participation, follow-through, and failure pressure are all interpreted together.
⚙️ Methodology
1. Context Detection
The script identifies the dominant reaction side by comparing bullish and bearish reaction quality.
2. Reference Mapping
It builds a heat zone around the most relevant recent reaction boundary.
3. Reaction Evaluation
It scores the zone using wick rejection, close quality, participation, follow-through, and distance from the reaction boundary.
4. Visual Output
It displays a projected heat zone, event labels, state tags, and a structured panel.
🗺️ How to Read the Chart
Zones represent areas where reaction quality is being evaluated.
The centered zone label shows the active reaction heat score.
Labels mark clean reactions, weak reactions, absorption risk, failed reactions, and follow-through events.
Colors represent state context:
• Green = clean or follow-through reaction
• Pink = failed reaction pressure
• Yellow = absorption risk
• Indigo = weak or building reaction
The panel summarizes reaction state, direction, heat score, failure pressure, wick quality, follow-through, and next context.
🚦 Signals & States
• CLEAN REACTION → reaction quality is strong and failure pressure is controlled
• FOLLOW-THROUGH → reaction quality is strong and continuation is visible
• WEAK REACTION → reaction quality is not strong enough yet
• ABSORPTION RISK → quality exists, but failure pressure is also elevated
• FAILED REACTION → failure pressure dominates the reaction area
• REACTION BUILD → no decisive reaction state is confirmed
🔔 Alerts Logic
Alerts trigger when a new clean reaction, follow-through reaction, failed reaction, absorption risk, or weak reaction is detected.
Alerts are attention markers only. They are not trade instructions.
🧩 Confluence Logic
The strongest reaction context appears when wick rejection, close quality, participation, and follow-through align.
The weakest reaction context appears when reaction quality is low and failure pressure increases.
📊 When to Use
• Support and resistance reactions
• Breakout retests
• Range boundary reactions
• Pullback reaction checks
• Intraday and swing market-structure review
⚠️ When NOT to Use
• Very low-liquidity symbols
• Random chop without clear reaction areas
• News-driven spikes
• Charts where spreads or data quality distort candles
🎛️ Key Inputs
• Reaction Lookback → controls the recent window used to build the heat zone
• Follow-Through Length → controls continuation evaluation after reaction
• Heat Threshold → defines how strong a reaction must be to qualify
• Failure Threshold → defines when failure pressure becomes important
• Zone Projection Bars → keeps all zone edges visible for publication screenshots
• Panel and label settings → control readability and layout
🖥️ Interface & Visual Design
The interface is built for fast visual interpretation.
The heat zone carries the main story, while the panel provides structured confirmation. Right-side tags keep the current state readable without burying the candles.
The visual design is intentionally premium, compact, and publication-ready.
🧪 Practical Usage Workflow
1. Read the panel state.
2. Check the active heat zone.
3. Compare heat score with failure pressure.
4. Look for clean reaction or follow-through confirmation.
5. Interpret the result within broader market structure.
🔍 Interpretation Guidelines
High heat with controlled failure pressure suggests a cleaner reaction.
High heat with high failure pressure suggests absorption risk.
Low heat suggests the reaction may not be meaningful yet.
Failed reaction pressure does not guarantee reversal. It shows that the reaction area is losing quality.
🚫 What This Script Is NOT
This script is not a prediction engine.
It is not financial advice.
It is not an automated trading system.
It does not provide guaranteed buy or sell signals.
It does not replace risk management.
⚠️ Limitations & Transparency
Reaction quality can change quickly.
Different timeframes may show different reaction behavior.
Volatility, liquidity, market sessions, and sudden news can affect how zones behave.
Outputs should always be interpreted with broader market context.
🧠 Market Context Notes
A good reaction is not only a wick.
It also needs close quality, participation, and follow-through. This script is designed to make that difference visible.
🧾 Use Case Examples
When price reacts from a zone with strong wick quality, strong close behavior, and follow-through, the heat score can confirm a cleaner reaction.
When price reacts but failure pressure rises, the zone may be vulnerable.
When price stays inside the zone without quality, the script may show weak reaction or reaction build context.
🧱 System Philosophy
AGPro Series scripts are designed to make complex market context easier to read without reducing the market to simplistic signals.
This script follows that philosophy by focusing on reaction quality instead of generic support or resistance marks.
🔐 Non-Promise Statement
No script can guarantee future price movement.
This tool provides structured context, not certainty.
📉 Risk Disclosure
Trading involves risk.
Users remain responsible for their own decisions, position sizing, and risk management.
This script does not provide financial advice or guaranteed trading outcomes.
📚 Educational Note
Use this script to study how price reacts around important areas and to compare clean reactions with weak or failed reactions across different market conditions.
אינדיקטור

Candle Intent Map [AGPro Series]Candle Intent Map
🧠 Core Idea
Does this candle show initiative, absorption, rejection, indecision, or a real shift in intent?
📌 Overview / What it does
Candle Intent Map is a candle behavior and market reaction tool designed to read the internal message of price candles beyond simple bullish or bearish color.
The script evaluates body pressure, wick reaction, close location, volume context, short follow-through, and recent intent changes to classify whether the market is showing initiative, absorption, rejection, indecision, or an intent shift.
It produces compact labels, a visible intent pressure zone, right-side context tags, and a clean AG Pro panel. It does not predict price, automate decisions, or promise that a candle pattern will continue.
🎯 Purpose & Design Philosophy
This script was built because many candlestick tools stop at basic pattern recognition.
A candle is not only a shape. It is a relationship between body commitment, wick reaction, volume participation, close location, and what happens immediately after that candle forms.
Candle Intent Map helps traders who want to read candle quality, initiative pressure, reaction zones, and follow-through context without turning the chart into a crowded pattern scanner.
⚡ Why This Script Is Different
Most candle tools focus on named formations such as engulfing candles, pin bars, doji candles, or simple color changes.
This script does NOT treat every candle pattern as an automatic signal.
Instead, it studies whether the candle has enough internal pressure, reaction quality, volume context, and follow-through to deserve attention.
The goal is not to label more candles. The goal is to label the candles that tell a clearer market story.
⚙️ Methodology
1. Context Detection
The script measures body-to-range ratio, upper wick pressure, lower wick pressure, close location, and relative volume participation.
2. Intent Classification
Candles are classified into initiative, absorption, rejection, indecision, or intent shift conditions based on body pressure, wick behavior, and directional commitment.
3. Reaction Evaluation
The script builds a reaction-quality score using body strength, wick reaction, close placement, volume context, and short follow-through behavior.
4. Visual Output
The strongest current candle intent context is mapped as a visible intent zone, compact event labels, right-side state tags, and a structured AG Pro panel.
🗺️ How to Read the Chart
Zones represent the most recent candle intent pressure area.
Labels show important candle intent events such as bullish intent, bearish intent, absorption, rejection, indecision, or intent shift.
Colors separate constructive pressure, defensive pressure, neutral reaction, and absorption-style behavior.
The panel summarizes current intent, direction, body pressure, wick reaction, follow-through, quality score, and next context.
🚦 Signals & States
• BULL INTENT → bullish body pressure with meaningful close location and participation
• BEAR INTENT → bearish body pressure with meaningful close location and participation
• ABSORPTION → strong reaction behavior with compressed body and meaningful volume
• LOWER REJECT → lower wick reaction suggesting downside rejection
• UPPER REJECT → upper wick reaction suggesting upside rejection
• INDECISION → low body commitment with balanced wick behavior
• INTENT SHIFT → recent candle intent changes direction with enough pressure to matter
🔔 Alerts Logic
Alerts trigger when the script detects bullish candle intent, bearish candle intent, candle absorption, or candle intent shift.
These alerts are attention markers only. They highlight a candle context that may deserve review, not a trade instruction.
🧩 Confluence Logic
The strongest context appears when candle body pressure, wick reaction, close location, volume participation, and follow-through point in the same direction.
When these components align, the candle intent quality score becomes stronger.
📊 When to Use
• During active trend continuation phases
• Around reaction zones and pullback areas
• Near support, resistance, VWAP, or liquidity references
• When evaluating whether a candle has real participation behind it
• When comparing initiative candles against absorption or rejection candles
⚠️ When NOT to Use
• Extremely illiquid markets
• Very noisy low-timeframe environments
• News-driven candles with abnormal spreads
• Symbols with unreliable volume data
• Situations where broader market context is ignored
🎛️ Key Inputs
• Volume Context Length → controls the relative volume comparison window
• Follow-Through Length → controls how short-term continuation is measured
• Initiative Body Ratio → changes how strict the initiative candle filter is
• Reaction Wick Ratio → changes how strict wick-based rejection and absorption filters are
• Visible Zone Bars → controls how much of the recent chart the intent zone covers
• Label and Panel Font Size → controls visual readability
🖥️ Interface & Visual Design
The interface is designed to stay clean, readable, and publication-friendly.
The chart focuses on one main intent zone, compact event labels, right-side context tags, and a structured panel.
The visual hierarchy is intentional: zone first, current state second, historical intent events third.
🧪 Practical Usage Workflow
1. Read the panel to understand the current candle intent state
2. Check the intent zone and its position relative to price
3. Review recent labels to understand whether initiative, absorption, or rejection has dominated
4. Compare the quality score with current follow-through
5. Interpret the output inside broader market context
🔍 Interpretation Guidelines
A strong intent label does not mean price must continue.
A rejection label does not mean reversal is guaranteed.
An absorption label means the candle structure showed reaction and participation, but confirmation still depends on the following market behavior.
The best interpretation comes from combining candle intent with structure, liquidity, volatility, and timeframe context.
🚫 What This Script Is NOT
This script is not a prediction engine.
It is not financial advice.
It is not an auto-trading system.
It does not provide guaranteed buy or sell signals.
It does not replace risk management or independent analysis.
⚠️ Limitations & Transparency
Candlestick interpretation changes across timeframes.
Volume quality may differ between markets and exchanges.
Fast volatility expansion can make recent candle intent less stable.
Low-liquidity conditions may create misleading wick or body readings.
Users should always interpret outputs within broader market context.
🧠 Market Context Notes
Candle intent is most useful when combined with structure, liquidity, trend quality, volatility, and acceptance behavior.
One candle rarely tells the whole story. The value comes from understanding whether candle pressure is supported or rejected by what comes next.
🧾 Use Case Examples
When price reaches a known support area and the script prints a lower rejection label with improving quality, the trader can study whether downside pressure is being rejected.
When a strong body candle prints with high quality and follow-through, the trader can evaluate whether initiative pressure is entering the market.
When absorption appears inside a range, the trader can watch whether trapped pressure develops or fades.
🧱 System Philosophy
Candle Intent Map is part of the AGPro Series approach: clean visual tools that focus on market context, reaction quality, and decision support rather than prediction claims.
The script is designed to make candle behavior easier to read while keeping the trader responsible for interpretation.
🔐 Non-Promise Statement
No script can know the future.
No candle label guarantees continuation or reversal.
This tool provides structured visual context only.
📉 Risk Disclosure
Trading involves risk.
Market conditions can change quickly.
All decisions remain the responsibility of the user.
This script does not provide financial advice or guaranteed trading outcomes.
📚 Educational Note
Use this script as an educational and analytical companion for studying candle behavior, reaction quality, and short-term intent context.
אינדיקטור

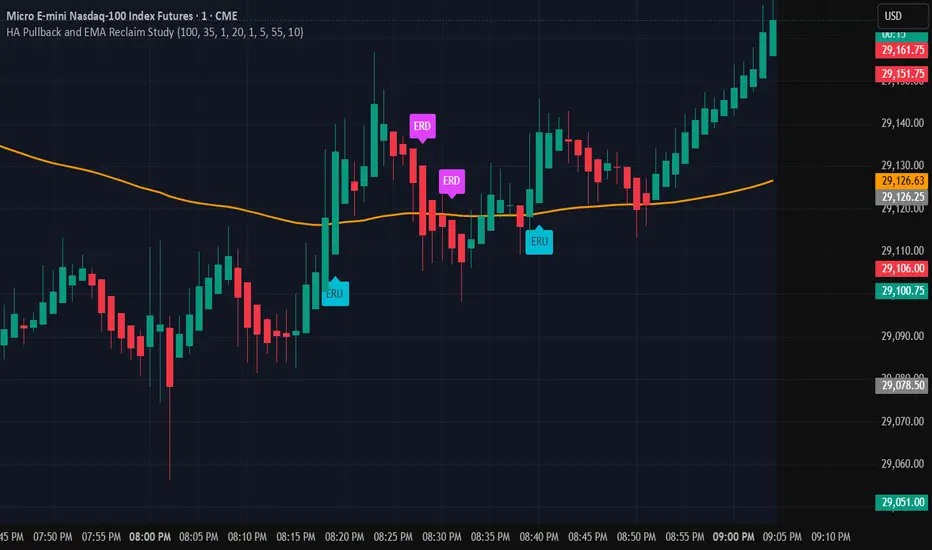
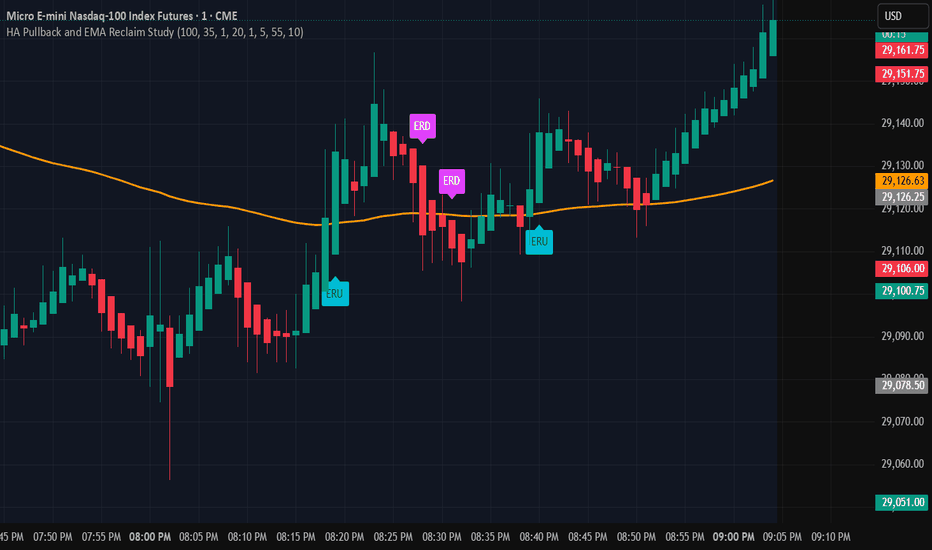
1M Scalping StrategyThis script is an educational Heikin Ashi and EMA study designed to help traders observe pullback/doji conditions and EMA reclaim behavior.
The script uses Heikin Ashi candle data together with a configurable EMA, defaulted to 100. It is designed mainly for short-term chart review and backtesting, especially on lower timeframes such as the 1-minute chart.
There are two main study conditions included:
1. HA Pullback Watch
The pullback watch condition looks for price location relative to the EMA and a specific Heikin Ashi candle sequence.
For a bullish pullback watch, the script looks for:
- Heikin Ashi price above the EMA
- Two red Heikin Ashi pullback candles
- The pullback candles having little to no upper wick
- A green doji-style Heikin Ashi candle forming after the pullback
For a bearish pullback watch, the script looks for:
- Heikin Ashi price below the EMA
- Two green Heikin Ashi pullback candles
- The pullback candles having little to no lower wick
- A red doji-style Heikin Ashi candle forming after the pullback
These conditions are marked as watch or confirmed conditions depending on whether the candle is still forming or has closed.
2. EMA Reclaim Watch
The EMA reclaim portion of the script looks for price moving from one side of the EMA to the other.
A bullish EMA reclaim condition happens when Heikin Ashi price was recently below the EMA, then pushes back above the EMA with a stronger green candle near the EMA area.
A bearish EMA reclaim condition happens when Heikin Ashi price was recently above the EMA, then pushes back below the EMA with a stronger red candle near the EMA area.
The script includes optional settings for:
- EMA length
- Doji body percentage
- Wick tolerance
- Strong candle body percentage
- EMA reclaim lookback
- EMA touch tolerance
- Volume filter
- Showing or hiding different study markers
The chart markers are intended to help users study possible pullback and EMA reclaim behavior. They are not financial advice, trade recommendations, or guaranteed buy/sell signals. Because the script uses Heikin Ashi data, users should be aware that Heikin Ashi candles are calculated candles and may not represent actual traded prices.
This script should be used for educational study, manual review, and backtesting only. Users should apply their own analysis, risk management, and confirmation before making any trading decisions. אינדיקטור
אינדיקטור

Quantitative Smart Money Concepts Framework# Quantitative SMC Framework
An implementation of Smart Money Concepts that combines market structure (BOS / CHoCH / MSS), order blocks, fair value gaps, liquidity sweeps, equal highs/lows, and premium/discount zones into a single confluence framework. The methodology itself is public trading theory from Inner Circle Trader (ICT). The algorithms used to detect each component, and the scoring system that ties them together, are original work.
━━━━━━━━━━━━━━━━━━━━━━━━━━━━━━━━━━━━━━━━━
WHY THESE COMPONENTS BELONG IN ONE SCRIPT
━━━━━━━━━━━━━━━━━━━━━━━━━━━━━━━━━━━━━━━━━
SMC trading depends on confluence. A standalone order block is information, but an order block that sits inside a discount zone, overlaps an active fair value gap, and forms after a liquidity sweep is a setup. Pulling those components from separate indicators forces a trader to eyeball alignment by hand. This script computes alignment directly:
— Order blocks are scored 0–100 based on size, displacement at creation, volume, and overlap with any active FVG on the same side.
— Premium/Discount is anchored to the last major structural event (not the visible range), so confluence with structure is automatic.
— Sweep detection is referenced to actual minor pivots, so a sweep label only appears at structurally meaningful levels — levels where structural reactions often occur.
— Equal highs / lows highlight the liquidity pools that sweeps target.
The output is a single chart where these confluence elements appear together in one place.
━━━━━━━━━━━━━━━━━━━━━━━━━━━━━━━━━━━━━━━━━
IMPLEMENTATION NOTES
━━━━━━━━━━━━━━━━━━━━━━━━━━━━━━━━━━━━━━━━━
◆ Adaptive pivot engine
The default pivot detection confirms a swing only when price retraces by ATR × multiplier rather than after a fixed bar window. Pivot density adapts to volatility — fewer pivots on trending days, tighter ones on chop. A fixed-window mode is available for traders who prefer the classic approach.
◆ Order block quality filter
Instead of taking the last opposite candle before a break, the engine scans a 30-bar structural window and selects the most-extreme candle that passes three filters: body-to-range ratio ≥ 25%, range < 2.5 × ATR (no outlier candles), and above-average volume by a configurable multiplier. The volume filter is optional.
◆ Market Structure Shift vs Change of Character
When a CHoCH occurs, the breaking candle is checked for displacement (body size ≥ multiplier × ATR). Displacement breaks are labelled MSS, non-displacement reversals stay labelled CHoCH. This separates impulsive trend reversals from soft ones.
◆ AVWAP-anchored Premium/Discount
Equilibrium is computed as a volume-weighted average price anchored at the last trend reversal (CHoCH/MSS), not as the midpoint of the visible range. The anchor resets only on a genuine trend change, so continuation BOSes do not invalidate the level. A classic range-midpoint mode is available as an alternative.
◆ Strict liquidity sweep detection
A sweep is flagged only if the wick pokes through a recent minor structural pivot (not a rolling max/min), the wick is at least 0.8 × ATR, the wick is at least 35% of the candle's total range, and 8 bars have passed since the last same-direction sweep. This significantly reduces signal frequency compared to simple wick-based detection without pivot reference or cooldown.
◆ Fair Value Gap fade mode
When an FVG is mitigated, it can either be removed (classic behaviour) or rendered semi-transparent so historical imbalances and price reactions remain visible. An ATR-based minimum size filter removes micro-gaps.
━━━━━━━━━━━━━━━━━━━━━━━━━━━━━━━━━━━━━━━━━
CONFLUENCE SCORE
━━━━━━━━━━━━━━━━━━━━━━━━━━━━━━━━━━━━━━━━━
Each order block carries an optional 0–100 score:
— Size contribution (0–30): zone height relative to ATR
— Displacement contribution (0–30): body size of the breaking candle relative to ATR
— Volume contribution (10–20): above-average volume at zone creation
— FVG overlap (0–20): an active fair value gap of the same side intersects the zone
The score appears as a small label on each zone when enabled. A minimum-score filter hides everything below a chosen threshold.
━━━━━━━━━━━━━━━━━━━━━━━━━━━━━━━━━━━━━━━━━
HOW TO USE
━━━━━━━━━━━━━━━━━━━━━━━━━━━━━━━━━━━━━━━━━
Start on a 1D chart with default settings. Use the major structure (BOS / CHoCH / MSS) to set bias. The setup the scoring system is designed to surface is a high-score order block inside a discount zone, overlapping an FVG, formed after a liquidity sweep. For timeframes below 4H, increase the pivot ATR multiplier to 2.5–3.0 to reduce noise.
Live display mode keeps only the most recent structural elements on the chart. All History mode keeps the full archive — useful for visual backtesting, but slower.
━━━━━━━━━━━━━━━━━━━━━━━━━━━━━━━━━━━━━━━━━
COMPONENTS AND SETTINGS
━━━━━━━━━━━━━━━━━━━━━━━━━━━━━━━━━━━━━━━━━
— Major and minor market structure: BOS, CHoCH, MSS, iBOS, iCHoCH
— Adaptive ZigZag or fixed-window pivot engine
— Order blocks with quality filter, wick or close mitigation
— Fair value gaps with optional fade mode and ATR size filter
— Equal highs / equal lows with ATR-based tolerance
— Liquidity sweeps with cooldown between same-direction signals
— Premium / Discount via AVWAP or range midpoint
— Previous day / week / month highs, lows, and midpoints
— Mono or accent colour themes
— Optional bar painting by minor bias
— Alerts on every structural and signal event
━━━━━━━━━━━━━━━━━━━━━━━━━━━━━━━━━━━━━━━━━
NOTES
━━━━━━━━━━━━━━━━━━━━━━━━━━━━━━━━━━━━━━━━━
Smart Money Concepts methodology is public trading theory from Michael Huddleston (Inner Circle Trader). The implementation here — adaptive pivot engine, quality-filtered order blocks, AVWAP-anchored premium/discount, scoring system, and strict sweep detection — is independent work.
Feedback and bug reports welcome in the comments. אינדיקטור

אינדיקטור

HTF Candle BoxesHTF Candle Boxes — Wick / Body / Wick + Liquidity Window
Renders each higher-timeframe candle (1H, 4H, or 1D) as three horizontal zones drawn over the lower-timeframe bars that compose it. Lets you see HTF structure without leaving your scalp/intraday chart.
What it draws
Upper wick zone — from HTF high down to the body top.
Body zone — tinted green (bullish) or red (bearish) based on HTF open vs close.
Lower wick zone — from body bottom down to HTF low.
Body midpoint — a dotted line at the exact 50% of the HTF body. Useful as an MSS / mean-reversion reference because price respects it more often than mid-of-candle.
Outer wrapper — a subtle gray border around the full HTF high-low range.
Liquidity window lines — two vertical lines per HTF candle bracketing the high-liquidity zones around each HTF rollover:
One 15 minutes after the HTF candle opens (near-open liquidity edge)
One 15 minutes before the HTF candle closes (near-close liquidity edge)
Both lines are confined inside the HTF box (no infinite extension cluttering the chart) and grow vertically with the candle as it forms. They only render on M1 / M3 / M15 / M30 charts — above M30 the 15-min bracket is finer than a bar, so it's hidden.
Why it's useful
HTF candles cleanly show institutional context without scrolling between timeframes.
The body midpoint becomes a real-time pullback / continuation level intraday.
The liquidity bracket marks the 15-min window straddling each HTF rollover, when most desk-driven flow concentrates around the candle close/open — a high-probability place for sweeps, reclaims, and reversal entries.
Inputs
HTF timeframe — 1H, 4H, or 1D.
Fill colors — upper wick, lower wick, bull body, bear body (defaults: gray wicks at 90% transparency, green/red body at 70%).
Show borders + Border color.
Show body midpoint + color, style (solid / dashed / dotted), width.
Wrap HTF candle in outer box + outer border color.
Show liquidity window lines + minutes ± boundary (default 15), color, style.
Implementation note
HTF o/h/l/c are aggregated directly from the LTF bars inside each HTF window — not pulled via request.security. That avoids the one-bar lag where request.security(..., lookahead_off) returns the prior confirmed HTF candle, which would otherwise leave LTF wicks poking outside the box. The boxes here always wrap every LTF bar they contain, on both historical and live data.
Published under MIT-style permissive use — feel free to fork and adapt. אינדיקטור

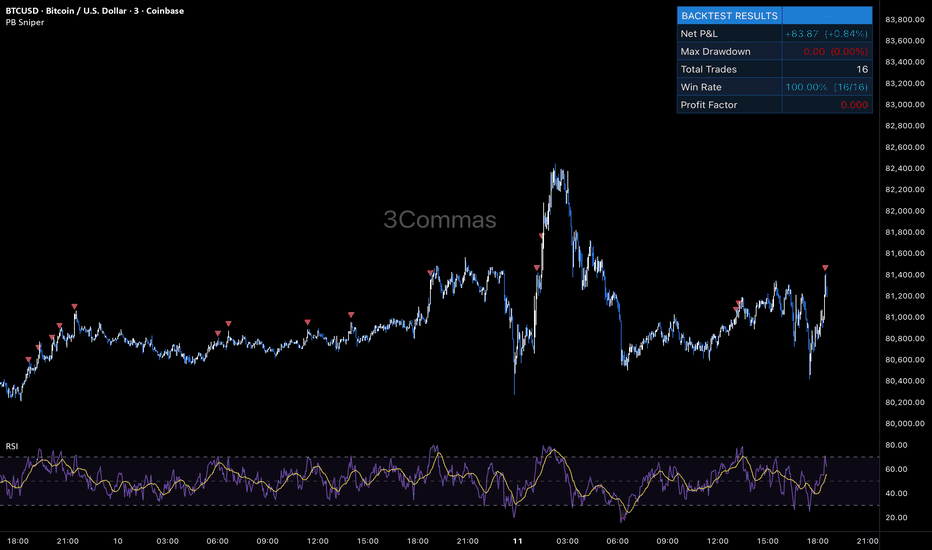
[3Commas] Pullback Sniper - Indicator🔷 What it does:
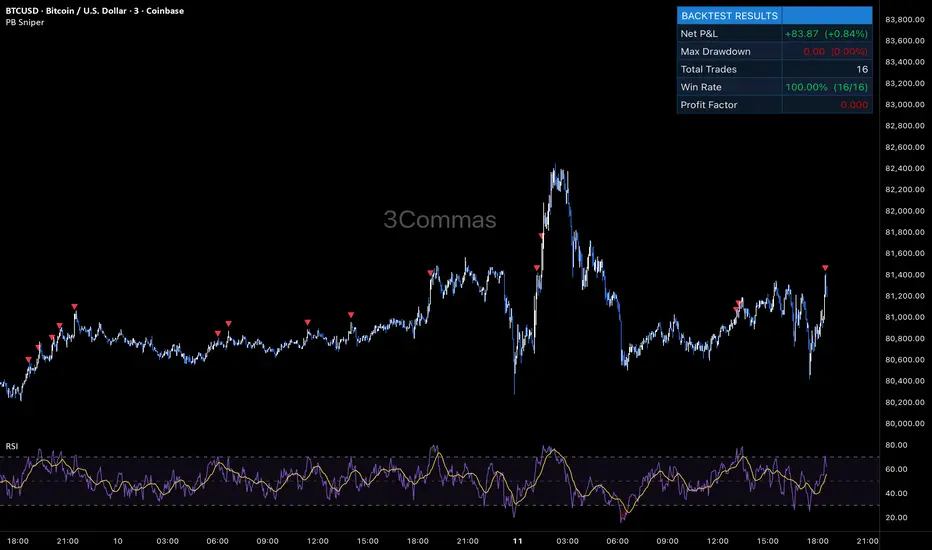
This indicator visualizes a long-only Dollar-Cost-Averaging signal framework driven by a classic RSI oversold-exit trigger on a 3-minute timeframe. It marks base order entries, projects the full safety order ladder, tracks a virtual deal lifecycle on the chart, and exposes webhook-ready alerts for automated execution through an external DCA Bot. No orders are placed by the indicator itself — it is a pure signal and visualization layer.
Base Order signal: RSI(14) crosses below 31 on 3m
Safety Order ladder: 5 levels projected as horizontal lines from base, with filled-state coloring (martingale ×1.30 deviation, ×1.25 volume)
Exit signal: RSI(14) crosses above 69 AND profit ≥ 2.4% from average entry (dual-gate)
On-chart virtual P&L tracker: Net Profit, Max Drawdown, Trades, Win Rate, Profit Factor
🔷 Who is it for:
Bot operators who need a visual confirmation layer for automated intraday DCA execution.
Discretionary traders who use structured averaging logic manually and want clear on-chart triggers.
Free-tier TradingView users who want access to the same signal logic as the Strategy version without requiring backtest functionality.
Cross-instrument testers who run the same signal framework across crypto, perpetuals, and tokenized equities.
🔷 How does it work:
Long Entry: A base order signal fires when RSI(14, 3m) crosses below 31. The indicator marks this with a green triangle below the bar and stores the base price as the reference for the safety order ladder.
Short Entry: Not used - long-only signal framework by design.
Exit Management: A take-profit signal fires when two conditions align simultaneously - RSI(14, 3m) crosses above 69 AND the unrealized profit from average entry reaches the minimum threshold (default 2.4%). This dual gate prevents premature exits during shallow rebounds and structural exits when profit has not yet recovered. The indicator marks the exit with a cyan diamond and resets the virtual deal state.
🔷 Why it's unique:
Dual-gate exit logic - closing requires both an RSI sell signal AND a minimum profit threshold from average entry. This combination filters out RSI-triggered exits that would close deep-averaged positions at a loss, ensuring every signaled close is structurally sound.
Cumulative martingale architecture - safety order trigger prices are computed from the base entry using a cumulative compounding deviation (each successive step multiplied by ×1.30), not by chaining from the previous SO. This produces a smoother, more controlled deepening of the ladder versus pure linear stepping. The full ladder is projected on chart from the moment of base entry, so traders see the entire risk envelope upfront.
Bot Integration - entry and exit alerts ship with webhook-ready JSON payloads, enabling direct trigger of a connected DCA Bot. Two alert conditions ("Deal Start" and "Deal Close") map cleanly to bot deal-start and close-deal endpoints, with Bot ID, Email Token, and pair label all configurable through inputs.
🔷 What you'll see on the chart:
Green triangle (below bar) - Base Order entry signal fired
Red triangle (above bar) - RSI sell signal fired
Cyan diamond - Dual-gate exit triggered, virtual deal closed
Cyan line - Base Entry price (reference for the SO ladder)
Yellow line - Average Entry price (recalculates as SOs fill)
Lime line - Take Profit target (Average × (1 + minProfit%))
Red lines (5) - Full SO ladder projected from base; fades as each level fills
Stats card (top-left, configurable) - Live virtual backtest results: Net Profit, Max Drawdown, Total Trades, Win Rate, Profit Factor
🔷 Considerations Before Using the Indicator:
Market & Timeframe: Designed for a 3-minute base chart on liquid, volatile instruments with active intraday RSI cycling - perpetual contracts, tokenized equities, and major altcoins. Performance degrades on low-volatility assets where RSI rarely reaches the oversold trigger.
Limitations: The indicator does not place orders. It tracks a "virtual deal" state on the chart for visualization purposes only — actual execution must be performed through a connected bot or manually. The signal framework carries no stop-loss component; in sustained downtrends extending beyond the deepest safety order, the virtual deal holds unrealized loss until either the average is recovered or the alert flow is manually overridden. The dual-gate exit can hold positions for extended periods if RSI never crosses above 69 while the profit threshold is unmet — pair this with a manual review cadence.
Virtual P&L Accuracy: The on-chart stats card uses a simplified internal accounting model - it does not factor exchange commission or slippage. Use the Strategy version for fee-adjusted backtest results.
Backtesting & Demo Testing: Always validate the signal framework on historical data before connecting to a live bot. The companion Strategy version of this script is available on the same profile for full backtest analysis with realistic commissions and slippage. Demo-trade for at least one month to observe behavior in conditions not represented in historical data. Past performance is not indicative of future results.
Parameter Adjustments: RSI thresholds (31 / 69) and the SO step (1.3%) should be tuned per instrument volatility profile. Tighter levels on lower-volatility assets, wider on more volatile pairs. The minimum profit threshold can be lowered to 1.5–2.0% for higher trade frequency or raised to 3.0–4.0% for fewer, larger captures.
🔷 Backtest Validation:
This indicator shares identical signal logic with the Strategy version of the same framework, available on this profile for full historical performance review with realistic commission and slippage:
Strategy version:
Reference results from the Strategy version on BYBIT:ADAUSDT (Spot), 3m chart, tested period Feb 9 — May 11, 2026:
Net Profit: +95.00 USDT (+0.95%) | Max Drawdown: 67.16 USDT (0.67%) | Total Trades: 47 | Win Rate: 72.34% (34/47) | Profit Factor: 7.377
Refer to the Strategy publication for the complete equity curve, trade-by-trade breakdown, and Strategy Tester report.
🔷 How to Use It:
🔸 Adjust Settings: Configure the RSI thresholds, SO step, and minimum profit parameters for the instrument you intend to trade. Defaults are calibrated for liquid altcoin spot pairs on a 3-minute chart. For lower-volatility instruments, tighten the SO step and lower the take-profit threshold; for higher-volatility instruments, do the opposite.
🔸 Visual Confirmation: Use the on-chart projections (base entry, SO ladder, average entry, TP target) to verify that the active virtual deal aligns with your bot's actual position. The indicator's virtual deal state is a 1-to-1 mirror of the Strategy version's signal logic, so any divergence between chart visuals and bot position is a flag for investigation.
🔸 Create alerts to trigger the DCA Bot: Two alert events are exposed by the indicator - "Deal Start" fires on each new base order signal, and "Deal Close" fires when the dual-gate exit triggers. Configure both alerts in TradingView with the webhook URL pointing to your DCA Bot's signal endpoint. The Bot ID, Email Token, and Pair label can be set in the script's inputs and are automatically embedded into the alert JSON payload. Once configured, the indicator publishes the signal and the bot handles execution on the exchange autonomously.
🔷 INDICATOR SETTINGS
RSI Length - Period for the RSI calculation (default 14).
RSI Buy Trigger (cross below) - Oversold threshold for the base order signal (default 31).
RSI Sell Trigger (cross above) - Overbought threshold for the exit signal (default 69).
Base Order Volume (USDT, ref) - Reference notional for the initial entry; used for Average Entry projection only.
Safety Order Volume (USDT, ref) - Reference notional for the first averaging-down order; subsequent SOs scale by Volume Coefficient.
Max Safety Orders - Total number of averaging steps tracked in the virtual deal.
Price Deviation % (SO step from base) - Percentage deviation for the first safety order; subsequent steps scale by Step Coefficient.
Martingale Volume Coefficient - Size multiplier applied to each successive safety order.
Martingale Step Coefficient - Multiplier applied to each successive deviation step.
Min Profit % (from avg entry) - Minimum unrealized profit threshold required for the exit gate.
Require RSI Sell Signal to Close - When enabled, both the RSI sell crossover AND the min profit threshold must align (dual-gate exit).
Initial Capital (ref for % calc) - Reference capital base for computing return and drawdown percentages in the stats card.
Visual Layer toggles - Show/hide base line, average line, TP line, full SO ladder, signal triangles.
Stats card / Watermark - Display layer controls for on-chart virtual backtest summary and branding.
Webhook - Bot ID, Email Token, and Pair label for DCA Bot signal routing.
👨🏻💻💭 We hope this tool helps enhance your trading. Your feedback is invaluable, so feel free to share any suggestions for improvements or new features you'd like to see implemented.
__
The information and publications within the 3Commas TradingView account are not meant to be and do not constitute financial, investment, trading, or other types of advice or recommendations supplied or endorsed by 3Commas and any of the parties acting on behalf of 3Commas, including its employees, contractors, ambassadors, etc. אינדיקטור
Precision Candle Close Alert [Anti-Lag] for Scalper & DaytraderAs a scalper or day trader, timing is everything. Standard TradingView alerts often fire 2-3 seconds after the candle has closed due to tick-dependency and server lag. If you are trading the 1m or 5m chart, that delay can cost you money.
The Candle Close Alert (CCA) solves this problem. It is designed for absolute precision and includes a built-in "Anti-Lag" feature. This allows you to trigger the alert slightly before the actual close. By the time the push notification or sound reaches your device, the candle is closing at that exact millisecond.
Key Features:
⚡ Anti-Lag Offset: Compensate for server delays by firing the alert a customizable number of seconds (e.g., 2s) before the candle actually closes.
🎯 True Close Only: Uses strict condition matching to ensure the alert NEVER fires randomly in the middle of a candle. It only triggers on the exact target close.
🔢 Custom Alert Limit: Set a maximum number of alerts (e.g., alert me for the next 5 closes, then automatically stop).
🔄 One-Click Reset: Easily reset the alert counter directly from the indicator settings without having to delete and recreate the alert.
⏱️ Multi-Timeframe Support: Select your target timeframe (from 1m up to Monthly) independently of your current chart resolution.
How to set it up correctly:
Add the indicator to your chart. (Note: Your chart timeframe must be equal to or lower than your selected alert timeframe).
Open the indicator settings and set your target timeframe, the max alert count, and the Anti-Lag Offset (2 to 3 seconds is the recommended sweet spot).
Open the TradingView Alert Menu (clock icon) and click "Create Alert".
Condition: Select "Candle Close Alert" -> "Any alert() function call".
Go to the "Notifications" tab, check "Play Sound", and select a specific sound for this alert.
Click "Create".
Note: Because Pine Script triggers on price ticks, the anti-lag feature will fire on the first tick that occurs within your defined pre-close window.
Tags:
#Scalping #DayTrading #Alerts #CandleClose #Precision #Forex #Crypto #Utility אינדיקטור

Body Close Break Planner [AGPro Series]TITLE
Body Close Break Planner
🧠 Core Idea
Did price break structure with real body-close acceptance, or was the move only a wick event with weak commitment?
📌 Overview / What it does
Body Close Break Planner is built to evaluate whether a structure break is being accepted with real candle-body commitment. Instead of reacting to every wick beyond a prior high or low, the script focuses on closes that actually establish acceptance beyond the rail.
The script maps the body break rail, an acceptance pocket, a retest shelf, a failure rail, and a first target-room reference. It also adds event labels, right-side tags, and a compact AG Pro panel that summarizes the quality of the active break with a 0-100 Body Break Score.
This script does not predict trend continuation, automate entries, or treat every breakout as valid. It is a rule-based analytical and visualization tool that helps users separate real body-close structure acceptance from weaker noise-driven break attempts.
🎯 Purpose & Design Philosophy
This script was built to solve a very common structural problem: many breakout candles look convincing in the moment, but the move fails because the market never achieved real closing acceptance beyond the level.
The tool was designed for traders who want to evaluate whether a break has genuine body-based commitment, whether the first retest is constructive, and where the structure fails if acceptance is lost.
The mindset behind the script is selective, disciplined, and evidence-based. It supports traders who want to read acceptance quality rather than react to every temporary excursion beyond a level.
⚡ Why This Script Is Different
Most breakout tools focus on level crossing, wick penetration, or generic break-and-retest behavior.
This script does NOT treat every breach of structure as a meaningful breakout.
Instead, it asks whether the move closed through structure with enough body commitment, whether price is still being accepted beyond the rail, whether the retest shelf improves the setup, and whether the move still has room before it becomes extended or fails.
⚙️ Methodology
1. Context Detection
The script maps recent structure highs and lows, then checks whether price closes beyond them with enough candle-body commitment and range expansion.
2. Reference Mapping
Once a valid body-close break is confirmed, the script locks the broken rail, builds an acceptance pocket, marks a retest shelf, and defines a failure line plus a first target-room reference.
3. Reaction Evaluation
Price is then reviewed against the body-break rail and the retest shelf. The script checks whether the move is still accepted, whether the retest improves the structure, or whether the breakout falls back through the failure boundary.
4. Visual Output
The final output includes the acceptance pocket, body-break rail, retest shelf, failure rail, room line, event labels, right-side tags, and dashboard panel.
🗺️ How to Read the Chart
Zones:
The acceptance pocket represents the active post-break area where structure acceptance is being judged.
Labels:
Labels identify new bullish or bearish body-close breaks, accepted structure, retest-ready behavior, target review, and failed breaks.
Colors:
Teal represents stronger constructive break behavior.
Pink represents bearish or failed context.
Gold represents review areas such as target-room interaction.
Indigo represents the main body-break rail.
Panel:
The panel summarizes the active break type, the Body Break Score, current acceptance quality, available room, and the current action state.
🚦 Signals & States
• Bull Break → A bullish body-close structure break has been detected.
• Bear Break → A bearish body-close structure break has been detected.
• Body Accepted → Price is still being accepted beyond the broken structure rail.
• Retest Ready → Price interacted with the retest shelf constructively and the setup quality improved.
• Target Review → The first projected room reference has been reached and context should be reassessed.
• Failed → Price moved back through the failure boundary and the break is no longer structurally clean.
• Wait Break → No valid active body-close break exists.
• Expired → The break is too old to remain active within the current framework.
🔔 Alerts Logic
Alerts can trigger when a new bullish or bearish body-close break is detected, when structure remains accepted, when a retest shelf strengthens the setup, when target room is reached, or when the break fails.
Alerts are attention markers only. They highlight structural events inside the script logic. They are not trade instructions, automated entries, or guarantees of follow-through.
🧩 Confluence Logic
The context becomes stronger when multiple conditions align together.
For example, a structure break with a strong body ratio, clean range expansion, stable hold beyond the break rail, and a constructive retest shelf interaction is much stronger than a shallow close that immediately falls back into the old range.
When body commitment, breakout range, retest quality, and available room align together, the context becomes structurally more reliable.
📊 When to Use
• Breakout or breakdown environments where close quality matters
• Markets with clean price structure and readable swing levels
• Crypto, forex, indices, and liquid stocks
• 1H, 4H, and 1D chart review
• Situations where wick-only breaks create repeated false positives
⚠️ When NOT to Use
• Illiquid markets with distorted price prints
• Extremely noisy sessions with poor candle quality
• Very low-range environments where closes carry little structural information
• Symbols dominated by gaps or erratic price jumps
• Conditions where the market repeatedly overshoots levels without clean follow-through
🎛️ Key Inputs
• Structure Lookback → Controls how recent highs and lows are mapped
• Minimum Range Ratio → Controls how much expansion is required before a break qualifies
• Minimum Body / Range → Filters out weak closes and wick-dominant candles
• Close Buffer ATR → Controls how far beyond structure the close must finish
• Acceptance Pocket ATR → Controls the depth of the post-break pocket
• Retest Shelf Buffer → Controls how shelf interactions are interpreted
• Failure Buffer ATR → Controls where the active break becomes invalid
• Visual Settings → Control labels, panel location, theme, font size, and optional chart styling
🖥️ Interface & Visual Design
The interface is designed to answer one question quickly: is this break actually being accepted?
The panel creates a clean information hierarchy so the user can understand break state, score, room, and current action without reading every chart element manually. The chart layer keeps the acceptance pocket, body-break rail, failure line, and room reference readable without overwhelming candles.
The visual intent is professional, premium, and publication-friendly rather than decorative.
🧪 Practical Usage Workflow
1. Read the panel to confirm whether a valid body-close break is active
2. Check the body-break rail and acceptance pocket
3. Evaluate whether price is simply holding or whether the retest shelf improved the structure
4. Review room to the target reference and distance to failure
5. Use labels and tags as context markers, not as direct commands
🔍 Interpretation Guidelines
A stronger score suggests better body commitment, healthier range expansion, and more reliable post-break structure.
A Body Accepted state means price is still holding beyond the broken rail, but it does not automatically mean the move is early or low-risk.
A Retest Ready state suggests the market pulled back in a controlled way and defended the structure more convincingly.
A Target Review state suggests that the first projected room objective has already been reached and the context should be reassessed rather than assumed to continue indefinitely.
🚫 What This Script Is NOT
This script is not a prediction engine.
This script is not financial advice.
This script is not an automated trading system.
This script does not place orders.
This script does not guarantee continuation, retest success, target reach, or profitability.
⚠️ Limitations & Transparency
This script is rule-based and depends on the quality of the underlying market structure.
Different timeframes can produce very different break quality profiles. In high-volatility or low-liquidity conditions, candle closes may appear meaningful while still failing quickly. In some markets, wick behavior may remain important even when the body-close break model is intentionally strict.
Outputs should always be interpreted within broader market context rather than in isolation.
🧠 Market Context Notes
Body-close acceptance often matters most around obvious swing highs, swing lows, range edges, and post-compression expansion points.
A wick beyond structure can attract attention, but a true close beyond structure often tells a more reliable story about commitment. Even so, not every accepted break becomes a trend. Some become retest traps, and some run directly into higher-timeframe resistance or support.
🧾 Use Case Examples
Example 1:
Price closes above a well-defined swing high with a strong body and good expansion. The script marks a bull break, builds the acceptance pocket, and later upgrades the context when the retest shelf holds.
Example 2:
Price breaks below a swing low with body commitment, but then quickly closes back through the failure boundary. The script marks the break as failed, signaling that the downside acceptance did not hold.
Example 3:
A strong body-close break remains accepted and quickly reaches the first target-room line. The script marks target review, reminding the user to reassess efficiency and extension.
🧱 System Philosophy
AGPro Series tools are built as decision-support frameworks, not generic signal generators.
The philosophy here is to reward quality over noise: stronger closes, cleaner acceptance, clearer structure, and more readable post-break behavior.
🔐 Non-Promise Statement
This script does not promise certainty.
It does not promise that a body-close break will continue, hold, retest cleanly, or reach its projected room. It only organizes the structure so the user can evaluate the break with more discipline and clarity.
📉 Risk Disclosure
Trading involves risk.
Market conditions can change quickly, and any analytical tool can become less reliable under shifting volatility, liquidity, or structural conditions. Users remain fully responsible for their own decisions, execution, and risk management.
This script is for educational and analytical purposes only. It does not provide financial advice.
📚 Educational Note
This tool is most effective when combined with broader market structure, liquidity awareness, and disciplined trade management.
It is designed to improve interpretation quality, not to replace critical thinking.
אינדיקטור

אינדיקטור

Sniper Trader V6.5 Pro SMC, FVGs & Volume Sweep EngineSniper Trader Pro is an all-in-one Smart Money Concepts (SMC) indicator designed to filter out market noise and identify high-probability institutional setups. Built for precision, this algorithm detects liquidity sweeps, Fair Value Gaps (FVGs), and volume-backed rejections, giving you a clear visual map of where the "Smart Money" is trapping retail traders.
Optimized for volatile assets like indices (NASDAQ/NQ, S&P500) on the 5-minute timeframe, this tool acts as a complete trading system.
Core Features
Dynamic Liquidity Boxes (FVGs): Automatically plots Demand (Aqua) and Supply (Red) zones based on momentum. The algorithm features a smart "garbage collector" that instantly deletes boxes once they are fully mitigated by price, keeping your chart perfectly clean.
Institutional Trend Filters: Integrates key dynamic support/resistance levels, including the 14 EMA, 80 HMA, 200 EMA, and the daily VWAP, allowing you to gauge the macro and micro trends at a glance.
Volume-Backed Sweep Signals: The indicator doesn't just look for wicks; it analyzes the relationship between wick size, body size, and relative volume. It plots clear "LONG" and "SHORT" triangles only when a rejection wick touches a key dynamic level (EMA/VWAP) and is backed by above-average volume.
Ultimate Sensitivity Engine: Fully customizable settings. You can adjust the required wick size, maximum opposite wick size, and volume multiplier to adapt the trigger sensitivity to the current market volatility.
How to Trade with Gems Sniper Trader Pro
This indicator is built to trade pullbacks into liquidity zones in the direction of the macro trend.
For a LONG Setup:
Ensure the price is trading above the 200 EMA (Macro Trend).
Wait for the price to pull back and enter an Aqua Demand Box.
Look for a green LONG triangle signal. This confirms a liquidity sweep bouncing off the 14 EMA, 80 HMA, or VWAP with institutional volume.
Place your Stop Loss safely below the sweep wick.
For a SHORT Setup:
Ensure the price is trading below the 200 EMA.
Wait for a fake breakout into a Red Supply Box.
Look for a red SHORT triangle rejecting the zone with volume.
Place your Stop Loss above the rejection wick.
Pro Tip :
Avoid taking signals that float in the middle of nowhere. The highest probability trades occur when the sweep signal perfectly aligns (confluence) with a Liquidity Box and a dynamic level like the VWAP. אינדיקטור

אסטרטגייה

Camarilla Pivot Points with Actual Price Data for Heikin AshiNick Stott developed the Camarilla system in 1989 while trading bonds. The name comes from the Latin word for a small, private room — the implication being that these are hidden levels the market naturally gravitates toward. The core insight is that markets are mean-reverting by nature on an intraday basis — price tends to oscillate around a central value during the day (such as VWAP or some other level) rather than trend continuously. The Camarilla levels are designed to identify the precise price points where that mean reversion is most likely to occur, and where it's most likely to fail and become a genuine breakout instead.
The formula takes yesterday's high, low, and close and generates four resistance levels above (H1–H4) and four support levels below (L1–L4). The multipliers (0.0916, 0.183, 0.275, 0.55) are derived from Fibonacci ratios, which is what distinguishes Camarilla from classic pivot points that use simpler arithmetic.
H3 and L3 — the counter-trend levels. These are the workhorses of the system for day traders. The theory is that on a typical day, price will trade up to H3 or down to L3 and then reverse. You trade against the move at these levels — short at H3, long at L3 — with your stop placed just beyond H4 or L4 respectively. These setups have a high win rate in ranging, non-trending conditions because the market is simply oscillating within its expected daily range.
H4 and L4 — the breakout levels. When price breaks convincingly through H4 or L4, the mean-reversion thesis is invalidated. The market is telling you something unusual is happening — there's genuine directional momentum. At that point you flip your approach entirely and trade with the move, going long above H4 or short below L4, targeting H5 (which is H4 + the H4–H3 range) or L5 respectively. These are the high-reward trades but they occur less frequently.
H1, H2, L1, L2 — the minor levels. These are weaker and less reliable individually. Experienced Camarilla traders often use them as partial profit targets or as zones to tighten stops rather than as primary entry signals.
I prefer using Heikin Ashi candles on my chart -- however they are mathematically derived averages of price, calculated using a specific formula. Heikin Ashi candles do not show real price data. But on a regular candlestick chart it gets the actual market high, low, and close. On a Heikin Ashi chart you get the smoothed, averaged versions of those values -- which are always closer to the midpoint of the day's range and never reflect the true extremes. So I had to add in a tweak to use actual OHLC price data. אינדיקטור

אינדיקטור

Volume Trap Reversal Planner [AGPro Series]Volume Trap Reversal Planner
🧠 Core Idea
Did a volume spike trap one side of the market and reverse with enough confirmation to deserve attention?
📌 Overview / What it does
Volume Trap Reversal Planner is a chart-first reversal planning tool built around high-volume trap behavior.
Instead of treating every volume spike or wick sweep as a reversal signal, the script checks whether price expands through a recent reference, prints unusual relative volume, fails to hold the move, recovers back through the reference, and then confirms with a follow-through candle.
The output includes volume trap pockets, reclaim rails, risk edges, target-room bands, compact event labels, alerts, and a clean AGPro decision panel. It does not predict price, automate trades, or claim that every trap will reverse.
🎯 Purpose & Design Philosophy
The script was built for traders who want to separate meaningful high-volume trap events from ordinary noisy spikes.
Many reversal tools focus only on a wick, a candle pattern, or a support/resistance touch. This planner focuses on the decision layer after a volume trap forms: whether the trap is confirmed, where the risk edge sits, where target-room review begins, and what the next action state should be.
The design supports a structured review mindset: identify the trap, wait for confirmation, monitor the risk edge, and read the context through a 0-100 score instead of reacting to a single candle.
⚡ Why This Script Is Different
Most tools focus on volume spikes as standalone events or classify every sweep as a reversal attempt.
This script does NOT operate as a generic stop-run scanner, a broad liquidity sweep map, or a simple volume climax labeler.
Instead, it combines relative volume, wick sweep behavior, close recovery, confirmation candle quality, follow-through, risk edge placement, and target-room context into one planner-style reversal model.
⚙️ Methodology
1. Context Detection
The script builds a rolling high/low reference range and watches for unusual volume expansion near those references.
2. Trap Mapping
When price sweeps beyond the reference with elevated volume and recovers back inside, the script maps the volume trap pocket.
3. Reversal Evaluation
The planner evaluates wick quality, recovery strength, confirmation candle structure, follow-through distance, and the active risk edge.
4. Visual Output
The result is translated into a 0-100 reversal score, a next-action state, on-chart labels, risk/target guides, and a compact AGPro panel.
🗺️ How to Read the Chart
Zones = volume trap pockets created by a high-volume sweep and recovery.
Labels = trap watch, reversal ready, trap failed, or target review states.
Colors = bull-side reversals use teal, bear-side reversals use pink, watch states use amber, and review/target context uses indigo.
Panel = current trap side, volume spike multiple, reversal score, risk edge, and next action.
🚦 Signals & States
• VOL TRAP WATCH → a high-volume trap candidate formed and needs confirmation.
• REVERSAL READY → the trap received confirmation and reached the required score.
• TRAP FAILED → price closed beyond the risk edge and the active trap context weakened.
• TARGET REVIEW → price reached the target-room review band for the active plan.
🔔 Alerts Logic
Alerts trigger when a volume trap watch appears, when reversal confirmation reaches the required score, when the active trap fails through the risk edge, or when price reaches the target-room review band.
Alerts are attention markers only. They are not trade instructions.
🧩 Confluence Logic
The context becomes stronger when volume spike quality, wick sweep behavior, close recovery, confirmation candle structure, and follow-through align in the same direction.
The score is intentionally multi-factor so a single dramatic candle does not dominate the interpretation.
📊 When to Use
• 4H charts for the cleanest public visual balance
• Markets with reliable volume data
• High-volume reactions around recent highs or lows
• Reversal review after failed breakout or failed breakdown attempts
• Active intraday or swing charts where trap behavior is visible
⚠️ When NOT to Use
• Very low-liquidity symbols
• Markets with unreliable or missing volume data
• Extremely noisy ranges where every candle sweeps both sides
• News-driven volatility where candle structure can distort normal context
🎛️ Key Inputs
• Trap Reference Lookback → controls the rolling high/low range used for trap detection.
• Volume Spike RVOL → adjusts how much relative volume is required.
• Sensitivity → changes sweep, wick, and volume selectivity.
• Confirmation Mode → controls how strict the confirmation candle must be.
• Risk / Target Logic → controls risk edge buffers and target-room bands.
• Visual Settings → control zones, rails, labels, panel location, theme, and font sizes.
🖥️ Interface & Visual Design
The interface is built around a clean AGPro panel and chart-first visual hierarchy.
Trap pockets show where the volume trap occurred. Labels identify the current state without overcrowding the chart. Risk and target guides make the output easier to interpret as a planning tool rather than a raw signal board.
🧪 Practical Usage Workflow
1. Read the panel and check the active trap side.
2. Inspect the volume trap pocket and reclaim rail.
3. Wait for reversal confirmation instead of reacting to the spike alone.
4. Compare the current state with the risk edge and target-room band.
5. Interpret the score within broader market context.
🔍 Interpretation Guidelines
A high score means the trap structure, volume spike, recovery, and confirmation are aligned more cleanly.
A watch state means the event is still developing.
A failed state means the active trap context has weakened or invalidated according to the script's rules.
Use the output as structured context, not as a standalone decision.
🚫 What This Script Is NOT
• Not a prediction engine
• Not financial advice
• Not an auto-trading system
• Not a guaranteed reversal signal
• Not a generic liquidity sweep scanner
⚠️ Limitations & Transparency
Volume quality varies by symbol, exchange, and asset class.
Different timeframes may produce different trap pockets and confirmation states.
High volatility can make traps appear and fail quickly.
The script is rule-based and cannot know news, order flow intent, execution quality, or broader discretionary context.
🧠 Market Context Notes
Volume traps often matter most when they occur at obvious participation points, such as recent highs, recent lows, failed breakouts, or failed breakdowns.
The strongest use case is not the spike itself. The strongest use case is the sequence after the spike: recovery, confirmation, risk edge, and follow-through.
🧾 Use Case Examples
When price sweeps below a recent low on elevated volume, closes back above the reference, and confirms upward within the allowed window, the planner can mark a bullish reversal context.
When price sweeps above a recent high on elevated volume, fails to hold, and confirms downward, the planner can mark a bearish reversal context.
🧱 System Philosophy
Volume Trap Reversal Planner belongs to the AGPro planner-style workflow: detect the event, score the evidence, define the risk edge, map the review zone, and guide the next chart-reading step.
🔐 Non-Promise Statement
No trap, score, label, or alert can guarantee a reversal.
No script can provide certainty.
📉 Risk Disclosure
Trading involves risk.
Users are responsible for their own decisions, risk management, and market interpretation.
This script is for educational and analytical purposes only and does not provide financial advice.
📚 Educational Note
Use the script to study how high-volume failed moves behave after sweeping recent references. The most useful insights come from comparing confirmed traps, failed traps, and ignored spikes across different markets and timeframes.
אינדיקטור

Ask Dr. Alex AIAsk Dr. Alex AI — Interactive Chart Intelligence for TradingView
Ask Dr. Alex AI is an interactive chart intelligence indicator built to help traders understand what the chart is saying before making a decision. Instead of only printing a simple buy or sell label, Ask Dr. Alex AI lets the user select a question from a built-in menu and then reveals the specific chart evidence behind the answer.
This indicator is designed as a guided market assistant for traders who want clearer context around support, resistance, patterns, momentum, trend pressure, forecast bias, and trade planning.
What Makes Ask Dr. Alex AI Different
Most indicators only show signals.
Ask Dr. Alex AI answers questions.
Users can select from guided questions such as:
Is this safe to trade right now?
Am I buying from support, selling from resistance, or chasing price?
What pattern is active?
What does the next candle / 10C forecast suggest?
What is the entry, stop loss, and take-profit plan?
ALL — Show Everything
Deep Scan Mode
When a question is selected, the indicator highlights the relevant chart areas and summarizes what it sees using the Dr. Alex AI answer panel.
Core Features
Interactive Question Menu
Choose a question and the indicator reveals only the relevant chart evidence.
Dr. Alex AI Answer Panel
Provides a plain-English summary of the current market condition.
Deep Scan Mode
Unlocks deeper diagnostic checks such as:
Trend Strength
MTF Agreement
Support Bounce Check
Resistance Rejection
Pattern Quality
Forecast Conflict
Ribbon Conflict
Entry Quality
Risk / Reward
Invalidation Point
Fakeout Risk
Wilson Tangent
Full Diagnostic
Support / Resistance Intelligence
Displays major support and resistance zones, higher-timeframe levels, and whether price is reacting from a meaningful area.
Pattern Awareness
Detects and explains major active patterns such as doji at support, hammer at support, double bottom, engulfing candles, marubozu candles, breakout retests, traps, and continuation patterns.
Respect Support Bounce Mode
When price touches major support and a bullish rejection pattern appears, the system can shift from hard bearish continuation into Support Bounce Watch / Bull Watch instead of blindly forecasting into support.
Next-Candle Bias Ribbon
A five-state visual ribbon helps summarize the projected next-candle condition:
Green = Bullish
Blue = Bull Watch
Gray = Neutral
Orange = Bear Watch
Red = Bearish
10-Candle Forecast View
Shows a forward projection path based on confidence, pattern context, support/resistance, trend pressure, and active sentiment.
Trade Plan Panel
When a setup is active, the indicator can display:
Entry range
Stop loss
TP1
TP2
Risk/reward model
Setup status
Confidence and Rank Engine
Uses a multi-factor scoring system to compare bullish and bearish pressure across trend, momentum, structure, volatility, MTF alignment, candle behavior, and ribbon state.
Machine-Learning-Inspired Scoring Logic
Ask Dr. Alex AI uses adaptive, weighted, machine-learning-inspired decision logic to evaluate chart conditions and adjust the way it interprets support bounces, forecast conflicts, momentum shifts, and pattern quality. It is designed to behave like an intelligent diagnostic layer, not just a static signal generator.
How to Use
Add the indicator to your chart.
Choose a question from the Ask Dr. Alex AI menu.
Review the highlighted chart evidence.
Read the Dr. Alex AI answer panel.
Use Deep Scan Mode when you want a more detailed diagnostic breakdown.
Use ALL — Show Everything when you want the full visual system displayed at once.
Best Use Case
Ask Dr. Alex AI is best used as a decision-support and educational chart assistant. It is built to help traders slow down, identify context, avoid chasing price, respect support/resistance, and understand why a setup is active, weak, conflicted, or invalidated.
It is especially useful for traders who want the chart to answer questions such as:
“Is this actually a trade, or am I forcing it?”
“Is price bouncing from support or breaking down?”
“Why is the forecast bullish if the trend is bearish?”
“Why is the signal waiting?”
“What must happen before this setup becomes valid?”
Important Disclaimer
Ask Dr. Alex AI is for educational and informational purposes only. It does not guarantee profits, predict the future with certainty, or replace personal judgment, risk management, or professional financial advice. Trading involves risk, and users are responsible for their own trading decisions.
אינדיקטור

Range Rejection Planner [AGPro Series]Range Rejection Planner
🧠 Core Idea
Is price rejecting a range edge with enough quality to monitor back toward the midline?
📌 Overview / What it does
Range Rejection Planner is a chart-first range reaction decision engine built to evaluate whether price is rejecting the active range edge with enough structure to deserve attention.
The script maps one relevant range edge, a focused edge-reaction zone, wick rejection behavior, close-back-inside quality, midline room, invalidation shelf, failure risk, event labels, alerts, and a clean AGPro planning panel. These components are converted into a 0-100 Rejection Score and a clear next-action state.
It does not predict price movement, automate trades, draw a full support/resistance library, or guarantee that a range edge will hold. Its purpose is to organize the range-edge rejection review process with practical risk and midline context.
🎯 Purpose & Design Philosophy
This script was built for traders who want to evaluate range-edge reactions without turning the chart into a crowded level map.
Many range tools show boundaries, fills, or breakout markers, but they often stop before answering the practical planning question: did price actually reject the edge, is there room back to the midline, and where does the idea fail?
The design philosophy is simple: a range-edge rejection is only useful when the edge interaction, wick response, close-back-inside behavior, midline room, and failure shelf can be read together.
⚡ Why This Script Is Different
Most tools focus on drawing support/resistance zones, marking every range touch, or highlighting breakouts.
This script does NOT clone Support Resistance Reaction Map, does not build a multi-level S/R inventory, and does not act as a broad breakout or break-retest scanner.
Instead, it focuses on one active range and one active edge. The main output is not a buy/sell signal. It is a planning state that helps users decide whether the edge rejection deserves review, whether midline room exists, and whether failure risk is rising.
⚙️ Methodology
1. Context Detection
The script builds an active range from previous bars and identifies whether price is interacting with the upper or lower edge.
2. Reference Mapping
It maps the relevant edge zone, the range midline, and an invalidation shelf beyond the rejected edge.
3. Reaction Evaluation
The model scores edge proximity, wick rejection, close-back-inside quality, relative volume response, midline room, and active range quality.
4. Visual Output
The result appears as a centered range-edge zone, a midline review path, guide lines, compact state labels, alerts, and a premium AGPro panel.
🗺️ How to Read the Chart
Zones = the active range-edge zone shows the relevant upper or lower boundary being evaluated. The zone label is centered inside the shape.
Midline Path = the projected review area between the rejected edge and the range midline. It helps show whether there is enough room for interpretation.
Labels = compact markers show EDGE WATCH, REJECT READY, MIDLINE REVIEW, MIDLINE HIT, or FAILURE RISK context.
Colors = teal supports lower-edge rejection context, pink supports upper-edge rejection context, amber highlights review states, and indigo marks midline references.
Panel = the panel summarizes Range Edge, Rejection Score, Midline Room, Failure Risk, and Action.
🚦 Signals & States
• EDGE WATCH → price is probing a range edge and early rejection conditions are developing.
• REJECT READY → range-edge rejection quality reached the selected score threshold.
• MIDLINE REVIEW → an active rejection context is being monitored toward the range midline.
• MIDLINE HIT → price reached the active range midline after a rejection context.
• FAILURE RISK → price crossed the invalidation shelf beyond the rejected edge.
• RANGE WAIT → a range exists, but the edge interaction is not strong enough yet.
🔔 Alerts Logic
Alerts trigger when the planner enters EDGE WATCH, REJECT READY, MIDLINE REVIEW, MIDLINE HIT, or FAILURE RISK.
Each alert is an attention marker. Alerts are not trade instructions, entry commands, exit commands, or automated strategy rules.
🧩 Confluence Logic
The strongest context appears when several conditions align:
Range edge probe + strong rejection wick + close back inside the range + supportive relative volume + meaningful room back to the midline + a clear invalidation shelf.
When these components weaken, the planner can stay in EDGE WATCH, return to RANGE WAIT, or shift into FAILURE RISK.
📊 When to Use
• During range-bound markets where edge reactions matter
• When price probes the upper or lower boundary of a recent range
• When evaluating whether an edge rejection has enough midline room
• When a trader wants risk and invalidation context around a range reaction
• On liquid symbols where wicks, volume, and range boundaries are readable
⚠️ When NOT to Use
• Extremely low-liquidity symbols with unreliable wicks or volume
• Very noisy micro-timeframes where range edges shift too often
• News-driven volatility spikes that distort normal range behavior
• Strong trend expansion where range rejection is no longer the main context
• Situations where the user expects automatic buy/sell signals
🎛️ Key Inputs
• Range Edge Mode → chooses Auto, Upper Edge Rejection, or Lower Edge Rejection.
• Active Range Lookback → controls the previous-bar range used for edge evaluation.
• Range Edge Zone ATR → controls the width of the focused edge-reaction zone.
• Close-Back-Inside ATR → defines how much price should close back inside after probing an edge.
• Invalidation Shelf ATR → controls the failure-risk reference beyond the rejected edge.
• REJECT READY Threshold → sets the minimum 0-100 score for the strongest rejection state.
• Label and Panel Font Size → controls visual readability.
🖥️ Interface & Visual Design
The interface is designed to stay chart-first.
The active edge zone gives the main visual reference. The midline path shows the review area. The invalidation shelf defines where the rejection context becomes weaker. The panel provides a compact decision summary without replacing the chart.
The AGPro panel follows the standard first row format: one merged blue title row containing only the script name.
🧪 Practical Usage Workflow
1. Read the panel state and Rejection Score.
2. Check which range edge is active.
3. Review the wick rejection and close-back-inside context.
4. Compare the midline room with the invalidation shelf.
5. Treat alerts as attention markers, then evaluate broader market context.
🔍 Interpretation Guidelines
Think in terms of rejection quality, not prediction.
A stronger score means multiple range-reaction conditions are aligned. A weaker score means the edge interaction may be early, noisy, too close to the midline, or vulnerable to failure.
Failure Risk does not forecast a breakout. It means the active rejection context has crossed its rule-based failure shelf and should be reviewed.
🚫 What This Script Is NOT
• Not a prediction engine
• Not financial advice
• Not an auto-trading system
• Not a guaranteed signal tool
• Not a generic support/resistance map
• Not a full range breakout scanner
⚠️ Limitations & Transparency
The script is rule-based and depends on recent price, range, wick, volatility, and volume behavior.
Timeframe changes can alter the active range, score, edge zone, midline room, and invalidation shelf. Volatility spikes can temporarily distort range boundaries. Symbols with unreliable volume may produce weaker participation readings.
Outputs should always be interpreted with broader market structure, liquidity conditions, and independent risk planning.
🧠 Market Context Notes
Range-edge rejection is most useful when the market is respecting a bounded structure and still has meaningful space toward the middle of the range.
If price starts expanding beyond the edge, this tool intentionally shifts attention from rejection quality toward failure risk instead of calling continuation or reversal with certainty.
🧾 Use Case Examples
When price probes above the active range high, prints a strong upper wick, closes back inside, and still has clear room toward the midline, the planner may classify the context as REJECT READY.
When price touches the lower edge but closes weakly, lacks wick response, or sits too close to the midline, the planner may remain in EDGE WATCH or RANGE WAIT.
When price crosses the invalidation shelf beyond the rejected edge, the planner marks FAILURE RISK for review.
🧱 System Philosophy
AGPro planning tools are designed to help traders make a decision, not simply see another signal.
This script follows that philosophy by turning range rejection into a practical decision question:
Is the edge interaction valid?
How strong is the rejection?
Where is the midline reference?
Where is the failure shelf?
What should I review now?
🔐 Non-Promise Statement
No script can remove uncertainty.
No state, score, label, zone, line, or alert guarantees a future market outcome.
📉 Risk Disclosure
Trading involves risk. Market conditions can change quickly, and no script can eliminate uncertainty.
Users are responsible for their own analysis, risk management, and decisions.
This script is for educational and analytical use only and does not provide financial advice.
📚 Educational Note
Use the planner to study how range edges behave across different markets and timeframes. The most useful reading comes from comparing the edge zone, wick response, midline room, failure shelf, panel state, and broader market context together.
אינדיקטור

Stop Run Reversal Planner [AGPro Series]Stop Run Reversal Planner
🧠 Core Idea
Did a stop run create a confirmed reversal context with clear risk, target room, and next-action guidance?
📌 Overview / What it does
Stop Run Reversal Planner is a chart-first stop-run reversal planning tool built to evaluate wick sweeps around recent range extremes.
The script detects when price runs beyond a prior high or low, checks whether price closes back through the swept reference, evaluates confirmation candle quality, scores volume response, measures target room, and converts the context into a 0-100 reversal readiness score.
It produces stop-run wick zones, confirmation labels, reclaim rails, invalidation guides, reversal target bands, alerts, and a clean AGPro planning panel. It does not predict price direction, automate execution, or claim that every stop run must reverse.
🎯 Purpose & Design Philosophy
This script was built for traders who want structure after a fast liquidity run instead of another simple sweep marker.
Stop-run candles can look dramatic, but not every sweep deserves the same attention. Some sweeps reclaim cleanly, confirm with stronger candle behavior, and leave usable target room. Others are only noise, continuation, or incomplete rejection.
The design supports a planning workflow: identify the stop run, wait for confirmation, read the readiness score, check invalidation, review target room, and decide whether the context deserves attention.
⚡ Why This Script Is Different
Most stop-hunt tools focus on mapping sweep zones or marking that liquidity was taken.
This script does NOT try to clone a stop-hunt map, liquidity grab detector, liquidity sweep engine, order block map, or broad SMC dashboard.
Instead, it focuses on the post-stop-run reversal decision. The key question is not only "was a stop run printed?" The key question is "did that stop run turn into a confirmed reversal plan with acceptable reclaim quality, invalidation logic, and target room?"
⚙️ Methodology
1. Context Detection
The script tracks recent range highs and lows, then checks whether price runs beyond one side with a meaningful wick sweep.
2. Reference Mapping
The swept reference becomes the reclaim rail. The sweep extreme becomes the invalidation guide. The opposite side of the reference range, or an ATR fallback, becomes the target-room guide.
3. Reaction Evaluation
The scoring model evaluates wick sweep quality, close-back-inside behavior, confirmation candle quality, relative volume response, trend-turn context, and available target room.
4. Visual Output
Qualified contexts are displayed through stop-run wick zones, confirmation labels, reclaim rails, invalidation lines, target bands, alerts, and a compact AGPro panel.
🗺️ How to Read the Chart
Zones = the stop-run wick zone between the swept reference and the sweep extreme.
Labels = stop-run watch, confirmed reversal, invalidation, and target-band review markers.
Colors = teal highlights bullish reversal contexts, pink highlights bearish reversal contexts, amber marks watch states, and indigo marks target-room areas.
Panel = the panel summarizes Stop Run, Confirmation, Reclaim Quality, Invalidation, and Action.
🚦 Signals & States
• Bull Stop Run Watch → price swept below the recent low and may need confirmation.
• Bear Stop Run Watch → price swept above the recent high and may need confirmation.
• Bull Reversal Confirmed → downside stop run reclaimed with enough confirmation quality and target room.
• Bear Reversal Confirmed → upside stop run rejected with enough confirmation quality and target room.
• Reversal Invalidated → price crossed the active invalidation guide.
• Target Band Review → price reached the active reversal target band.
🔔 Alerts Logic
Alerts trigger when a bull or bear stop-run watch appears, when a bull or bear reversal confirmation becomes active, when invalidation is crossed, or when the target band is reached.
Alerts are attention markers. They are not trade instructions, entry signals, exit signals, or automation commands.
🧩 Confluence Logic
The reversal context becomes stronger when multiple factors align:
Stop-run wick + close back inside + strong confirmation candle + supportive volume response + usable target room + cleaner trend-turn behavior.
When only one or two factors appear, the script keeps the context in watch mode or ignores it completely.
📊 When to Use
• After fast wick sweeps beyond recent highs or lows
• Around failed breakout or failed breakdown attempts
• In range-edge reversal review workflows
• When price reclaims a swept level and needs structured confirmation
• When a trader wants risk, target, and action context instead of only a sweep marker
⚠️ When NOT to Use
• Very low-liquidity symbols
• Extremely noisy micro-timeframes
• News candles with abnormal gaps
• Strong one-way trend conditions where stop runs may continue rather than reverse
• Situations where the user wants an automatic buy or sell signal
🎛️ Key Inputs
• Stop-Run Reference Lookback → controls the recent high / low range used for sweep detection.
• Sensitivity → changes how selective wick-sweep detection should be.
• Confirmation Mode → controls how strict the post-sweep confirmation candle must be.
• Minimum Reversal Score → sets the 0-100 score required before a confirmed plan is drawn.
• Confirmation Window Bars → defines how long a stop run can wait for confirmation.
• Target Room ATR Fallback → creates a practical target guide when the opposite range side is not useful.
• Invalidation Buffer ATR → places the invalidation guide beyond the sweep extreme.
• Visual settings → control zones, rails, target bands, labels, panel location, panel theme, and font sizes.
🖥️ Interface & Visual Design
The interface is built to stay chart-first.
The panel gives the decision summary. The stop-run zone shows where the sweep happened. The reclaim rail shows the level price had to recover. The invalidation line marks the level that would weaken the reversal context. The target band gives a structured review area without making a promise.
The layout is intentionally compact, readable, and publication-friendly.
🧪 Practical Usage Workflow
1. Read the panel to identify the current Stop Run and Confirmation state.
2. Check whether the chart shows a stop-run wick zone and reclaim rail.
3. Review the Reclaim Quality score and confirmation label.
4. Compare the current price with invalidation and target-band guides.
5. Interpret the context with broader market structure, liquidity, and volatility conditions.
🔍 Interpretation Guidelines
A stop-run watch means price has swept a recent edge, but the reversal plan is not yet confirmed.
A confirmed reversal state means the script found stronger reclaim, candle, volume, and target-room conditions.
An invalidation marker means the active context weakened according to the script rules.
A target-band review marker means price reached a planned review area, not that the move must stop there.
🚫 What This Script Is NOT
• Not a prediction engine
• Not financial advice
• Not an auto trading system
• Not a guaranteed signal tool
• Not a stop-hunt zone map
• Not a liquidity grab detector
• Not an order block or FVG map
• Not a generic SMC dashboard
⚠️ Limitations & Transparency
Stop-run behavior changes across symbols, sessions, and timeframes.
Some stop runs continue instead of reversing. Some reclaim attempts fail after confirmation. Some symbols have weak or unreliable volume data, which can affect the score model.
The script provides structured context, not certainty.
🧠 Market Context Notes
Stop-run reversal behavior often appears near visible range edges, prior swing highs, prior swing lows, and failed breakout areas.
The strongest contexts usually combine a meaningful sweep, clean reclaim, strong confirmation candle, usable room, and a clear invalidation guide.
🧾 Use Case Examples
When price runs below a recent low, leaves a strong lower wick, closes back above the swept reference, and confirms with stronger follow-through, the script may classify the context as a bullish stop-run reversal plan.
When price runs above a recent high, rejects the move, closes back below the swept reference, and confirms with stronger downside behavior, the script may classify the context as a bearish stop-run reversal plan.
🧱 System Philosophy
Stop Run Reversal Planner follows the AGPro decision-engine approach: the goal is not to add another signal to the chart, but to organize the decision around validity, score, risk, target room, and next action.
🔐 Non-Promise Statement
No script can guarantee a reversal, outcome, or market reaction.
This script provides rule-based analytical context only.
📉 Risk Disclosure
Trading involves risk.
Users remain responsible for their own decisions, execution, risk management, and interpretation.
This script does not provide financial advice.
📚 Educational Note
Use the output as a structured review layer. The best readings usually come from combining the planner state with broader market structure, timeframe context, liquidity conditions, and personal risk rules.
אינדיקטור

Candle Rejection Quality Planner [AGPro Series]Candle Rejection Quality Planner
🧠 Core Idea
Is the rejection candle strong enough to create a valid planning context, or is it only a noisy wick?
📌 Overview / What it does
Candle Rejection Quality Planner is a chart-first rejection candle decision tool designed to evaluate wick-led rejection without turning the chart into a generic candlestick signal map.
The script identifies bullish and bearish rejection candles, scores their quality from 0 to 100, then tracks what happens next through a confirmation rail, failure edge, target-room guide, wick quality zone, compact labels, alerts, and a clean AG Pro planning panel.
It does not predict future price movement, automate entries, print buy/sell commands, or replace broader market context. Its purpose is to help traders judge whether a rejection candle has enough structure to deserve attention.
🎯 Purpose & Design Philosophy
This script was built to fill the gap between simple wick markers and broader reversal systems.
Many traders can see a long wick. The harder question is whether that wick has enough close quality, candle range, participation, and follow-through potential to become useful context.
The design supports a planner mindset: evaluate the candle, define the confirmation level, know where the idea weakens, and wait for the next state instead of reacting to every wick.
⚡ Why This Script Is Different
Most tools focus on detecting a named candle pattern such as a pin bar, engulfing candle, or generic rejection marker.
This script does NOT clone Pin Bar Quality Filter, Engulfing Candle Quality, Rejection Block Quality, order block logic, liquidity sweep logic, or a broad candlestick scanner.
Instead, it focuses on the planning process after a rejection candle appears: quality score, confirmation rail, failure edge, target-room guide, and next-action state. The candle is not treated as an entry by itself. It is treated as a context that must prove itself.
⚙️ Methodology
1. Context Detection
The script measures candle range, upper wick, lower wick, close location, and relative volume to detect wick-led rejection context.
2. Reference Mapping
When a qualified rejection candle appears, the planner maps a wick quality zone, confirmation rail, failure edge, and target-room guide.
3. Reaction Evaluation
The model updates the 0-100 Rejection Quality score as confirmation develops, pressure works against the candle, time passes, or price reaches the planning guide.
4. Visual Output
The chart displays the wick zone, rail, guide lines, controlled labels, candle tint, alerts, and AG Pro panel.
🗺️ How to Read the Chart
Zones = the rejected wick area of the qualifying candle. The zone is a candle-quality reference, not a support/resistance map.
Labels = rejection context, confirmation, failure edge breaks, target-room completion, and sparse active-state markers.
Colors = teal supports bullish rejection context, pink marks bearish rejection or failure pressure, yellow marks caution, and indigo marks confirmation review.
Panel = a compact decision view showing Candle Side, Rejection Quality, Confirmation, Failure Risk, and Action.
🚦 Signals & States
• Bullish Rejection → lower wick rejection with stronger close location and sufficient quality.
• Bearish Rejection → upper wick rejection with weaker close location and sufficient quality.
• Awaiting Confirmation → a qualified rejection exists, but price has not accepted beyond the rail.
• Confirmed → price accepted beyond the confirmation rail.
• Failure Edge Broken → the rejection context lost its defined failure edge.
• Target Room Reached → price reached the planning guide mapped from the rejection context.
🔔 Alerts Logic
Alerts can trigger when a qualified rejection candle opens a new context, when confirmation rail acceptance appears, when the failure edge breaks, when target room is reached, or when the active planner state changes.
Alerts are attention markers. They are not trade instructions and do not imply a guaranteed outcome.
🧩 Confluence Logic
The strongest planner states appear when wick dominance, close location, reasonable candle range, supportive volume, and confirmation beyond the rail align together.
When those elements are weaker or delayed, the planner shifts toward monitor, weak confirmation, expired context, or invalidated state.
📊 When to Use
• Price-action review around visible reaction candles
• Liquid symbols where candle range and volume are readable
• Intraday or swing charts where wick rejection can be evaluated with ATR context
• Discretionary planning workflows that need confirmation and failure references
⚠️ When NOT to Use
• Extremely low-liquidity symbols with unreliable candles
• Very noisy low-timeframe charts where wicks appear randomly
• News spikes where candle range is distorted
• Situations where broader market structure is being ignored
🎛️ Key Inputs
• Sensitivity → changes how selective the rejection engine is.
• Minimum Rejection Quality → sets the 0-100 score required before a context appears.
• Dominant Wick Share → controls how much wick dominance is required.
• Close Location Quality → controls how strongly price must close away from the rejected wick.
• Confirmation Window → controls how long the script waits for follow-through.
• Failure Edge Buffer → defines the invalidation reference beyond the rejection wick.
• Target-Room Guide R → draws the planning guide from rejection close to failure edge distance.
• Visual settings → control zones, rails, labels, candle tint, panel location, panel theme, and font sizes.
🖥️ Interface & Visual Design
The interface is intentionally compact and chart-first.
The wick quality zone keeps attention on the candle that created the context. The confirmation rail and failure edge create a structured review path. The AG Pro panel summarizes the current state without covering the chart with a broad dashboard.
🧪 Practical Usage Workflow
1. Read the panel and identify the active candle side.
2. Check the wick quality zone and confirmation rail.
3. Watch whether price confirms, weakens, expires, or breaks the failure edge.
4. Use the target-room guide as a planning reference, not as a promise.
🔍 Interpretation Guidelines
A stronger score means the rejection candle has cleaner wick dominance, better close location, a more useful candle range, and stronger participation support.
A confirmed state means price has accepted beyond the rail according to the script rules.
A failed state means the active rejection context lost its defined failure edge.
🚫 What This Script Is NOT
• Not a prediction engine
• Not financial advice
• Not auto trading
• Not guaranteed signals
• Not a pin bar clone
• Not an engulfing candle detector
• Not a generic support/resistance or order block map
⚠️ Limitations & Transparency
The script is rule-based and depends on candle structure, ATR, relative volume, and follow-through behavior.
Different timeframes can change how rejection appears. Volatility spikes can distort candle range and failure distance. Symbols with unreliable volume may produce weaker participation readings.
Outputs should always be interpreted within broader market structure, liquidity, volatility, and personal risk rules.
🧠 Market Context Notes
Rejection candles often matter more when they appear near meaningful structure, after a directional push, or during a volatility expansion attempt. The script intentionally does not build a full structure map because its narrow job is candle rejection planning.
🧾 Use Case Examples
When a candle prints a strong lower wick, closes high in its range, and then accepts above the confirmation rail, the planner may classify the context as ready for review.
When a strong upper wick appears but price fails to move beyond the confirmation rail and later breaks the failure edge, the planner marks the context as invalidated.
🧱 System Philosophy
AGPro Series tools are designed to convert visual market behavior into structured review states. This script follows that philosophy by turning a single rejection candle into a defined planning context with quality, confirmation, risk, and action fields.
🔐 Non-Promise Statement
No script can provide certainty.
No rejection candle guarantees continuation, reversal, or profitable execution.
📉 Risk Disclosure
Trading involves risk. This script is for technical analysis and educational use only.
Users remain responsible for their own analysis, position sizing, execution decisions, and risk management.
This script does not provide financial advice or guaranteed trading outcomes.
📚 Educational Note
Use the tool to study how rejection candles behave after they appear. The value is in structured observation, not automatic decision-making.
אינדיקטור