ZenAlgo - DojiOverview
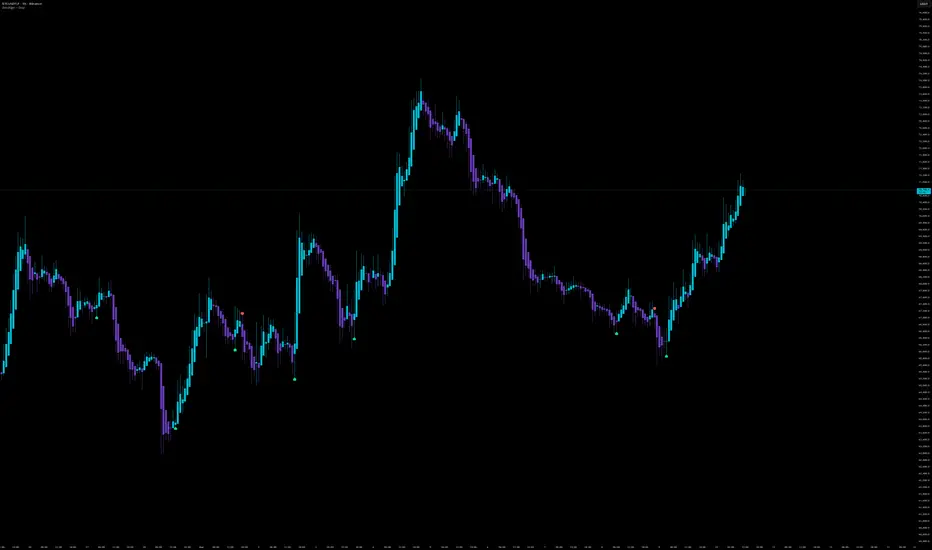
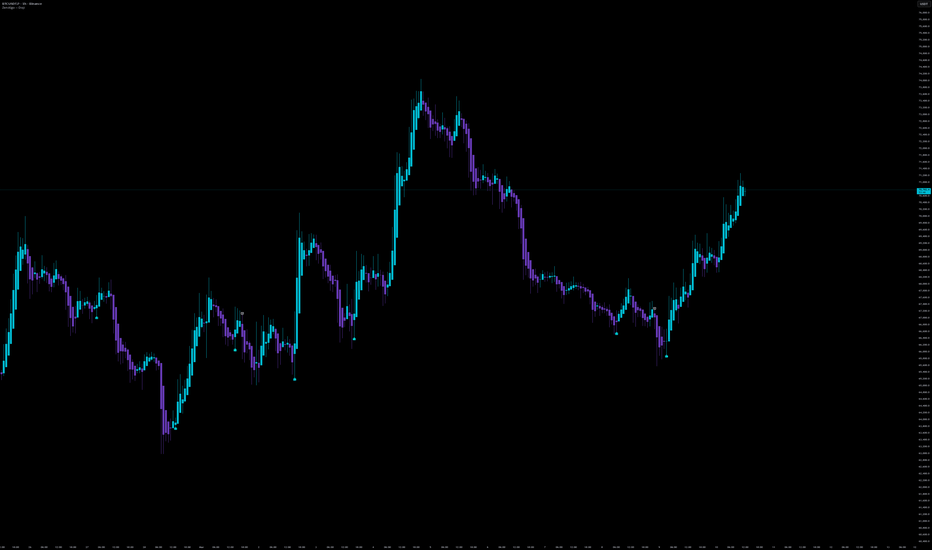
This indicator identifies Doji candles and adds two contextual filters before creating an alert: a relative volume expansion filter and a normalized directional-shift filter. Most Doji indicators simply detect candle shape. This script instead adds contextual conditions so that alerts appear only when the Doji occurs together with increased participation and a change in short-term directional pressure.
Doji candles appear frequently on their own, so the script focuses on situations where candle balance, elevated activity, and a directional shift occur at the same time.
How the indicator works
The script begins by evaluating candle structure. It measures the full candle range, the size of the body, and the size of the upper and lower wicks relative to the entire candle. A candle is considered a Doji when the body occupies only a small portion of the range.
After identifying the base Doji structure, the candle is classified into one of several common Doji types depending on the relative size of the wicks:
Dragonfly Doji – very small upper wick and long lower wick.
Gravestone Doji – very small lower wick and long upper wick.
Long-legged Doji – both wicks are relatively long.
Standard Doji – small body without the extreme wick proportions of the other types.
A Doji indicates that price moved during the bar but finished close to the opening level, suggesting temporary balance between buyers and sellers.
Volume context (PVSRA-style comparison)
After the candle structure is detected, the script evaluates trading activity.
Current volume is compared with the average volume over a recent lookback window. If current volume exceeds that average by a configurable multiple, the candle is considered to occur during elevated participation.
This step is important because a Doji formed during low activity may simply reflect quiet trading, while a Doji formed during higher participation means more trading occurred but the candle still closed near equilibrium.
Normalized price-change proxy
The script then evaluates short-term directional behavior.
It measures the percentage change between consecutive closing prices. This series is smoothed to reduce noise and then normalized relative to recent behavior. The normalization allows the script to determine whether the current directional movement is unusually positive or negative compared with recent activity.
The script compares this normalized value with the previous bar. An alert requires the value to change sign between the two bars, which indicates that the short-term directional pressure has flipped.
Why the components are combined
Each component describes a different aspect of market behavior:
The Doji describes temporary balance inside a candle.
The volume comparison measures whether that balance occurred during elevated participation.
The directional flip indicates a shift in short-term pressure.
Basic Doji markers highlight every small-body candle. This indicator is more selective because it only highlights cases where equilibrium, participation, and directional change appear together.
Final alert logic
An alert is created when the following conditions occur simultaneously:
A Doji is present on the current candle or the previous candle.
Volume exceeds the recent average by the configured multiple when the volume filter is enabled.
The normalized directional reading flips sign between two consecutive bars.
Alerts are separated into bullish and bearish categories according to the direction of the normalized reading after the flip.
How to interpret the alerts
A bullish alert means the script detected a Doji context with elevated volume and a positive directional flip.
A bearish alert means the same conditions occurred with a negative directional flip.
The alert marks a moment where price equilibrium, increased participation, and directional change appeared together. These conditions may appear near short-term transitions, pauses, or local turning points.
How to use the indicator
This indicator is intended as a contextual chart tool rather than a standalone trading system.
Use alerts to locate Doji candles confirmed by participation and directional change.
Interpret bullish alerts as possible upward transitions and bearish alerts as possible downward transitions.
Evaluate the alert location relative to support, resistance, or recent trend structure.
Combine the alerts with other analysis tools or higher timeframe context.
Why Heikin Ashi often works well
The script can be used on any chart type, but Doji detection often becomes clearer on Heikin Ashi candles.
Heikin Ashi candles smooth short-term price fluctuations by averaging values from multiple bars. Because the indicator relies on candle body and wick proportions, this smoothing reduces small random Doji created by short-term noise and produces clearer candle structures.
Limitations
Doji candles occur frequently and do not inherently indicate reversals.
Volume filters depend on the quality and meaning of the exchange’s volume data.
The directional proxy is based on price changes rather than direct order flow.
Different markets, timeframes, and preset settings can change how often alerts appear.
The indicator highlights situations where candle equilibrium, elevated participation, and directional change appear together, but it does not determine future price direction. אינדיקטור
אינדיקטור
אינדיקטור

אינדיקטור

אינדיקטור
אינדיקטור
אינדיקטור
BK AK-HA Window🖥️ BK AK–HA PnF Window 🖥️
🙏 All glory to G-d
Respect to AK — discipline, patience, clean execution.
HA Window is a compact “analysis panel” that lives on your chart.
It lets you toggle between two different ways of reading structure:
Heikin Ashi Window (normalized, consistent OB/OS framework)
Point & Figure Window (clean X/O structure with targets + pattern logic)
This is not financial advice and it’s not a promise of results. It’s a visual decision tool designed to help you track trend, structure, and reaction quality with fewer distractions.
1) Quick Start (60 seconds)
Content → Heikin Ashi if you want trend + turning-point context inside a fixed OB/OS framework.
Content → Point & Figure if you want clean structure (X/O columns), break/rotate behavior, and objective counting tools.
Keep Lock to Last Bar = ON and adjust:
Width (candles)
Height (ATR multiple or % range)
Future Offset to park the panel neatly to the right.
2) Mode A — Heikin Ashi Window (Normalized Oscillator Candles)
This mode takes Heikin Ashi OHLC and maps it into a stable window range with:
0 / Overbought / Oversold levels
Optional zone fills for quick “where are we?” context
HA candle rendering with spacing options (1-bar or centered 2-bar mode)
Built-in confirmations (optional)
EMA overlay on the HA close (bias + pullback structure)
Pivot highs/lows (structure markers)
Buy/Sell markers (HA color flip events)
Divergence detection (RSI or MFI) with swing filters (so it doesn’t spam)
Volume spike highlighting (Volume ROC) to flag “activity candles”
Session shading (Asia / London / RTH) for time-context
Pattern recognition (optional)
The window can tag common HA behaviors like:
Flat tops/bottoms (level sensitivity)
Acceleration vs deceleration
Compression/inside bars
Absorption / exhaustion signatures
These are presented as context labels, not “guaranteed signals.”
3) Mode B — Point & Figure Window (X/O Structure Map)
PnF is about structure without time noise. This mode builds X/O columns and renders them inside a clean grid.
Auto box sizing (important)
Instead of forcing one ATR length, the script can evaluate several ATR candidates and select the one that best matches price behavior over the chosen lookback. That means:
less arbitrary box size guessing
more consistent columns across symbols/timeframes
What’s included (optional)
PnF reversal detection (X→O / O→X) + alert conditions
Pattern recognition (double/triple breaks, ascending/descending triples, catapults)
Gann/PnF counting tools
Horizontal count (congestion width → projected objectives)
Vertical count (column height → objective projection)
45° trend lines (classic PnF rails)
Congestion zone box (where acceptance is forming)
Price level labels (turns the panel into a quick S/R ladder)
Volume weighting (opacity or glyph size)
Column “box count” + time-in-column
quick read on thrust vs rotation/absorption behavior
MTF + LTF direction badges
alignment = higher confidence context
disagreement = “slow down and verify”
4) How to Use It (simple workflow)
Step 1 — Bias:
HA mode: EMA + candle color + zone location
PnF mode: column direction + HTF badge
Step 2 — Location:
HA mode: OB/OS + pivots
PnF mode: congestion zones + price level ladder
Step 3 — Confirmation:
HA flip + divergence/pattern context
PnF reversal/pattern + timeframe alignment
Step 4 — Management:
Use structure (pivots / PnF rails / count objectives) to manage expectations
Don’t treat the panel as a “prediction machine” — treat it as a clarity tool
5) Settings Suggestions
For fast intraday:
Smaller window width, keep PnF rows capped for readability, let auto-box sizing do the work.
For higher timeframe:
Increase correlation lookback + window width
Use MTF badge to stay aligned with the bigger structure
🖥️ BK AK–HA Window 🖥️ אינדיקטור
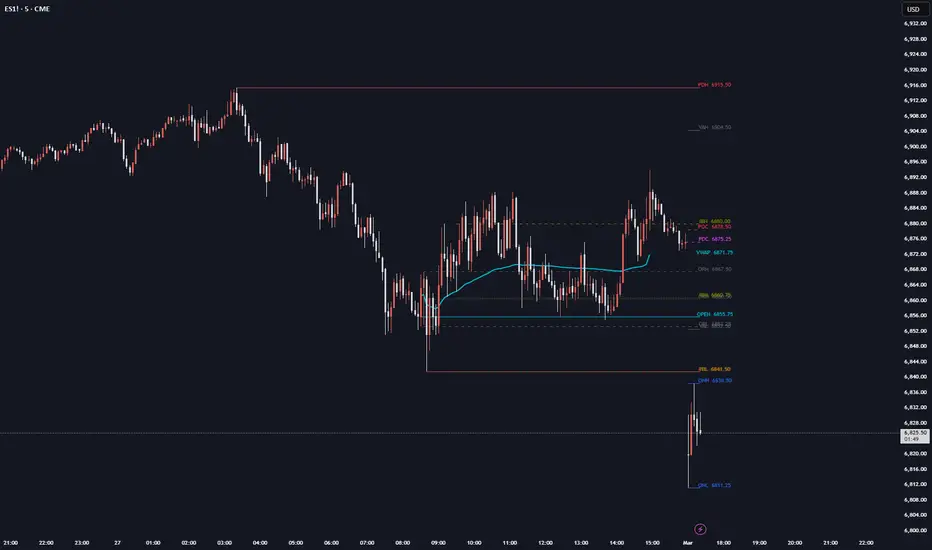
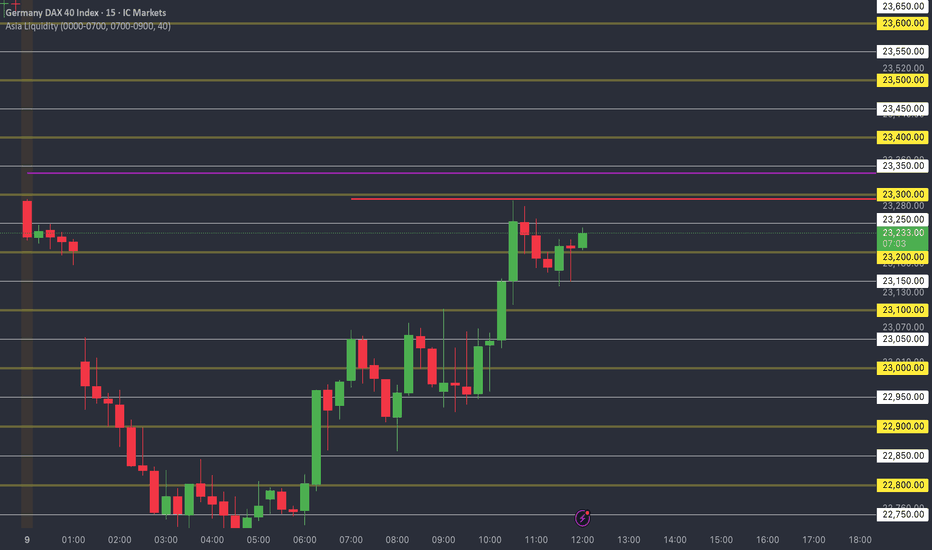
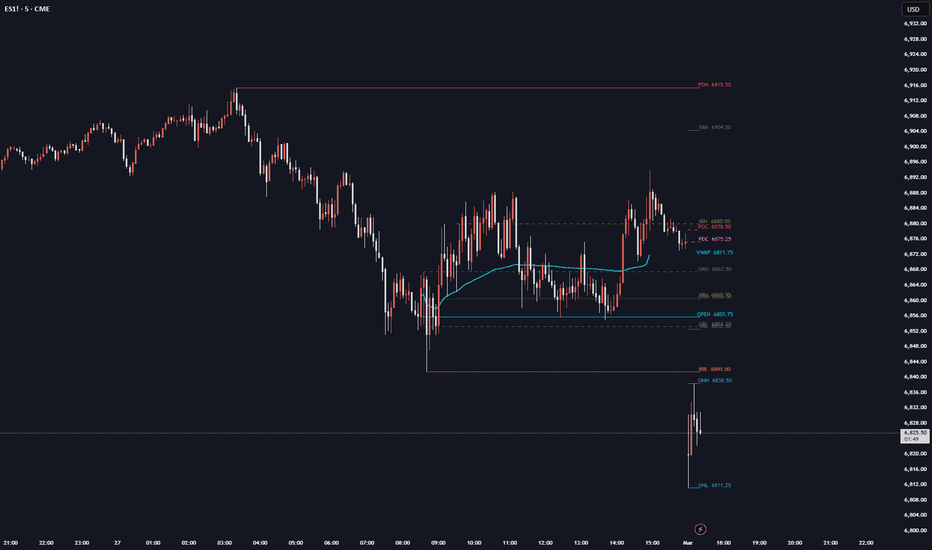
Daily MGI - OnlyFlowMGI (Market Generated Information) plots key daily reference levels used by auction market and order flow traders. It draws Prior Day High, Low, Mid, and Close, Overnight High/Low, Opening Range, Initial Balance, RTH VWAP, and Value Area levels — all with price labels extending to the current bar.
Each line originates from the bar where the level was actually printed, giving you immediate visual context on where the market established its boundaries.
Features:
- Full Day (ETH) or RTH Only mode for prior day levels
- Configurable Opening Range and Initial Balance durations with ±50/100/150/200% extensions
- RTH VWAP and session midline
- Approximate prior day Value Area (VAH/VAL/POC)
- All levels togglable with customizable colors and label sizes
- Lines draw from their origin point to the current bar
Built as a lightweight alternative to paid order flow packages. Designed for futures (ES, NQ, etc.) but works on any instrument with defined RTH/ETH sessions. Adjust the RTH and ETH session times in settings to match your market. אינדיקטור
EBP + FibThis indicator automatically detects bullish and bearish EBP candles, highlights them visually, and generates an inverted Fibonacci framework used to plan continuation trades with precision.
🔍 What This Indicator Does
This tool fully automates the EBP workflow:
1. Detects Bullish & Bearish EBP Candles
Bullish EBP: price sweeps prior lows and closes strongly above the previous open/close.
Bearish EBP: price sweeps prior highs and closes strongly below the previous open/close.
EBP candles often serve as high-probability directional anchors, defining short-term and medium-term bias.
2. Plots an Inverted Fibonacci Framework
Once an EBP candle forms, the script builds a custom inverted fib projection using the candle’s high/low as anchor points.
The levels used:
1.0 – EBP extreme
0.75 / 0.65 / 0.50 / 0.25 / 0.0 – retracement levels
-0.25 / -0.50 – continuation targets
3. Clean Labeling & Custom Styling
You can customize:
Level colors
Line weights & styles
Label positions (left, middle, right)
Label text size
Vertical spacing (to separate labels from lines)
Labels show the actual fib value for fast reference during execution.
4. Directional Bias Made Simple
The indicator colors EBP candles and displays fib levels that express the market’s expected path:
Bullish: price is expected to retrace into 0.50–0.65, hold above the 1.0 extreme, and extend toward negative extensions.
Bearish: identical logic mirrored downward.
This makes bias extremely easy to read on any timeframe (1m → 4H → HTF).
5. Built-in Alerts
The indicator includes alert conditions for:
Bullish EBP detected
Bearish EBP detected
___________________________
___________________________
📈 How Traders Use This Tool
This indicator is designed for traders who want a clean, systematic framework for trading EBP-based continuation setups.
Common execution models:
🔹 Bullish EBP
A 1H or 4H bullish EBP forms → bullish bias.
Wait for price to retrace into the 0.65 or 0.50 level.
Look for lower-timeframe confirmation (BOS, sweep + reclaim).
Target 0, -0.25, or -0.50.
🔹 Bearish EBP
Mirror the process above.
This workflow is widely used in algorithmic price action, continuation models, and liquidity-based trading.
___________________________
___________________________
✨ Ideal For
Liquidity-based traders
Smart money / ICT-fluent traders
Continuation model traders
Systematic backtesters
Intraday ES/NQ/MNQ/MES traders
Crypto scalpers using HTF bias
אינדיקטור

אינדיקטור

אינדיקטור

אינדיקטור

אינדיקטור
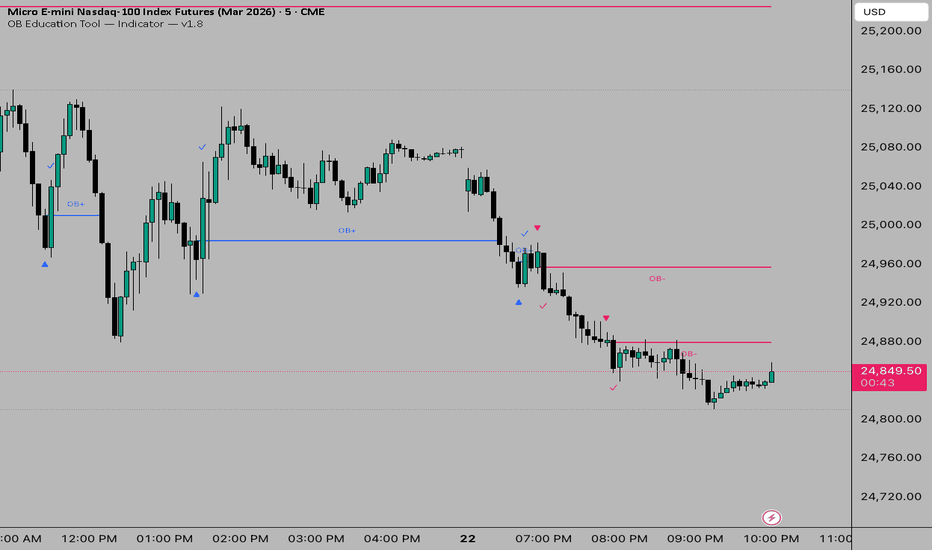
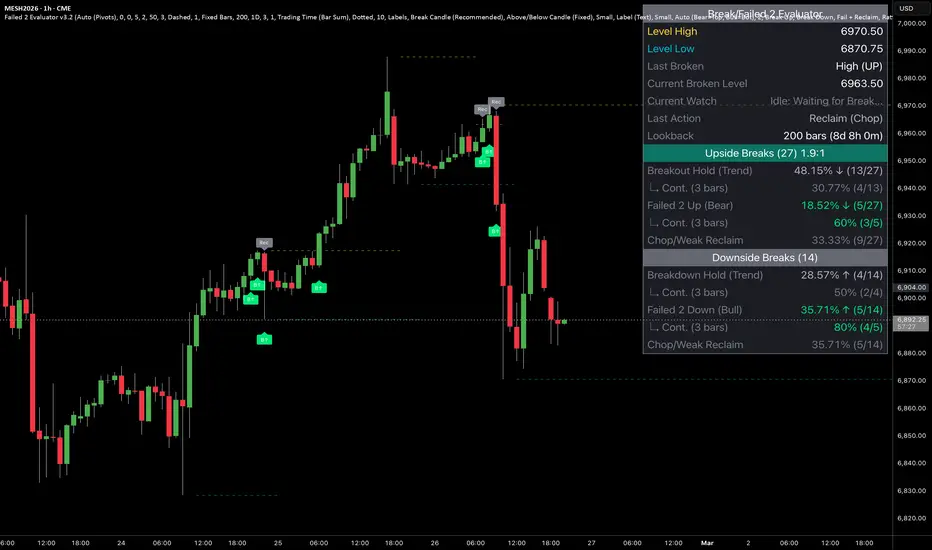
Failed 2 Evaluator v2.2-Failed 2 Evaluator & Continuation EngineDescription:
The Failed 2 Evaluator & Continuation Engine is an objective price-action analysis tool designed to categorize, visualize, and statistically track how Failed 2 candles behave when interacting with key market levels.
This indicator evaluates whether a breach of a level results in price expansion, choppy price action, or a strict structural failure (a "Failed 2" in Strat terminology), providing traders with a quantitative view of historical follow-through.
How It Is Calculated
The script operates in three distinct phases:
1. Level Generation & Trigger
The indicator establishes boundaries using either auto-calculated Pivot Highs/Lows (with user-defined left/right lengths) or manually inputted price levels. The evaluation sequence is triggered the moment a candle's total range (wick) physically breaches one of these active levels.
2. Strict Outcome Evaluation (On Close)
Once the triggering candle closes, the script strictly categorizes the outcome into one of three buckets:
Breakout/Breakdown Expansion: The candle successfully closes outside the breached level, indicating a continuation of the break.
Strict Failed 2 (F2U / F2D): The candle breaches the level but immediately reverses, failing to hold the extreme. To qualify as a true Failed 2, the script enforces a strict structural rule: the candle must close back inside the level and must be a directional reversal candle (e.g., an F2U requires the close to be below the level and below its own open).
Neutral Reclaim (Chop): The candle breaches the level and falls back inside, but fails the strict color/directional logic of a true Failed 2.
3. The Continuation Engine
When a strict Failed 2 is confirmed, the script activates a forward-looking continuation tracker. It records the closing price of the Failed 2 candle and waits a user-defined number of bars (e.g., 3 bars). It then checks if the price at that future bar successfully continued in the direction of the reversal, logging the historical frequency of structural follow-through.
Dashboard Features & Chart Visuals
Real-Time Watcher: A dynamic table row alerts the user when a live, unconfirmed candle is actively testing a level, prompting observation for either a Continuation or a Failed 2.
Historical Distribution: The dashboard calculates the exact percentage breakdown of Expansions, True Failed 2s, and Chop over a user-defined lookback window.
Chart Markers: Clean, unobtrusive visual tags pinpoint exactly where Breaks (B↑/B↓) and True Reversals (F2U/F2D) occurred on the chart for easy visual backtesting.
Analytical Purpose
The primary benefit of this tool is the removal of emotional bias and subjectivity from "false breakout" analysis. By rigidly defining what constitutes a failed move and statistically tracking its historical continuation rate, this indicator allows analysts to quantify an asset's unique behavior at range extremes. It transforms abstract price action theories into measurable, observable data. אינדיקטור

אינדיקטור

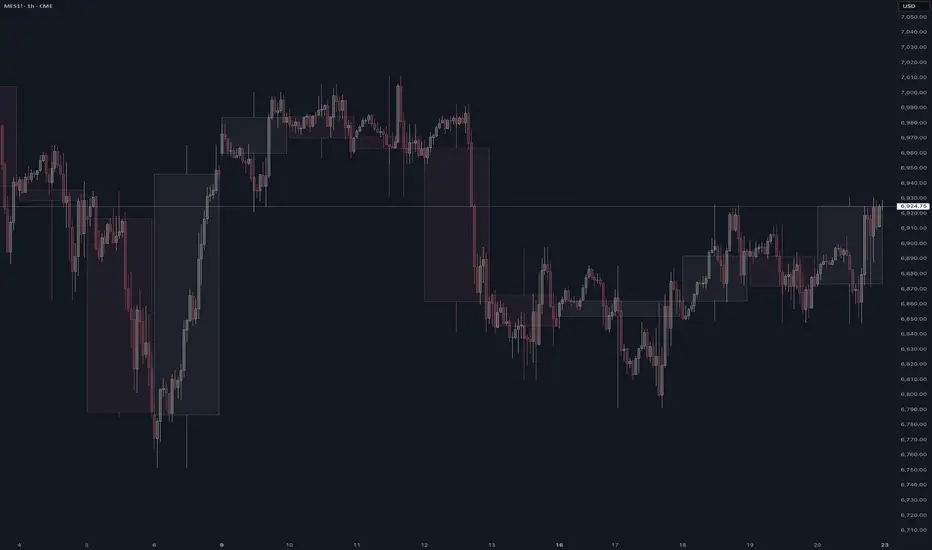
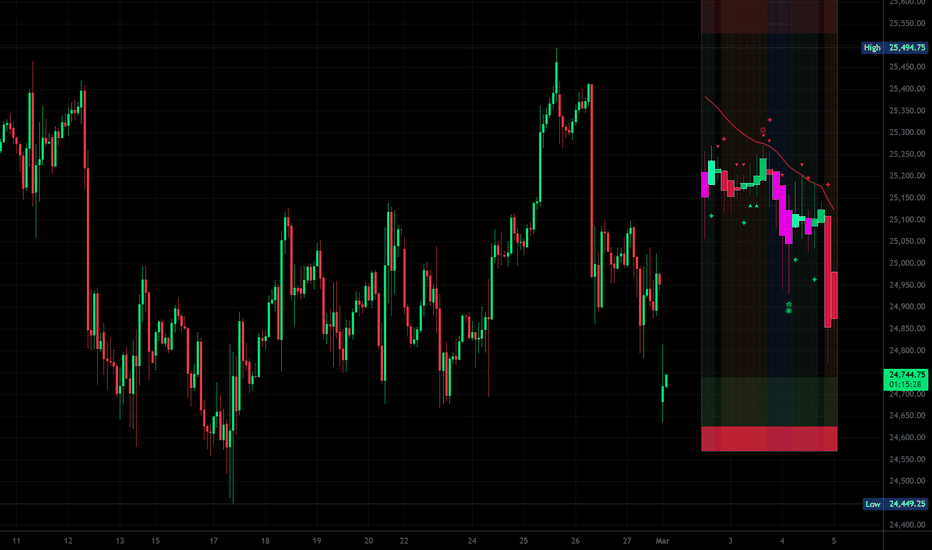
HTF Candle Dynamics [LuxAlgo]The HTF Candle Dynamics indicator provides traders with a comprehensive view of Higher Timeframe (HTF) price action and volume distribution directly on their lower timeframe charts. By projecting the current developing HTF candle and its internal volume characteristics to the right of the price, users can maintain high-level context without switching tabs.
Note: Ensure the chart timeframe is lower than the selected HTF setting for the indicator to function correctly.
🔶 USAGE
This tool is designed to bridge the gap between execution timeframes and higher-level market structures. It is particularly useful for scalpers and day traders who need to stay aware of Daily or Weekly levels while trading on 1-minute or 5-minute charts.
🔹 HTF Candle Projection
Visualizes the current HTF period (e.g., Daily, Weekly) as a dynamic candle on the right side of the chart. It includes projections for the HTF Open, High, Low, and Close levels. These levels often act as significant psychological barriers where price might find support or resistance.
🔹 Intraday Volume Profile
Generates a volume profile specifically for the current HTF period. This allows traders to see where the most volume is being transacted within the developing candle. Identifying "High Volume Nodes" within the current HTF candle can signal where institutional interest is concentrated.
🔹 Dynamic POC Tracking
A polyline tracks the movement of the Point of Control (POC) throughout the HTF period, showing how the most traded price level has shifted over time. If the POC is trending upward alongside price, it confirms a healthy bullish trend; if price moves away from a static POC, it might indicate a potential mean reversion back to that high-volume level.
🔹 How to Use
Traders can utilize this indicator to align their intraday trades with the broader market direction:
Identifying Value : Use the Intraday Volume Profile to spot the Point of Control. If the price is trading above the POC, the market is currently in a premium zone for that HTF. If it is below, it may be considered "discounted" relative to the volume transacted so far.
Breakout Confirmation : When price breaks the High or Low of the projected HTF candle, traders look for volume expansion within the profile to confirm if the breakout has significant participation.
Mean Reversion : The Dynamic POC line acts as a magnet. If price overextends significantly from the POC line, traders often look for signs of exhaustion to play a move back toward the high-volume area.
🔶 DETAILS
The indicator uses security calls to fetch historical HTF data while calculating the current developing period in real-time. A dedicated status table ensures the selected HTF is valid relative to the chart timeframe to prevent calculation errors.
🔹 History Dashboard
The dashboard provides a statistical breakdown of the previous three HTF candles (T-1, T-2, T-3). This is crucial for "Contextual Trading." By seeing the OHLC values and Volume Delta of the previous periods, you can determine if the market is experiencing "Expansion" (increasing volume and candle size) or "Contraction" (decreasing volume and tighter ranges).
🔹 Volume Delta
The Volume Delta shown in the history dashboard is an approximation calculated by summing volume based on the direction of individual intraday candles.
🔶 SETTINGS
HTF Setting : Defines the timeframe for the candle projection and volume profile (default is "D").
Right Offset : Adjusts the horizontal position of the projected candle and labels to avoid overlapping with price.
Visuals : Full control over bullish/bearish colors, POC lines, and projection offsets.
Volume Profile : Toggle the profile visibility and customize the number of rows or the maximum width of the bars.
History Dashboard : Toggle the history dashboard and adjust its position (Top Right, Bottom Right, etc.) or size.
אינדיקטור

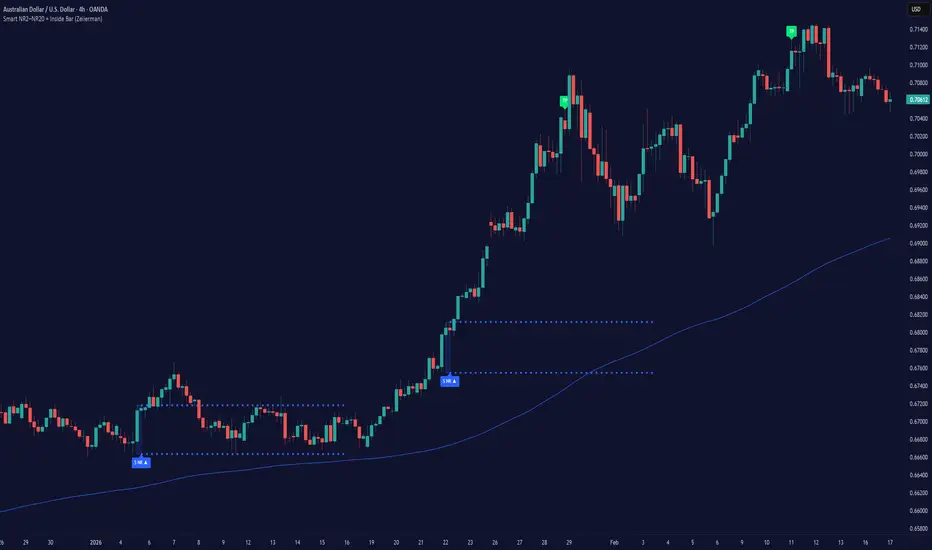
Smart NR2-NR20 and Inside Bar (Zeiierman)█ Overview
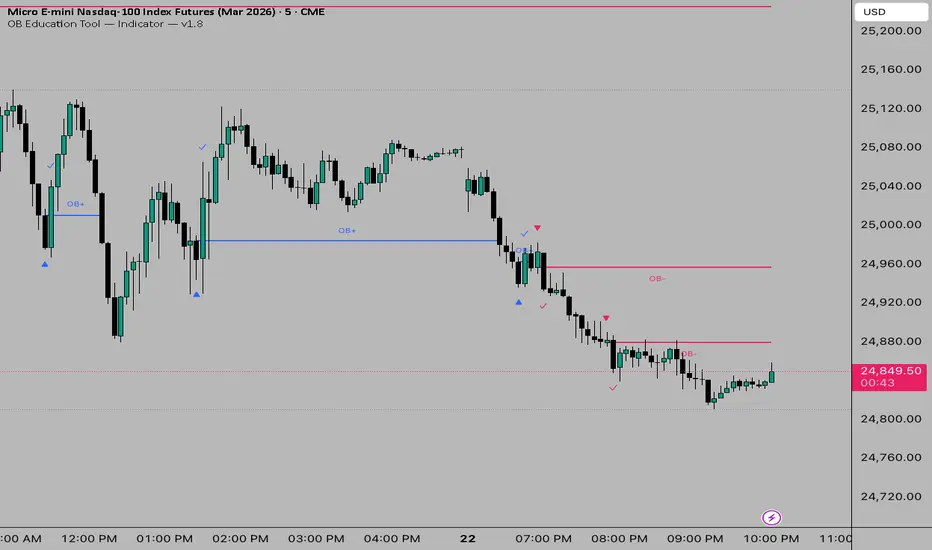
Smart NR2–NR20 + Inside Bar (Zeiierman) is a compression + breakout scanner that searches for the tightest Narrow Range (NR) condition across NR2…NR20, plus optional Inside Bar detection. When a valid compression forms, it draws a box around the setup, projects the high/low levels forward, and triggers on the first breakout. Optional Trend Filter logic can restrict triggers to trend-aligned breakouts, and optional Exit markers can annotate TP / SL / Time exits after a trigger.
🔘 What It Detects
The Smart Narrow Range (NR2…NR20) script continuously checks NR lengths from 2 to 20 and selects the most extreme contraction (tightest relative range vs history) inside the current Look Back window, highlighting the strongest “compression” zones where expansion risk is building. Optionally, it can also treat an Inside Bar as a valid compression trigger.
█ How It Works
⚪ 1) Compression Scan (NR Ranking Engine)
For each bar, the script evaluates NR2…NR20:
It calculates the N-bar range (highest high − lowest low).
It compares that range to prior N-bar ranges over Look Back.
It ranks candidates by “tightness” and keeps the strongest one.
Key effect:
Higher Look Back = fewer but higher-quality compressions
Lower Look Back = more frequent compressions
⚪ 2) Adaptive Look Back (Static or ADX-Adaptive)
Look Back can be:
Static: fixed comparison window
ADX Adaptive: Look Back dynamically shifts between LB Min and LB Max depending on trend strength
Conceptually:
Higher ADX (strong trend) — shorter Look Back (more responsive)
Lower ADX (chop/range) — longer Look Back (more selective)
█ How to Use
⚪ Bullish Setup
Wait for a tight range to form
Enter on a breakout above the range high
Stop below the opposite side of the range
Target a multiple of the range size or trail with momentum
Optional: wait for a small breakout retest before entering
⚪ Bearish Setup
Wait for a tight range to form
Enter on breakout below the range low
Stop above the opposite side of the range
Target a multiple of the range size or trail with weakness
Optional: enter on breakdown retest
█ Settings
Enable Inside Bar — toggles Inside Bar detection.
Look Back (compare window) — history window used to judge contraction quality.
Enable Trend Filter — gates long/short triggers relative to Trend MA.
Show Trend MA — plots the Trend MA on chart.
Trend MA Mode — Static or NR-Adaptive (length follows Look Back × multiplier).
MA Type — EMA or RMA smoothing for the Trend MA.
NR — MA Multiplier — scales adaptive MA length from Look Back.
Static MA Length — used when Trend MA Mode is Static.
Look Back Mode — Static or ADX Adaptive.
ADX Length / ADX Low / ADX High — controls adaptive response to trend strength.
LB Min / LB Max — bounds for adaptive Look Back range.
-----------------
Disclaimer
The content provided in my scripts, indicators, ideas, algorithms, and systems is for educational and informational purposes only. It does not constitute financial advice, investment recommendations, or a solicitation to buy or sell any financial instruments. I will not accept liability for any loss or damage, including without limitation any loss of profit, which may arise directly or indirectly from the use of or reliance on such information.
All investments involve risk, and the past performance of a security, industry, sector, market, financial product, trading strategy, backtest, or individual's trading does not guarantee future results or returns. Investors are fully responsible for any investment decisions they make. Such decisions should be based solely on an evaluation of their financial circumstances, investment objectives, risk tolerance, and liquidity needs.
אינדיקטור

אסטרטגייה

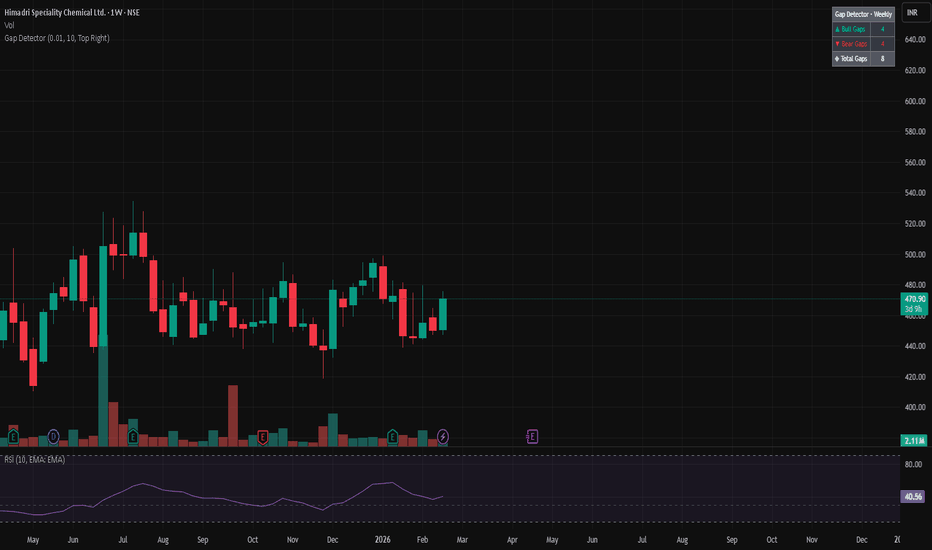
Gap DetectorGap Detector — Multi-Timeframe Price Gap Scanner
Automatically detects and visualizes all price gaps across any timeframe — Daily, Weekly, Monthly, or Intraday.
📊 What It Does
This indicator identifies true price gaps where the current candle opens completely above (gap up) or below (gap down) the previous candle's range, with no price overlap between them.
Gap Up (Bullish): Current candle's low > Previous candle's high
Gap Down (Bearish): Current candle's high < Previous candle's low
✨ Key Features
✅ Auto-Detects Chart Timeframe — Works on any timeframe without manual selection (1min, 5min, 1H, 4H, Daily, Weekly, Monthly)
✅ Visual Gap Boxes — Green boxes for gap ups, red boxes for gap downs, drawn exactly across the gap zone
✅ Gap Size Labels — Shows gap percentage on each box for quick assessment
✅ Customizable Filters — Set minimum and maximum gap size % to filter noise
✅ Summary Statistics Table — Live count of bull gaps, bear gaps, and total gaps detected
✅ Pine Screener Compatible — Built-in signals for bulk scanning stocks with gaps
✅ Clean & Lightweight — No repainting, no lag, works on all markets (stocks, forex, crypto, indices)
🎯 Use Cases
Day/Swing Trading: Identify gap fill opportunities on intraday and daily charts
Earnings Plays: Track post-earnings gaps on daily/weekly timeframes
Breakout Confirmation: Gaps often signal strong momentum or trend continuation
Support/Resistance Zones: Unfilled gaps act as magnets for price action
Multi-Timeframe Analysis: Scan 4H gaps, daily gaps, or weekly gaps depending on your strategy
🛠️ Settings
Visibility Controls:
Toggle bull gaps, bear gaps, labels, and summary table on/off independently
Filter Settings:
Min Gap Size (%) — Ignore gaps smaller than this threshold (default 0.1%)
Max Gap Size (%) — Ignore abnormally large gaps like circuit breaker moves (default 5%)
Style Customization:
Gap box colors, border colors, and table position (Top Right, Top Left, Bottom Right, Bottom Left)
📈 How to Use with Pine Screener (TradingView Pro+)
Add indicator to any chart and set your desired timeframe (e.g., 4H for intraday gaps)
Open Pine Screener (bottom toolbar)
Select Gap Detector indicator
Choose Bull Gap Signal or Bear Gap Signal
Set condition: Above → 0
Click Scan to find all stocks with gaps on current candle
Screener Outputs:
Bull Gap Signal = 1 → Gap up formed on current candle
Bear Gap Signal = 1 → Gap down formed on current candle
Signal = 0 → No gap on current candle
📌 Notes
Gaps are detected based on previous candle close to current candle open — not wicks
Works on all markets and instruments where gaps occur (stocks, forex, crypto, futures, indices)
Signal plots appear in a separate pane below the chart for clean visualization
Gap count resets when you reload the chart or change timeframes
💡 Pro Tips
4H Timeframe: Great for intraday gap trading on volatile stocks
Daily Timeframe: Classic overnight gaps — ideal for gap fill strategies
Weekly/Monthly Timeframe: Macro trend analysis and major support/resistance zones
Combine with volume or momentum indicators for higher-probability setups
Created for traders who need fast, reliable gap detection without manual scanning. אינדיקטור
אינדיקטור

FVG Mapper + FilterHTF FVG Mapper — Multi-Timeframe Imbalance Projection
For some reason its not showing on the chart above, this site is a buggy mess sometimes, the UI is just the worst.
This script detects Fair Value Gaps (FVGs) on a selectable higher timeframe (HTF) and projects them onto lower timeframes (such as 1-minute) as extended zones. While commonly used with the 4-hour chart, the timeframe is fully customizable, allowing traders to map imbalances from any higher timeframe onto their execution chart.
What the Script Does
Scans a user-defined higher timeframe using the classic 3-candle FVG model
Identifies bullish and bearish imbalances (true displacement gaps)
Allows full HTF selection (e.g., 1H, 4H, Daily, etc.)
Filters out insignificant gaps using HTF ATR (optional size filter)
Draws zones on the lower timeframe chart and extends them right
Deletes zones once mitigated (if enabled)
Limits the total number of active zones to reduce clutter
Optionally removes zones far from current price
Allows wick-based or body-based mitigation detection
How Fair Value Gaps Are Defined
Bullish FVG → Low of candle 3 is greater than High of candle 1
Bearish FVG → High of candle 3 is lower than Low of candle 1
This reflects displacement and temporary imbalance in auction delivery.
Important: FVGs are confirmed only after the selected HTF candle closes to prevent repainting.
Customisation Options
Select the higher timeframe to scan (not restricted to 4H)
Set maximum number of visible zones
Enable/disable automatic deletion after mitigation
Enable minimum size filtering using HTF ATR
Adjust minimum gap size sensitivity
Enable proximity filtering (show only zones near current price)
Toggle wick-based vs body-based fill detection
Adjust visual styling (colors, transparency)
Intended Usage
This indicator is designed for traders who:
Trade lower timeframes but anchor bias to higher-timeframe structure
Use HTF imbalances as reaction or continuation zones
Look for confluence between liquidity sweeps and HTF inefficiencies
Want structured multi-timeframe context without visual overload
Typical Workflow
Select a higher timeframe aligned with your bias (e.g., 4H or Daily)
Identify active imbalances on your execution timeframe
Wait for price to approach an HTF FVG
Drop to lower timeframe structure for confirmation
Execute with defined invalidation beyond the zone
Important Context
This indicator does not generate buy/sell signals
It does not predict direction
It visualizes higher-timeframe inefficiencies only
Trade management and bias determination remain trader-dependent
It is not a mechanical strategy.
It is a multi-timeframe structural context tool designed to improve execution precision within higher-timeframe imbalance zones.
אינדיקטור

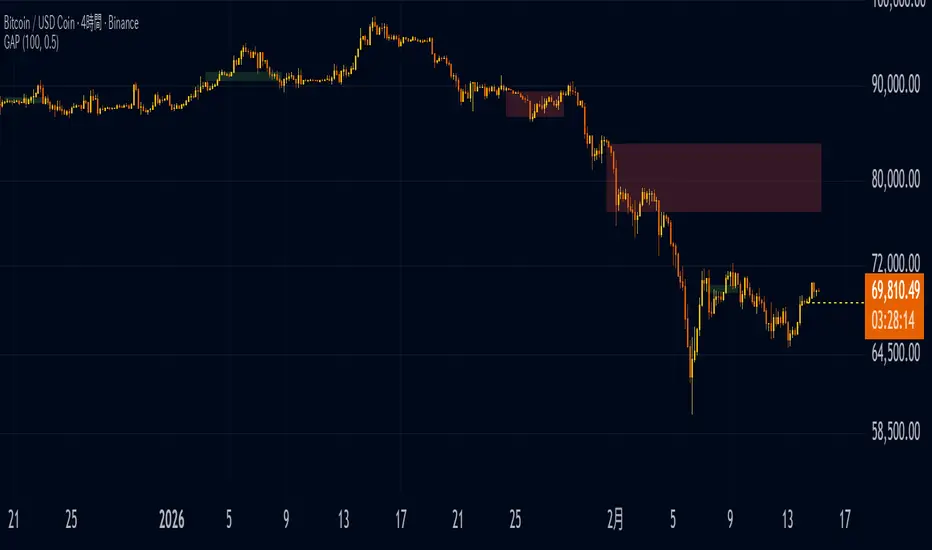
Bitcoin CME GAP [SAKANE]This indicator detects and visualizes the weekend gap in CME Bitcoin futures (BTC1!), defined as the difference between the Friday settlement price and the Monday opening price. It stores the final CME close, waits for trading to resume, and then measures the gap. If the gap exceeds the user-defined threshold, it is displayed as a box on the chart. The box remains active until price returns to the gap’s closing level or a specified number of bars has elapsed. During the CME weekend closure, a horizontal reference line marks where CME last settled, providing a clear anchor for price positioning.
A key feature is that the gap is displayed correctly even on spot or perpetual BTC charts. Because futures prices often trade at a premium or discount relative to spot markets, plotting CME levels directly would misplace the gap. This script calculates the price difference between CME and the chart instrument and shifts the gap vertically into the chart’s price space while preserving its true size. As a result, traders can see the actual gap location where market participants are likely to react, without distortion from futures basis differences.
Gap-fill detection is performed using CME futures prices themselves. The script evaluates whether the CME high or low has reached the prior CME close level that defines the gap. This ensures that once the gap is filled in the futures market, it is considered filled everywhere. Because of this CME-based validation combined with spot-space visualization, users can determine whether a gap has closed without switching to the BTC1! chart.
CME gaps are widely observed by market participants because price frequently revisits and fills these discontinuities. By highlighting both the location and the fill status of the gap, this indicator helps track the gap-closure tendency and provides insight into short-term liquidity imbalances, derivatives-driven dislocations, and the market’s process of price repair. אינדיקטור