אינדיקטור

אינדיקטור
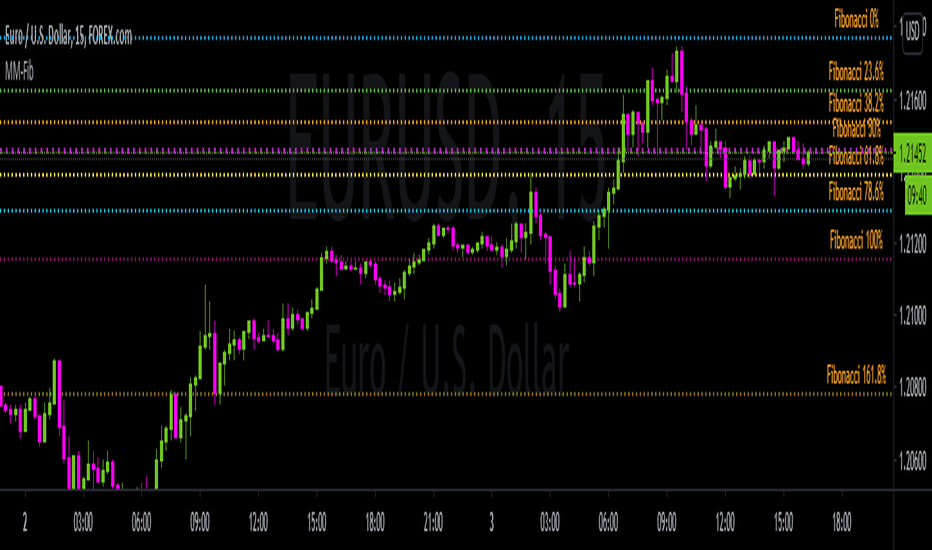
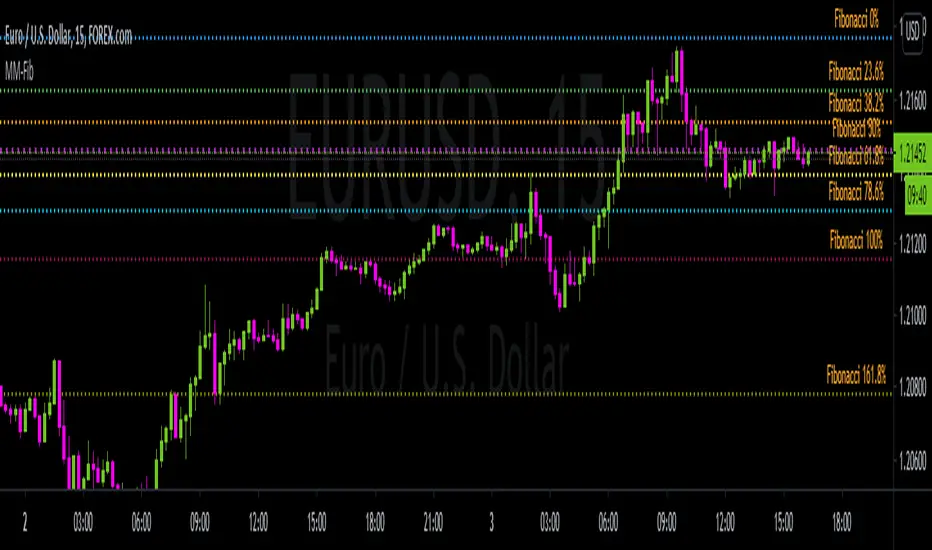
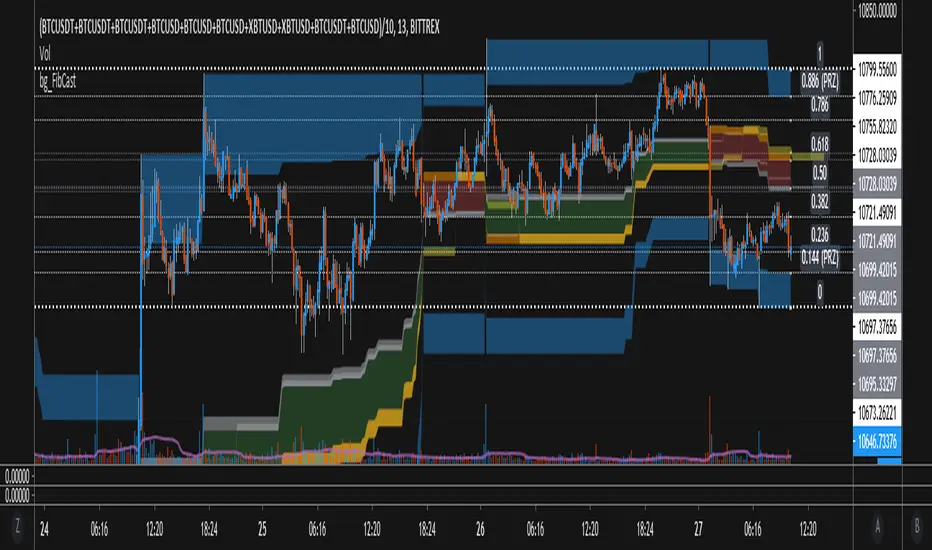
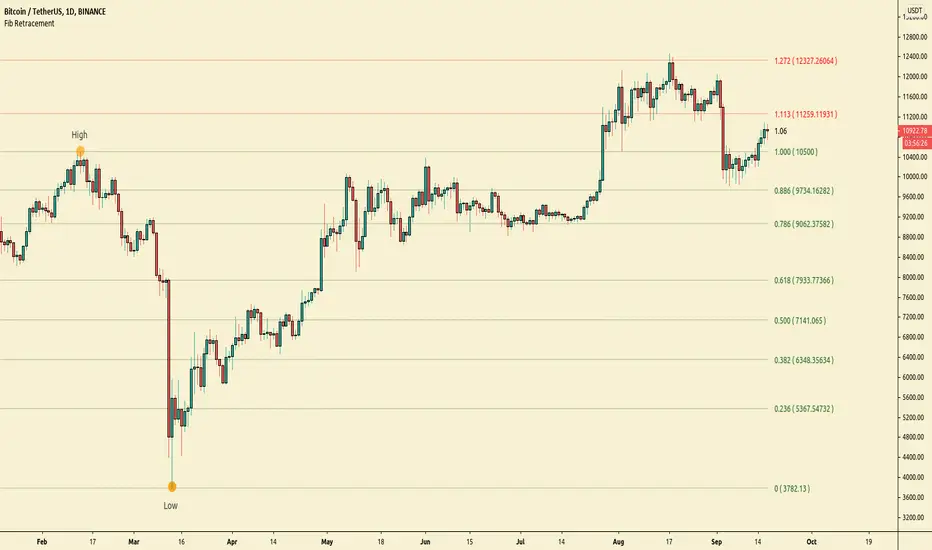
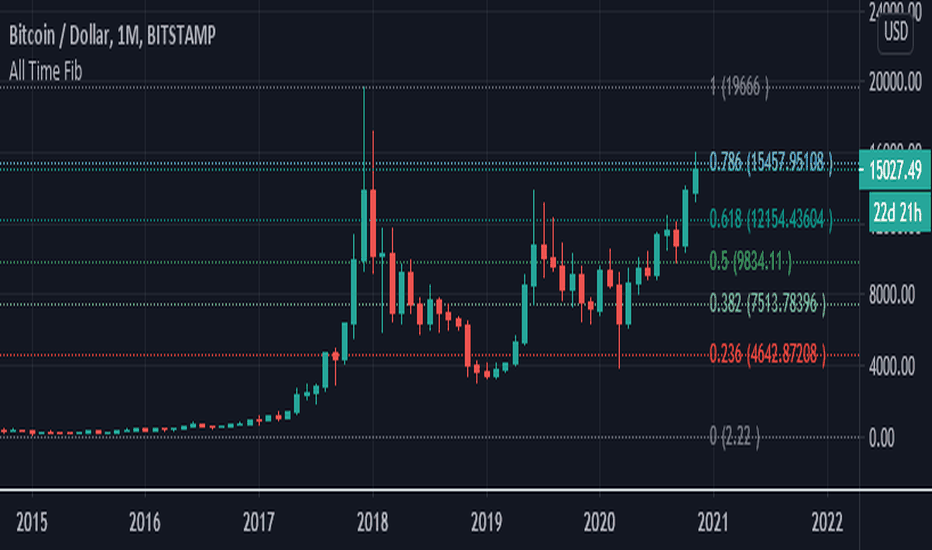
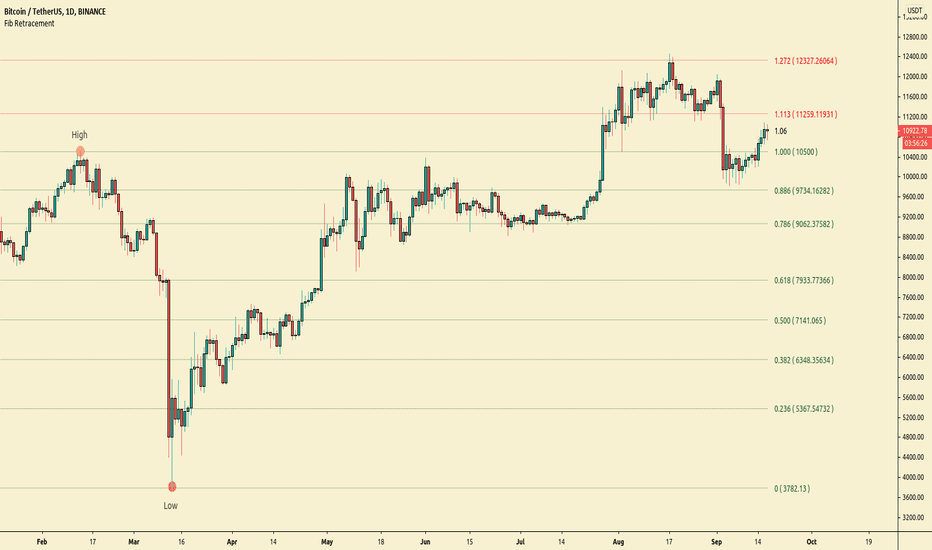
Automatic FibonacciFibonacci retracements are popular among technical traders. In technical analysis, a Fibonacci retracement is created by taking two extreme points (usually a peak and a trough) on a stock chart and dividing the vertical distance by the key Fibonacci ratios of 23.6%, 38.2%, 50%, 61.8%, and 100%. Basic fibo levels are often known to be 14.6%, 23.6%, 38.2%, 50%, 61.8%, 76.4%, 88.6% and 100%.
This indicator will draw the fibonacci levels automatically. Once these levels are identified, horizontal l אינדיקטור

אינדיקטור

אינדיקטור

אינדיקטור

אינדיקטור
אינדיקטור
אינדיקטור

אינדיקטור

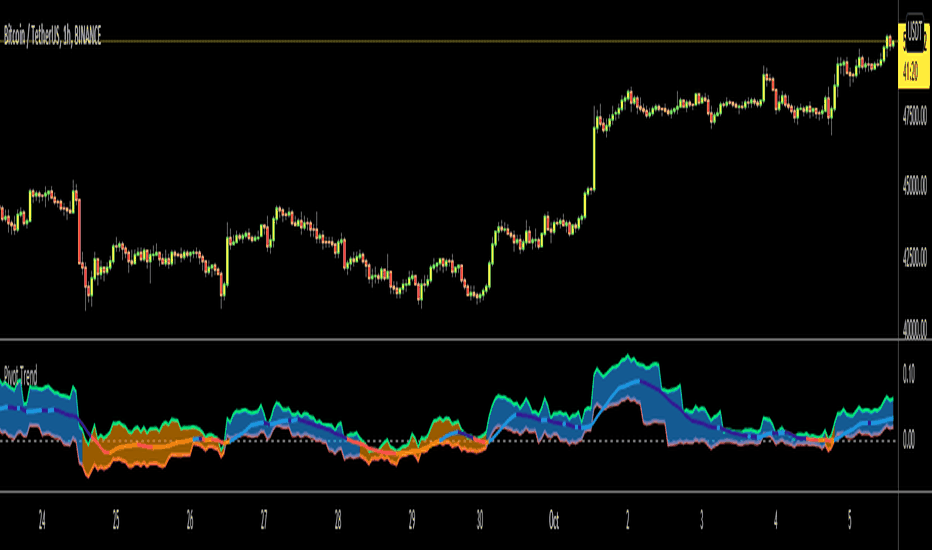
Trend Following with Moving AveragesHello Traders,
With the info "Trend is Your Friend ", you should not take position against the trend. This script checks multipte moving averages if they are above/below the closing price and try to find trend. The moving averages with the length 8, 13, 21, 34, 55, 89, 144, 233, 377 used. these are fibonacci numbers, but optionally you can change the lengths of each moving averages. while it's green you better take long positions, while it's red you better take short positions according to o אינדיקטור

אינדיקטור

אינדיקטור
אינדיקטור

אינדיקטור

אסטרטגייה

אינדיקטור

אינדיקטור
אינדיקטור

אינדיקטור

אינדיקטור

אינדיקטור
אינדיקטור

אינדיקטור