אסטרטגייה

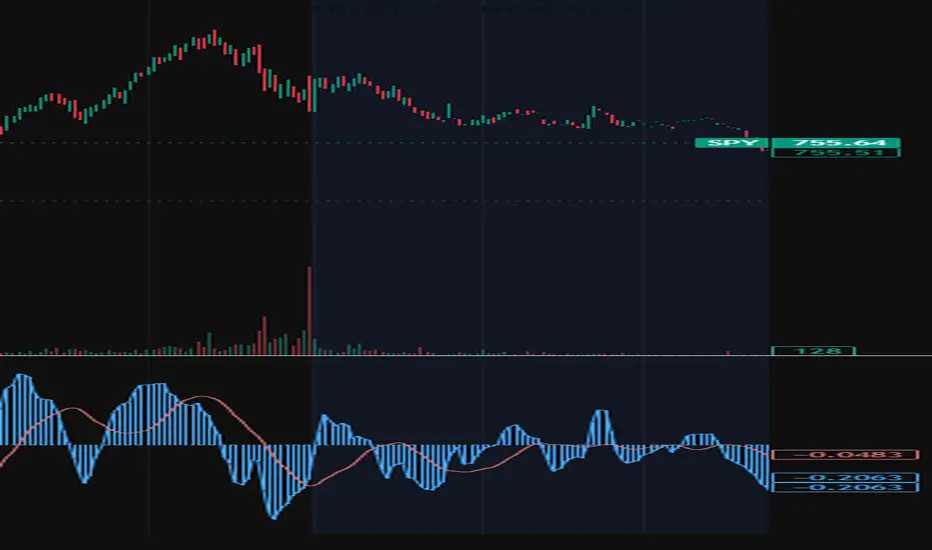
MACD + Timeframe DisplayHave you ever maximized your MACD pane to get a closer look at a crossover, only to realize the top toolbar disappeared and you forgot exactly which timeframe you were analyzing?
This indicator solves that frustrating UI quirk.
This script is a 1:1 replica of TradingView’s standard built-in MACD, but with one major quality-of-life upgrade: it features a dynamic, built-in display table in the top right corner of the indicator pane that continuously tracks your active chart timeframe.
Because the text is drawn directly onto the indicator's canvas, it stays perfectly visible even when the pane is double-clicked and maximized.
Key Features:
Classic MACD Math: Uses the exact same calculations, inputs, and histogram color schemes as the default TradingView MACD. Your signals and familiar aesthetics remain completely unchanged.
Smart Timeframe Formatting: Automatically detects your active timeframe and converts raw minutes into a clean, human-readable format. Instead of displaying "60" or "240", it dynamically formats the text to "1H", "4H", "15m", "1D", etc.
Unobtrusive UI: The timeframe is displayed in a clean, semi-transparent box in the top right corner of the pane, ensuring it doesn't block your view of the moving averages or histogram.
How to use:
Simply add it to your chart, replace your old MACD, and customize your moving average lengths just like you normally would. The timeframe display is entirely automatic! אינדיקטור

Adaptive MACD Regime, Volatility Bands & Conviction# Adaptive MACD — Regime, Volatility Bands & Conviction
## What this is
This is a single, self-contained momentum framework built around **one normalized MACD core**. Instead of plotting a raw MACD and leaving you to judge it, the script surrounds that core with the context a momentum reading needs to be usable: a market-regime filter, an adaptive length stage, a multi-timeframe agreement check, a volatility band, and a conviction score that combines them into one number. It runs on **any symbol and any timeframe** — the price source and every optional reference feed are selectable in Settings.
It is a study/indicator (not a strategy). It does not place orders and does not claim any performance.
---
## Why these components are combined (mashup rationale)
A plain MACD only answers "is momentum up or down right now." On its own it has two well-known weaknesses: it whipsaws during sideways markets, and its fixed 12/26/9 lengths are arbitrary for any given symbol or timeframe. Each module below exists to fix a specific one of those weaknesses, and they are deliberately chained so the output of one informs the next:
1. **Normalized MACD core (L1)** — the MACD histogram is converted to a rolling **z-score**, so a reading of "+2" means the same thing on a low-priced FX pair, a high-priced index, or a 1-minute vs daily chart. Raw MACD values are not comparable across instruments; the z-score is. This is what makes the rest of the framework symbol-agnostic.
2. **Regime filter (L2)** — efficiency ratio + ADX + a volatility-clustering measure classify the market as **Trend / Range / Volatile**. This is used to decide whether a momentum signal should be trusted: MACD crosses are reliable in trends and noisy in ranges, so the regime gates and reweights the core signal rather than treating every cross equally.
3. **Adaptive length stage (L3)** — a dominant-cycle estimate (Ehlers homodyne) retunes the fast/slow/signal lengths toward the market's measured rhythm, instead of a static 12/26/9. You can switch this to a volatility-driven mode or fall back to fixed lengths. This directly addresses the "arbitrary lengths" weakness.
4. **Multi-timeframe confluence (MTF)** — the same MACD logic is evaluated on four higher timeframes, confirmed on bar close so it does not repaint. A single-timeframe cross is weak; agreement across timeframes is the filter.
5. **Volatility band + fade (L4)** — a volume-weighted standard-deviation band around price flags stretched conditions and band-rejection ("fade") setups, used as a mean-reversion counterweight to the trend logic.
6. **Conviction + vetoes (CON)** — all of the above are blended into a single **0–100 conviction score** with hard vetoes (e.g. counter-regime, timeframe disagreement, volatility spike). This is the part that turns several separate readings into one decision so you are not eyeballing five panels.
7. **Risk framework (RISK)** — once there is a signal, it derives an ATR stop, R-multiple targets, and a position-size suggestion from your account equity and risk %. This is shown as thin Entry / Stop / TP1 / TP2 lines on price.
In short: **L1 makes momentum comparable, L2 decides if it can be trusted, L3 tunes it, MTF confirms it, L4 adds a reversion check, CON scores it, and RISK frames it.** None of the layers is decorative — remove any one and the others lose context.
---
## How to use it
1. Add it to any chart and timeframe. It plots in its own lower pane; the trade levels and dashboard overlay on price.
2. Read the **dashboard header**: it shows the current action (BUY / SELL / HOLD / WAIT / FLAT) and the entry/stop.
3. Check **VERDICT + conviction**: a higher score with no active vetoes is a stronger context. Vetoes are listed explicitly so you can see *why* something is blocked.
4. Use **REGIME** to set expectations — trend-following signals make more sense in a Trend regime; the Stretch/Fade rows matter more in Range.
5. The **Entry / Stop / TP1 / TP2 lines** on price show the framework's risk levels for the current signal only; previous trade lines are removed automatically.
6. Optional feeds (reference symbol, volatility index, open interest, cross-asset) are **blank by default** — add your own symbols if you want those confluence inputs, or leave them off. The script degrades gracefully and tells you in the FEEDS row which are live.
---
## Settings worth knowing
- **Price source** — the series the whole engine runs on. Defaults to close; works on any market.
- **Optional reference feeds** — all blank by default and entirely optional, so the script is not tied to any one market or exchange. Enter symbols relevant to your instrument if you want them.
- **Adaptive length driver** — Homodyne (cycle-adaptive), Volatility, or Fixed.
- **Risk & sizing** — account equity, risk %, ATR stop multiple, and value-per-move; the size output is a suggestion only.
- **Dashboard theme** — Auto/Dark/Light; Auto flips colors to stay readable on white or black backgrounds.
- **Name / symbol / timeframe label** — kept on by default so the chart always identifies what is plotted.
---
## What makes it original
It is not a wrapper around a built-in MACD. The core is rebuilt to accept a *series* length (so it can be retuned every bar), normalized to a cross-asset z-score, gated by an explicitly classified regime, and merged with multi-timeframe state into a single weighted conviction score with named vetoes. The volatility-band fade logic and the dominant-cycle length adaptation are integrated into that same score rather than shown as separate, disconnected studies.
---
## Notes and limitations
- Confirm-on-close is on by default to avoid repainting; intrabar values can still update until the bar closes.
- The optional "Call/Put strike" row is a convenience hint derived from price and your strike interval only — **no options-chain data is read and no option P&L is implied.**
- Higher-timeframe and reference-feed requests depend on your data subscription; if a feed is unavailable the script disables the dependent input and continues.
---
## Disclaimer
This script is provided for educational and informational purposes only. It is a technical study, not investment, financial, or trading advice, and not a solicitation to buy or sell any instrument. It does not guarantee any result. Markets involve risk, including loss of capital. Indicator signals, levels, and the position-size suggestion are illustrative and must not be relied on as the basis for any trade. Always do your own research and consider consulting a licensed financial professional before trading. The author accepts no liability for any loss arising from use of this script. Past behavior of any indicator is not indicative of future results.
אינדיקטור

Volume Pressure MACDVolume Pressure MACD is a momentum indicator built on the MACD framework,
extended with three independent volume analysis layers that work together
to weight each signal by the quality and direction of volume participation —
not just its size.
The core idea: a price move backed by high volume is more meaningful than
the same move on thin volume. But volume size alone is incomplete —
a large-volume candle where price closes near the low tells a very different
story than one where price closes near the high. This indicator attempts to
capture both dimensions.
━━━━━━━━━━━━━━━━━━━━━━━━━━━━━━━━
BACKGROUND — WHY THREE VOLUME LAYERS?
━━━━━━━━━━━━━━━━━━━━━━━━━━━━━━━━
Standard MACD is calculated purely from price EMAs and ignores volume entirely.
Most volume-weighted MACD variants address this by multiplying the MACD value
by a simple volume ratio — more volume means a stronger signal. That approach
has a limitation: it treats all high-volume candles equally, whether the close
was bullish or bearish within the candle.
Volume Pressure MACD uses three separate volume inputs, each measuring a
different aspect of market participation:
LAYER 1 — VOLUME FACTOR
Measures how current volume compares to its recent average using a power
function (math.pow). The Volume Effect input controls the exponent, which
determines how aggressively above-average volume amplifies the MACD and how
much below-average volume dampens it. At 0.1 the effect is subtle and smooth;
higher values make the indicator more reactive to volume spikes. This layer
answers the question: how much volume is there?
LAYER 2 — VOLUME PRESSURE SCORE
This is the differentiating layer. For each bar, it calculates how much of
the total volume was spent by buyers versus sellers, based on where the
closing price lands relative to the bar's high-low range:
Buy Pressure = Volume × (Close - Low) / (High - Low)
Sell Pressure = Volume × (High - Close) / (High - Low)
Net Pressure = Buy Pressure - Sell Pressure
A candle that closes at its high assigns nearly all volume to buyers.
A candle that closes at its low assigns nearly all volume to sellers.
A doji near the midpoint splits volume roughly equally and contributes
minimal pressure in either direction.
The net pressure is normalized against its recent average and then applied
as a secondary weight on the MACD — clamped to a ±30% influence so it
modulates rather than dominates the output. This layer answers the question:
in which direction was volume being used?
LAYER 3 — VOLUME MOMENTUM
Compares a 5-bar volume average against a 20-bar volume average to determine
whether market participation is currently expanding or contracting. This does
not affect the MACD calculation itself — instead it drives the 4-tone histogram
coloring, giving a visual indication of whether the current MACD move is
occurring on growing or fading volume. This layer answers the question:
is volume increasing or decreasing?
━━━━━━━━━━━━━━━━━━━━━━━━━━━━━━━━
DYNAMIC ZONE SYSTEM
━━━━━━━━━━━━━━━━━━━━━━━━━━━━━━━━
One of the practical problems with MACD-based indicators is that fixed
overbought/oversold lines are meaningless across different assets and
timeframes. MACD values on a 5-minute chart of a low-priced asset can be
a fraction of a unit, while the same indicator on a weekly chart of a
high-priced asset can reach thousands. Static horizontal lines cannot
account for this.
The zone system in this indicator is fully dynamic:
- The upper boundary (Strong Bull) is set to the highest MACD value
over the Zone Lookback period, floored at zero
- The lower boundary (Strong Bear) is set to the lowest MACD value
over the Zone Lookback period, capped at zero
- The Weak/Strong boundary is calculated as a percentage of those
extremes, controlled by the Weak/Strong Split input
- All four zone boundaries automatically adjust as new bars print
and as you switch between timeframes or assets
Zone definitions:
Strong Bull — MACD is in the upper portion of its recent historical
range; momentum is extended to the upside
Weak Bull — MACD is positive but has not yet reached historically
elevated levels; upward momentum is present but moderate
Weak Bear — MACD is negative but within the lower portion of its
recent range; downward momentum is present but moderate
Strong Bear — MACD is deep in its recent historical range; momentum
is extended to the downside
The zones are color-filled between their boundaries and labeled at the
right edge of the chart for easy reading. Bull zones are drawn in green
tones and are mathematically prevented from crossing below zero. Bear zones
are drawn in red tones and are mathematically prevented from crossing above
zero, so the zone layout always remains logically consistent regardless of
MACD behavior.
━━━━━━━━━━━━━━━━━━━━━━━━━━━━━━━━
HISTOGRAM COLORING
━━━━━━━━━━━━━━━━━━━━━━━━━━━━━━━━
The histogram uses four distinct colors based on the combination of MACD
direction and volume momentum, allowing you to read both momentum and
participation at a glance:
Dark green — histogram above zero + volume momentum expanding
(positive momentum with growing participation)
Light green — histogram above zero + volume momentum contracting
(positive momentum but participation fading)
Dark red — histogram below zero + volume momentum expanding
(negative momentum with growing participation)
Light red — histogram below zero + volume momentum contracting
(negative momentum but participation fading)
The transition from dark to light (or vice versa) within the same direction
can be an early indication of momentum exhaustion or resumption.
━━━━━━━━━━━━━━━━━━━━━━━━━━━━━━━━
SIGNAL TYPES
━━━━━━━━━━━━━━━━━━━━━━━━━━━━━━━━
▲ BUY triangle (green, bottom)
MACD crosses above Signal line AND volume exceeds the average
by the Strong Volume Multiplier threshold. Both conditions must
be true simultaneously.
▼ SELL triangle (red, top)
MACD crosses below Signal line AND volume exceeds the average
by the Strong Volume Multiplier threshold. Both conditions must
be true simultaneously.
+ Cross marker on MACD line
All MACD/Signal crossovers, regardless of volume. Plotted directly
at the crossover price level on the indicator, not at the top or
bottom of the pane.
M↑ circle (teal) — Bullish divergence on the MACD line
Price makes a lower low while MACD makes a higher low,
detected using asymmetric pivot logic.
M↓ circle (fuchsia) — Bearish divergence on the MACD line
Price makes a higher high while MACD makes a lower high.
H↑ diamond (yellow) — Bullish divergence on the Histogram
Price makes a lower low while the histogram makes a higher low.
H↓ diamond (orange) — Bearish divergence on the Histogram
Price makes a higher high while the histogram makes a lower high.
Note: MACD line divergence and histogram divergence are calculated
independently. When both trigger together it may indicate a stronger
divergence condition. When only one triggers it can reflect early or
partial divergence development.
━━━━━━━━━━━━━━━━━━━━━━━━━━━━━━━━
INFO TABLE
━━━━━━━━━━━━━━━━━━━━━━━━━━━━━━━━
A live data table in the top-right corner displays four values
for the most recent closed bar:
Diff — the current distance between the MACD and Signal lines,
with a directional arrow showing which is above the other
Vol Factor — the current volume multiplier relative to the average.
Values above 1.0 indicate above-average volume (green);
values below 1.0 indicate below-average volume (red)
Vol Momentum — whether the 5-bar volume average is above or below
the 20-bar average (Rising / Falling)
Vol Pressure — the net directional pressure score for the current bar
(Buy / Sell / Neutral), based on the pressure calculation
described above
━━━━━━━━━━━━━━━━━━━━━━━━━━━━━━━━
INPUT REFERENCE
━━━━━━━━━━━━━━━━━━━━━━━━━━━━━━━━
Fast EMA — fast EMA length for classic MACD (default 12)
Slow EMA — slow EMA length for classic MACD (default 26)
Signal EMA — signal line EMA length (default 9)
MACD Smooth — additional EMA smoothing applied to the
volume-weighted MACD line (default 3)
Volume SMA Length — lookback for calculating average volume,
used in both Volume Factor and Pressure Score
Volume Effect — exponent controlling how strongly volume
scales the MACD; lower = smoother (default 0.1)
Strong Volume Multiplier — volume must exceed average × this value
for BUY/SELL triangles to appear (default 1.5)
Divergence Lookback — pivot bar count for divergence detection;
higher values find fewer but more significant
divergences (default 5)
Zone Lookback Bars — how many bars are used to define the dynamic
zone boundaries (default 100)
Weak/Strong Split — the percentage point within the zone range
where weak ends and strong begins (default 0.35)
━━━━━━━━━━━━━━━━━━━━━━━━━━━━━━━━
COMPATIBILITY
━━━━━━━━━━━━━━━━━━━━━━━━━━━━━━━━
Works on all asset classes including equities, cryptocurrency, forex,
commodities, and indices. Compatible with all timeframes. The dynamic
zone system and volume pressure calculation are designed to produce
meaningful output regardless of the absolute price or volume scale
of the instrument.
Pine Script v5. אינדיקטור

אינדיקטור

אינדיקטור

אינדיקטור

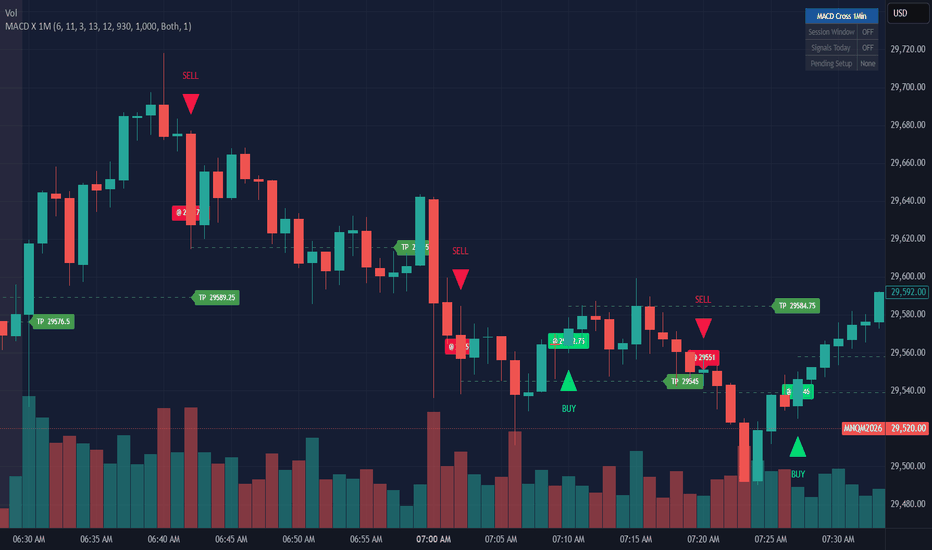
NTR: NASDAQ M1 - Trend RunnerNASDAQ M1 - MACD Trend Runner is a systematic trend continuation strategy specifically designed and optimized for the NASDAQ index on the 1-minute timeframe.
The strategy was developed around a simple observation:
Strong directional movements in NASDAQ often emerge after temporary pullbacks toward key moving averages while underlying momentum remains intact.
Instead of attempting to predict reversals or market turning points, the objective of this framework is to identify favorable re-entry opportunities within an existing bullish environment and allow winning positions to develop through dynamic trade management.
CORE CONCEPT
The strategy combines momentum, trend structure, market positioning, and risk control into a single execution model.
A valid setup requires:
• MACD bullish crossover.
• Momentum developing from lower MACD values.
• Price trading within a defined proximity to the 200-period moving average.
• Positive higher-order trend structure measured through the slope of the 50-period moving average.
• Time-of-day filtering to focus on periods of meaningful market participation.
This combination seeks to isolate moments where price temporarily retraces into trend support before resuming directional movement.
TRADE MANAGEMENT
Risk management is based on market structure rather than fixed stop distances.
Initial stop placement is determined using recent technical lows, creating a structure-based risk framework that adapts to changing market conditions.
Once a position develops sufficient unrealized profit, the strategy transitions into a trailing stop model designed to protect gains while allowing extended trend participation.
The goal is not to maximize win rate.
The goal is to capture asymmetric reward opportunities where a limited number of successful trades can outweigh multiple small losses.
KEY FEATURES
• MACD Momentum Confirmation
• SMA200 Trend Location Filter
• SMA50 Slope Validation
• Technical Structure-Based Stop Loss
• Dynamic Trailing Stop Management
• Session-Based Time Filter
• Daily Trade Limitation Logic
• Daily Profit Protection Logic
• Visual Diagnostic System
• Re-entry Detection Framework
DESIGN PHILOSOPHY
This strategy is intentionally specialized.
It was developed, tested, and refined specifically for NASDAQ price behavior on the 1-minute timeframe.
While certain concepts may be transferable to other instruments, the framework was not designed as a universal trading system.
The primary objective is to exploit recurring short-term trend continuation behavior observed within NASDAQ intraday market structure.
DISCLAIMER
This strategy is provided for educational and research purposes only.
Past performance does not guarantee future results. All trading involves risk, and users should perform their own analysis and validation before applying any strategy in live market conditions.
Created by @Peter_n_n אסטרטגייה

Modern Adaptive MACD [GBB]The MACD is half a century old. Gerald Appel published it in 1979 for daily charts of US equities, and the 12/26/9 default has been copied from one trading textbook to the next ever since. Nobody asks anymore why those three numbers should be the right ones for Bitcoin five-minute charts in 2026.
This is a rebuild. Four modernizations, each independently toggleable, all measured before being added. With every layer at default, the output is the textbook MACD. Switch them on one at a time to see what each one does on your own chart.
Layer 1: Adaptive periods
Instead of hard-coding 12 and 26, the indicator measures the market's dominant cycle in real time with an Ehlers homodyne discriminator and tunes the periods to it. In slow trends the periods widen and the indicator stops chopping you up with false crosses. When volatility picks up, periods tighten and it stays responsive.
Layer 2: Signal speedup
Classic MACD has two layers of lag. One in the EMAs that build the MACD line, another in the signal line on top of that. Most of the lag people complain about lives in the second smoother.
The first version of this layer used a zero-lag EMA. It didn't work. The zero-lag transform overshoots, and on strong moves the signal ends up ahead of the MACD, inverting the histogram color exactly when you most need the cross to be honest.
What shipped is the boring fix: a multiplier on the signal length. 1.0 keeps the classic 9-bar signal. Lower values speed it up. I measured the trade across 24 months of Bitcoin perpetual data. At a multiplier of 0.5, the indicator confirms a swing roughly 4 bars earlier and catches about 25% more swings than the classic. The cost is that the false-signal rate, whipsaw crosses with no real swing attached, roughly doubles, from 6% to 12.5% of all crosses. Whether that trade is worth it depends on what you do with the indicator. Pick the multiplier accordingly.
Layer 3: Normalization
A raw MACD reading of 15 means nothing on its own. On gold at $4500 it's small. On a penny stock it's enormous. Two normalization modes are available. "Percent of price" expresses the MACD as a percent of current price, which makes the reading comparable across instruments. "Z-Score" expresses it as standard deviations from its own recent average. Both are off by default. Turn one on if you trade more than one market, or if you want thresholds that don't need re-tuning every time you switch symbols.
Layer 4: Divergences
Regular and hidden divergences are detected automatically on confirmed pivots. Confirmed means they do not repaint. The line shows up a few bars after the pivot it marks, which is the honest cost of non-repainting confirmation. If anyone shows you a divergence indicator that draws lines in real time at the exact low, check what happens to those lines after the next few candles close.
Small triangles mark every MACD/Signal cross at the crossing point. Teal for bullish, red for bearish. Useful on busy charts where the cross moment is otherwise ambiguous.
What this is, and what it isn't
I tested every configuration of this indicator as a standalone trading system on 24 months of Bitcoin one-hour data. Always in market, long on bullish cross, flip on bearish. Every configuration lost money. Profit factor below 1 across the board. Negative Sharpe. Nothing statistically significant, before or after multiple-comparison correction.
This is what happens to any oscillator cross strategy run without a filter. The classic MACD shows the same result on the same test.
This is not a system. It's a timing tool. It tells you when momentum is shifting, earlier and more cleanly than the classic. Your job is to combine that with whatever else you trade on: higher-timeframe trend, market structure, key levels, your own setup logic. Without that filter, the cross alone is noise.
Settings
Source: close by default.
Classic periods: 12/26/9. Used when Adaptive is off.
Layer 1 (Adaptive): on by default. Min and max cycle bounds and the fast/signal ratios are exposed if you want to tune them.
Layer 2 (Signal speedup): multiplier 0.3 to 1.0. Default 1.0. Try 0.5 first.
Layer 3 (Normalize): None / Percent of price / Z-Score. Off by default. Z-Score has its own lookback length.
Layer 4 (Divergences): on by default, regular divergences only. Hidden divergences are off by default to keep the chart clean. Pivot left/right bars control how strict the swing detection is.
Display: cross markers on by default.
Alerts are wired for every cross (MACD/signal and zero-line) and every divergence type (regular and hidden, bullish and bearish).
Free. No paywall, no subscription, no gated features. If you find a configuration that works well on a specific instrument or timeframe, drop a comment.
Open-source script
In true TradingView spirit, the creator of this script has made it open-source, so that traders can review and verify its functionality. Kudos to the author! While you can use it for free, remember that republishing the code is subject to our House Rules.
GoodBadBitcoin
Also on:
Disclaimer
The information and publications are not meant to be, and do not constitute, financial, investment, trading, or other types of advice or recommendations supplied or endorsed by אינדיקטור

Tidal Divergence [JOAT]Tidal Divergence
Tidal Divergence is a composite divergence detector that lives in a sub-pane and projects high-conviction divergence visuals onto the price chart. The composite blends three volume-based oscillators — Money Flow Index, percentile-ranked Cumulative Volume Delta, and z-scored OBV rate-of-change — into a single normalized stream. Both regular and hidden divergences are detected. Persistent zones are drawn at divergence pivots, and zone mitigation is tracked with body / wick / rejection modes.
What makes it different
Single-oscillator divergence indicators give a single perspective. Tidal Divergence's composite triangulates three independent volume-derived oscillators so a divergence in the composite is supported by three volume readings instead of one.
Hidden divergences (continuation pattern: price higher low plus oscillator lower low for bull) are detected separately from regular divergences (reversal pattern), with distinct line styles on the price chart.
Each detected divergence creates a persistent demand or supply zone with optional FVG-confluence gating, dynamic alpha-by-age (zones fade as they age), and explicit mitigation logic (body / wick / two-close rejection variants).
A composite percentile envelope (5th to 95th percentile of the last 200 bars) is drawn behind the oscillator so absolute readings are easy to interpret in context.
How it works
MFI(14), daily-reset CVD then ta.percentrank(cvd, 100), OBV ROC z-score over a 20-bar mean / stdev. Three legs, each normalized to roughly the same scale.
Composite equals 0.40 times the normalized MFI plus 0.35 times the normalized CVD percentile plus 0.25 times the clamped OBV ROC z. Hull-smoothed and scaled to centi-percent.
Pivots are detected on the composite stream. A regular bull divergence requires a price lower low paired with a composite higher low within a 5-to-60-bar window. Hidden bull requires a price higher low plus composite lower low. Bear variants invert the conditions.
At each divergence pivot, two horizontal lines are drawn (edge equals lowest wick / highest wick. base equals lowest body / highest body), with a linefill between them, on the price chart via force_overlay=true.
Zone mitigation: body mode (close beyond edge) or wick mode (high/low beyond edge), optionally with two-close rejection requirement.
Optional FVG confluence requires a recent 3-bar Fair Value Gap before firing the divergence-final alert.
Reading the chart
In-pane : composite line tinted by direction with a smoothed signal line, gradient ribbon between them, breath-modulated zero midline, plus and minus 70 overbought / oversold thresholds, and the percentile envelope as an atmospheric backdrop.
In-pane divergence markers : regular divergences as solid connector plots, hidden divergences as broken (dashed-equivalent) connectors.
Cross-pane : price-to-price divergence connector lines on the price chart (regular solid, hidden dashed). Each line has a small REG BULL DIV 4520.50 or HID BEAR DIV label at the current pivot.
Cross-pane zone fills with age-graded transparency.
Zone edge price labels follow the right edge of each active zone.
Mitigation flash labels print at the bar where a zone is broken.
A cross-pane composite tint paints a soft mint / red background when the composite is clearly above or below plus or minus 30.
Signals
Regular bullish / bearish divergence
Hidden bullish / bearish divergence (continuation)
Bull / bear zone touch
Bull / bear zone mitigated
Bull / bear stack (three or more active zones plus a fresh regular divergence)
Bull / bear streak (composite above / below zero for N consecutive bars)
All gated on barstate.isconfirmed or barstate.ishistory. No future references. No lookahead_on.
Inputs
MFI : MFI length.
Divergence : pivot lookback left / right, detect hidden divergences toggle.
Zones : zone extreme length, max zone age, mitigation mode, allow-rejection toggle.
FVG Confluence : require FVG, FVG lookback bars.
Visual : bullish / bearish colors.
Cross-pane Visuals : divergence lines, divergence labels, zone edge labels, composite tint.
Dashboard : position, size.
How traders use this
Reversal entries : a regular bull divergence with the composite leaving an oversold extreme is a high-quality long setup, especially when accompanied by an FVG below the divergence price.
Continuation entries : a hidden bull divergence during a clearly trending bull regime is a structurally supported add-on entry on a pullback.
Zone trades : after a divergence prints, treat its zone as an active demand or supply level. Reactions to the zone (touch with rejection candles) are tradable. Mitigation invalidates the level.
Composite filter : only trade with the composite in agreement (composite above 0 for longs). The cross-pane tint helps you stay aligned without checking the pane.
Limitations
Divergence detection inherently lags the actual extreme by the right-pivot window.
Composite values are smoothed and need warm-up bars before they stabilize.
Cumulative Volume Delta is a tick-volume proxy, not true level-2 order flow.
A divergence is a probability, not a guarantee. Many divergences fail before completing their implied reversal.
Compatibility
Pine Script v6 open-source indicator (pane plus cross-pane). Any symbol with volume data. Cross-pane elements use force_overlay=true. No request.security calls.
Defaults
14-bar MFI, 14-left / 5-right pivot, body mitigation, FVG confluence off by default, mint / red palette, top-right medium dashboard. Enable FVG confluence to filter for higher-quality setups.
אינדיקטור

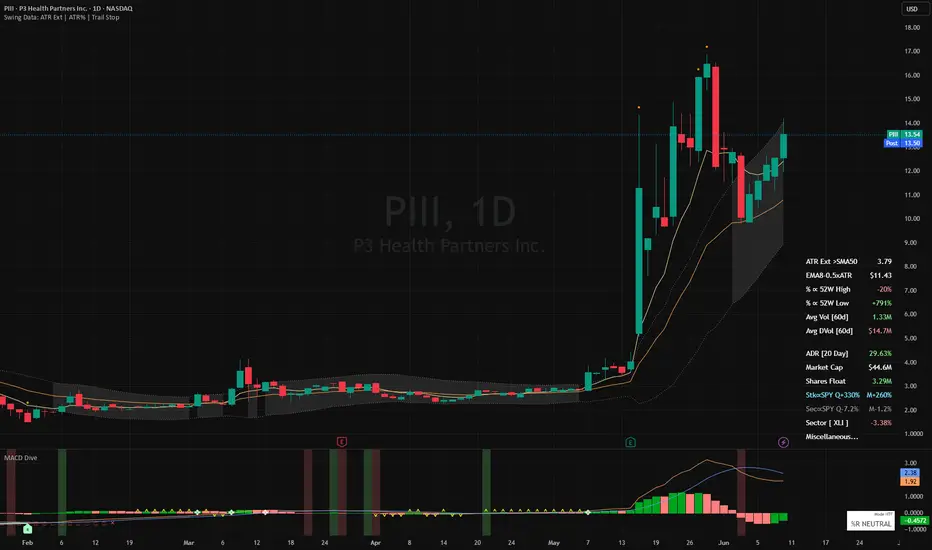
MACD Dive [TTM Squeeze | Dual Lock %R]Disclaimer : This indicator is not financial advice and is strictly for educational and informational purposes only. The metrics and signals provided herein (including momentum crosses, trend saturation state icons, and squeeze markers) are calculated based on historical market data and do not guarantee future performance. Trading stocks and commodities involves significant risk of loss. The user assumes full responsibility for all trading decisions and should always perform their own due diligence before executing trades.
MACD Dive is a multi-state momentum and volatility context engine. By layering momentum oscillation (MACD/PPO/MACD-V) with market stalemates (volatility squeeze) and trend exhaustion (Dual %R saturation), this suite transforms a standard MACD into a multi-dimensional 'No-Go' gatekeeper. This synergy is what gives the engine its edge: it actively blocks the trader from whipsawing in sideways chop or buying into a dying trend, highlighting high-probability market turns where momentum, volatility, and trend capacity perfectly align.
Standard oscillators have a scaling problem. This script lets you choose your engine:
MACD (Classic): Measures momentum in absolute dollars. Great for visual reactivity, but a "2.0" reading means something different on a $5 stock versus a $500 stock.
PPO (Percentage): Measures momentum in percentages. Standardizes the reading across all assets, making it ideal for fixed-rule algorithmic trading.
MACD-V (Volatility Normalized): This divides the MACD by the Average True Range (ATR). It measures momentum in "Units of Volatility," mathematically adapting to market chaos so that signals remain consistent across both different assets and shifting volatility regimes (quiet markets vs chaotic markets).
This suite includes a fully optimized divergence detection engine:
Regular Divergence (Solid Lines): Identifies Trend Reversals. Price pushes to a new extreme, but momentum fails to follow, signaling exhaustion.
Hidden Divergence (Dashed Lines): Identifies Trend Continuations (Slingshots). Price pulls back, but momentum fully resets, signaling a high-probability entry in the direction of the dominant trend.
Located in your chosen corner, the HUD provides an instant visual readout with hover tooltips for active Engine Mode, %R Fatigue state, Oscillator crossover validation, and Squeeze environment. Vertical background highlights in green or red represent filter-passed momentum crossovers, like the MACD bullish cross. Use the extensive inline tooltips in the indicator's settings panel for a comprehensive breakdown of every tunable parameter.
Adaptive Time-Frames & RSI Gatekeeper
Think of this as an automated gear shifter. When looking at lower timeframes (below a user-defined boundary, e.g. 1 hour), the engine automatically scales down to tight, agile lookback periods. When viewing high timeframes, it dials up to filter out noise.
Buying a bullish MACD cross when the RSI is already at 85 increases risk of buying the top when the tank is empty. The optional RSI Safety Filter acts as a strict ceiling/floor blocker. If momentum crosses upward but the asset is mathematically overbought, the indicator suppresses the background highlight. It prevents signals on MACD crosses that have no fuel left.
VOLATILITY ENGINE: BB-KC Squeeze Radar
Building on John Carter’s TTM Squeeze by mapping the contraction of Bollinger Bands inside Keltner Channels to identify market stalemates. The implementation here color codes between a Loose Squeeze (BB inside 1.5 KC) and a hyper-compressed Tight Squeeze (BB inside 1.0 KC) to show the staged intensity of the coiled spring.
While the market coils sideways, a 20-period Linear Regression calculates the trajectory of price deviation inside the bands. The directional bias is shown by customizable markers on the zero line (default ⌃ or ⌄). This reveals hidden institutional accumulation or distribution before the trigger is pulled. To bypass "dead money" risk, the script tracks the first clean candle close or intraday pierce outside the Keltner bounds following a squeeze, catching the expansion phase exactly as it starts.
Furthermore, it accounts for the "Disappearing Mark" phenomenon. Bollinger Bands expand instantly when price moves, causing standard squeeze signals to vanish 1-3 bars before the real breakout candle. This script uses a memory state to remember recent compression, firing a "squeeze release" marker (default ❖) the exact moment price closes outside the Keltner bounds. Trade the release, not the waiting room.
Note: While MACD Dive tracks this compression mathematically on its zero-line, you can see the actual physical boundaries of the breakout by pairing it with my companion Swing Data suite . Plotting its Keltner Channel at 1.5 multiplier over your price chart allows you to visually verify the exact moment the squeeze release mark is ignited.
SATURATION ENGINE: Dual-Lock %R and Momentum Rot
This suite tracks sustained trend maturity using a fast/slow dual Williams %R setup. The conceptual pairing of a fast and slow %R to identify overbought/oversold exhaustion is credited to upslidedown's excellent Trend Exhaustion indicator . I highly recommend applying their script to your chart if you want to visually learn how the two %R lines interact.
While upslidedown’s implementation offers multiple display modes to paint visual boxes and exhaustion zones directly over price action, the focus here is on the discrete icons for trend status at the top and bottom of the MACD pane: Ignition (·), Saturation (□), and Fatigue (×). This suite adapts native ta.wpr() math assuming the trader is already familiar with Dual %R mechanics. Specific "Sprint" and "Marathon" tuning guidance is provided in the tooltips: heavily smoothing the fast line to ignore intraday noise, while lightly smoothing the macro slow line to preserve its reach into extreme zones.
It also features one major addition: the Stall. While Dual %R tracks Price Location (confirming price is structurally pinned at the highs), it doesn't track Velocity (confirming energy is sustained). To solve this, a Stoch RSI "Rot" detector runs quietly inside the saturation state. If price continues to float at the highs but internal velocity drops below a critical threshold, the script overlays a Stall marker (•). Designed as a "one-shot" early warning, it fires only on the first detection per trend saturation leg to prevent chart clutter. This differentiates a strong trend lock from a rotting lock, warning us that the move is running on fumes: giving us the exact cue to tighten stops, trim into parabolic strength, and strictly avoid adding new size.
BACKTESTER READY
Out-of-the-box compatibility with a comprehensive built-in README guide is available directly inside the settings menu. For traders who prefer a "Diamond Hands" approach, the indicator fully maps to Jason5480's TTS Framework convention, outputting strict integer states (1, -1, 2, -2) to hold full position size until the trailing macro baseline completely fractures. My personal backtester, Cosmos Signal Commander (which may be released to the public in the future), broadcasts a composite float signal capable of managing active trade positioning. It tracks entries, hard stops, and partial take-profits (swapping the trailing stop from tight to a wide "runner" buffer upon hitting extended ATR targets).
PERFORMANCE OPTIMIZATION
O(1) Memory States: Replaced lag-heavy ta.barssince() and 50-bar for loops in the Divergence engine with O(1) var state trackers.
String Caching: HUD table strings are built once in the global var scope to prevent constant memory allocation and garbage collection lag.
UI Mutation: The HUD uses table.cell_set_* to alter data dynamically, bypassing the stutter caused by destroying and redrawing tables on every tick.
Native C++ Backend: Replaced custom highest/lowest math arrays with native ta.wpr() functions for the %R engine to maximize computation speed.
Ghost State Resets: When switching the backtester logic to "Long Only" mode, the engine actively hunts and kills lingering short-memory variables so they don't inadvertently suppress valid long signals.
אינדיקטור

אינדיקטור

VWAP SD2 Reversion (Long)A patient, momentum-confirmed dip buyer that fades stretches below the session VWAP and targets a return to the mean.
The idea
Intraday price tends to oscillate around its volume-weighted average price (VWAP). When price extends a full two standard deviations below the session VWAP, it is statistically stretched and often springs back toward the average. This strategy is built to capture that snap-back, but it deliberately does not buy the dip blindly. A stretched market can keep falling, so the strategy waits for two independent momentum tools to confirm that the down-move has actually turned before it commits.
The result is a sequential, time-boxed setup: a volatility filter, a price stretch, and then two momentum confirmations that must all line up within a short window. If they do not, the setup is discarded and the strategy stays flat.
How a trade is built
Each long requires the following to occur in order, with every step happening at or after the initial dip and within the confirmation window:
Volatility filter: the lower 2-SD band must sit at least a minimum distance from VWAP (default 10 pips). This skips quiet, low-range conditions where there is little room to revert and the costs would dominate.
Step 1, the stretch: price closes below the lower 2-SD band.
Step 2, RSI confirms: RSI recovers back above its level (default 30), confirming the oversold push is fading.
Step 3, MACD confirms: the MACD line turns bullish over its signal line (or over zero, if you prefer), confirming momentum has flipped up.
Entry: a market long is taken on the bar that completes Step 3.
Why a state machine
Real momentum turns are messy. RSI and MACD often flip within a bar or two of each other, and sometimes on the very same bar. A naive rule that demands three separate single-bar crossovers in strict order misses most of these clusters. This strategy instead tracks the setup through a small state machine that:
anchors both confirmations to the first dip bar, so a momentum cross that happened before the dip cannot be borrowed to validate the trade;
accepts confirmations that arrive in either order or on the same bar, as long as both are recent and post-dip;
keeps the setup alive while price continues to hug the band, and expires it cleanly once the confirmation window passes without a trigger.
A Strict toggle is provided for those who want the original behaviour, where each step must be a fresh crossover on a later bar.
How the exit works
Because the thesis is reversion to the mean, the natural profit target is the mean itself. By default the take-profit is the live VWAP, re-evaluated every bar so it tracks the line as it moves, set a small buffer in front so the order fills on the approach rather than waiting for an exact touch. A minimum-profit floor prevents a falling VWAP from dragging the target back through the entry.
A fixed-pip take-profit mode is available as an alternative. The stop-loss is a fixed pip distance below entry in both modes. Targeting the mean rather than a fixed number of pips tends to produce variable, often larger winners, which also dilutes the impact of fixed spread costs.
Settings
Setup
SD band multiplier — standard-deviation width of the bands (default 2.0).
Min VWAP to SD2 distance — the volatility filter, in pips (default 10).
Confirmation window — how many bars each step has to confirm (default 5).
Strict cross — require a fresh crossover on a bar after the prior step.
RSI and MACD
Standard RSI length and cross level.
Standard MACD fast, slow and signal lengths, with an optional zero-line cross instead of a signal-line cross.
Risk and pips
TP at VWAP, with a front-run buffer and a minimum-profit floor, or a fixed-pip take-profit.
Stop loss in pips.
Auto pip size (mintick × 10), which resolves correctly for 5-decimal FX and 3-decimal JPY pairs, plus a manual override.
Reading the chart
Orange line: session VWAP (the reversion target).
Red and green lines: the lower and upper 2-SD bands.
Markers: 1 marks a close below the band, 2 marks the RSI confirmation, and the triangle marks the MACD confirmation and entry trigger.
Intended use
This is an intraday strategy, developed and tuned on 5-minute FX majors, with a daily VWAP anchor that resets each session. In the author's testing it has behaved most consistently on AUDUSD, and it is also designed for pairs such as EURUSD and USDJPY. As always, behaviour varies by pair, broker feed and period, so test it on your own data before relying on it.
On backtest settings: tight intraday targets are sensitive to execution costs. Before drawing conclusions from the Strategy Tester, set a commission and slippage that match your broker, and choose a position size that reflects the risk you would actually take. Results shown with unrealistic costs can look far better than anything achievable live.
This script is published for educational and research purposes only and is not financial advice or a recommendation to trade. Backtested and hypothetical results do not guarantee future performance, and trading leveraged instruments such as FX carries substantial risk of loss. You are responsible for your own testing, risk management and decisions. אסטרטגייה

Crypto Ultimate Indicator v2═══════════════════════════════════════════════
CRYPTO ULTIMATE INDICATOR (CUI)
═══════════════════════════════════════════════
A multi-layer confluence system for crypto traders. Stacks 12+ independent technical layers — trend, momentum, volume, regime, multi-timeframe bias, and Smart Money Concepts — and fires Buy/Sell signals only when enough of them agree. Every signal comes with a confidence score, three take-profit levels, position size recommendation, and live outcome tracking.
Built for 4H and Daily crypto charts. No proprietary "secret sauce" — every component is documented and every input is exposed.
━━━━━━━ WHY THIS EXISTS ━━━━━━━
Most multi-indicator scripts stack correlated trend filters (more EMAs, more oscillators) and call it "confluence." That just adds the illusion of agreement without adding independent information.
CUI's filter stack is built from genuinely different signal sources, so when they align, that alignment carries real weight:
• Trend regime — HMA + Supertrend + EMA Ribbon
• Momentum — RSI with proper pivot-to-pivot divergence
• Volume flow — body-weighted Volume Delta + CVD divergence
• Volatility state — Bollinger squeeze + squeeze-release timing
• Market structure — composite of ADX, Choppiness Index, BB-width percentile
• Multi-timeframe — weighted Daily / Weekly / Custom HTF (all offset, no repaint)
• Liquidity & gaps — Fair Value Gaps + Liquidity Sweep detection
• External context — optional BTC trend filter for alt trading
A Buy or Sell only fires when the relevant subset of these align. A built-in "Why-Not" diagnostic table shows you exactly which filter is blocking a near-signal at any moment — turning the indicator into a tunable system rather than a black box.
━━━━━━━ CORE FEATURES ━━━━━━━
TREND & MOMENTUM
▸ Hull Moving Average (configurable length)
▸ Supertrend with ATR factor
▸ 5-EMA Ribbon (8/13/21/34/55) with stacking score
▸ RSI with consecutive-pivot divergence detection
▸ MACD and Stochastic RSI (data window)
VOLUME
▸ Body-weighted Volume Delta (not naive close-position)
▸ Cumulative Volume Delta (CVD)
▸ CVD divergence at confirmed pivots
VOLATILITY & REGIME
▸ Bollinger Bands with squeeze detection and release timing
▸ Composite regime classifier (ADX × CHOP × BB-width)
▸ Background tint for trending vs ranging states
▸ Regime transition labels
SMART MONEY CONCEPTS
▸ Fair Value Gap zones (bullish and bearish)
▸ Liquidity Sweep detection
MULTI-TIMEFRAME
▸ Daily / Weekly / User-defined custom HTF
▸ Weighted confluence score (D 1.0x + W 1.5x + Custom 0.75x)
▸ Optional HTF pivot-based S/R lines
BTC CONTEXT (for alt traders)
▸ Optional BTC trend filter
▸ Relative strength vs BTC
SIGNAL ENGINE
▸ 0-100 confidence score
▸ Configurable minimum confidence threshold
▸ Auto-tune presets (Aggressive / Balanced / Conservative / Custom)
▸ Confirmation bar requirement
▸ Minimum spacing between signals
TRADE MANAGEMENT
▸ Three take-profit levels (TP1/TP2/TP3) with configurable ATR multipliers
▸ Custom % allocation per target
▸ Adaptive SL/TP — different distances in trending vs ranging conditions
▸ Break-even stop activation after TP1
▸ Chandelier ATR trailing stop on runner portion
▸ Position size calculator (account size × risk % × confidence multiplier)
LIVE TRACKING & DIAGNOSTICS
▸ Main dashboard with all current state
▸ Signal log table — last N trades with live TP/SL outcomes
▸ Why-Not diagnostic — which filter is currently blocking each direction
▸ Regime stats — win rate broken down by trending vs ranging
ALERTS
▸ 15+ classic alertcondition triggers
▸ Optional JSON webhook payload for bot integration
━━━━━━━ HOW A BUY SIGNAL FIRES ━━━━━━━
All of the following must be true on the signal bar:
1. HMA trending up
2. RSI above 50
3. Volume delta positive
4. EMA Ribbon score ≥ +3 (at least 4 of 5 aligned bullish)
5. Supertrend bullish
6. HTF confluence score ≥ +1.5
7. Confidence score ≥ user minimum
8. BTC trend bullish (if BTC filter enabled)
9. Price not inside opposing FVG zone (if FVG filter enabled)
10. Market not in strong ranging mode
11. Price more than 0.5 ATR from upper resistance zone
12. Candle body > 50% of range
13. Minimum bars elapsed since last signal
14. Confirmation bar (if enabled)
A Sell signal requires the inverse. On 4H BTC expect roughly 1-3 signals per week in normal conditions. If you see fewer, drop the confidence floor or switch to the Aggressive preset.
━━━━━━━ RECOMMENDED USE ━━━━━━━
▸ Primary: 4H on BTC/USDT, ETH/USDT, and majors
▸ Also works: Daily, 12H, 8H
▸ Use caution below 1H — noise increases, news spikes can trigger wicks
▸ Low-liquidity alts: bump ATR period to 21
WORKFLOW
1. Start on the Balanced preset
2. Watch the dashboard and Why-Not panel for a few sessions
3. Adjust the confidence floor based on signal frequency
4. Enable Regime Stats after chart history accumulates
5. For bots: enable JSON webhook alerts, route via "Any alert() function call"
━━━━━━━ REPAINT DISCLOSURE ━━━━━━━
Full transparency on what does and doesn't repaint:
▸ HMA, Supertrend, EMA Ribbon: repaint on the developing current bar (use bar-close confirmation for live trading)
▸ HTF confluence (D/W/Custom): all use offset — fetch last closed HTF bar only — NO intra-period repaint, NO lookahead
▸ RSI and CVD divergence labels: plotted at confirmed pivot bar (5 bars after the actual pivot). Do NOT appear and disappear.
▸ FVG zones: drawn on confirmation bar of the 3-bar gap pattern. Do not repaint once drawn.
▸ Liquidity sweeps: detected on bar close
▸ Trade outcomes (signal log): evaluated on each closing bar
▸ Regime transition labels: confirmed on bar close
━━━━━━━ HONEST LIMITATIONS ━━━━━━━
▸ This is a decision-support tool, not a complete trading system. Risk management, position discipline, and execution matter more than any indicator.
▸ Signal outcomes in the Regime Stats table are based on bar-close evaluation. Real-fill slippage is not modeled.
▸ Volume Delta is approximated from candle structure, not true tick-level bid/ask (TradingView doesn't expose that without premium feeds).
▸ FVG and liquidity sweep are simplified interpretations of those concepts — pure SMC purists may prefer dedicated tools.
▸ The regime classifier is a heuristic composite. It works well on liquid crypto pairs but can lag at sharp inflection points.
▸ Past performance does not predict future results.
━━━━━━━ SETTINGS OVERVIEW ━━━━━━━
The script has many inputs, grouped by function. For first-time users, the most important groups are:
▸ Preset & Theme → pick Balanced to start
▸ UI Sizing → table text and label sizes
▸ Signal Engine → set Minimum Confidence Score
▸ Tiered Exits → TP/SL multipliers and % allocation
▸ Position Sizing → account size and risk per trade
▸ Alerts & Webhooks → enable JSON for bot trading
Default state shows a clean chart: HMA, Supertrend, BB, regime tint, signal labels, plus three tables (dashboard, signal log, HTF panel). Everything else is one toggle away — EMA Ribbon, FVG boxes, ATR zones, HTF S/R lines, CVD divergence labels, sweep markers, Why-Not diagnostic, Regime Stats.
━━━━━━━ WHAT'S NOT INCLUDED ━━━━━━━
▸ Full strategy() backtest — this is an indicator(). A companion strategy script may be released separately.
▸ Funding rate / open interest overlays — require specific tickers not universally available
▸ Chart pattern recognition (H&S, wedges, etc.)
━━━━━━━ CREDITS ━━━━━━━
Built on Pine Script v6. Uses TradingView built-ins: ta.supertrend, ta.dmi, ta.bb, ta.macd, ta.rsi, ta.pivothigh, ta.pivotlow, ta.valuewhen. Choppiness Index, CVD, FVG detection, liquidity sweep logic, regime classifier, confidence scoring, trade tracking, and confluence weighting are custom implementations.
═══════════════════════════════════════════════
אינדיקטור
אינדיקטור

אינדיקטור
Tetrad Elektro Community v1.0Tetrad Elektro Community is an open-source educational strategy built around Bollinger Band exhaustion, RSI confirmation, and optional bearish divergence logic.
The strategy is designed to identify stretched market conditions where price may be overextended relative to its recent range. Long setups look for price pressing into the lower Bollinger Band with oversold RSI confirmation. Short setups look for upper-band exhaustion, elevated RSI, or bearish divergence where price makes a new high but RSI or MACD fails to confirm.
Suggested use:
This strategy is best studied on the 30-minute or 45-minute chart. It was designed primarily for crypto markets and may work across several liquid crypto assets such as BTC, ETH, SOL, and DOGE. It may also be worth researching on high-liquidity stocks or ETFs, but users should always test each asset individually before relying on any result.
Suggested mode selection:
- Use Long Only in bullish environments.
- Use Short Only in bearish environments.
- Use Long & Short in ranging or two-sided environments.
The strategy includes:
- Bollinger Band mean-reversion logic
- Main RSI and fast RSI filters
- Optional bearish divergence using RSI/MACD confirmation failure
- Optional stop loss
- Optional time stop
- Optional flat-first execution behavior
- Clean chart visuals with optional labels and signal markers
This public community version is intentionally simplified. It does not include Tetrad’s private MLTT/RORO risk engine, execution controller, portfolio allocator, live-routing infrastructure, optimized production parameters, or machine-learning overlays.
This is not financial advice. Backtests are hypothetical and may differ from live execution. Always test on your own market, timeframe, exchange, fee assumptions, and risk model before using any strategy. אסטרטגייה

CVD Divergence LiteCVD Divergence Lite:
Cumulative Volume Delta with regular bullish/bearish divergence detection.
Green bars = accumulation. Red bars = distribution.
B/S labels mark divergence signals where CVD disagrees with price — the classic smart-money footprint.
🟢 B = Price making lower low, CVD making higher low (bullish divergence — buyers accumulating)
🔴 S = Price making higher high, CVD making lower high (bearish divergence — distribution at highs)
This is the Lite version. The Pro version adds:
• Hidden divergence (bullish + bearish) — continuation signals
• 3 CVD calculation methods (Direction, Volume-Weighted, Close Location)
• Phone push alerts via TradingView — 4 alert types + combined
• Adjustable sensitivity, pivot bars, and cooldown
• Full color customization
→ Pro version is Invite-only
→ Read the review of the Pro version at theindicatorlab.com
## Category
Volume / Divergence
## Compatible Markets
Stocks, Crypto, Forex, Futures, Indices
## Compatible Timeframes
All (optimized for 15m–4h) אינדיקטור

MACD Slope & Swing MonitorThis script is not just another MACD. It is a highly specialized momentum engine designed to quantify trend exhaustion and visualize structural pivots, making it the perfect tool for trading advanced concepts like the "Anti-Setup" (popularized by Linda Raschke) and Hidden Divergences.
While standard MACD shows you the current momentum, it often lags during complex corrections (like Elliott Wave 4th waves or Flat corrections). This indicator solves this by introducing real-time Slope Quantification and past Swing Pivot Detection.
Key Features & The Logic Behind the Mashup:
Dynamic Slope Quantification: Calculates the exact rate of change (Slope) for both the MACD and Signal lines over a user-defined lookback period. This allows traders to spot momentum decay before an actual crossover occurs. The exact values are displayed on a clean, dynamic label that tracks the current bar.
Structural Swing Detection (Pivots): Uses a 5-bar left/right lookback to plot Swing Highs and Lows directly on the oscillator. By locking these markers to the top and bottom of the pane, the script keeps the MACD lines perfectly clean. This is crucial for instantly identifying Hidden Divergences against previous structural peaks.
Custom MA Engine: Unlike standard built-in MACD, this script allows you to independently change the Moving Average type (SMA, EMA, WMA, RMA) for both the Oscillator and the Signal line. (e.g., using EMA for the oscillator and SMA for the signal to refine trade timing).
How to Use:
Trend Continuation (Hidden Divergence): Look for price to make a Lower High / Higher Low, while the MACD Swing markers show a Higher High / Lower Low.
The "Anti" Trigger: Wait for the MACD Slope to sharply reverse back toward the Signal line in the direction of the primary trend. The real-time label will confirm the momentum shift mathematically before the visual hook forms. אינדיקטור

אינדיקטור

Momentum Matrix [LIVE]### Introduction
Welcome to Momentum Matrix , a multi-dimensional momentum and volatility confluence engine. This indicator combines Linear Geometry (Moving Average Slope) with Derivative Volatility Breakouts (Bollinger Bands applied to a custom MACD line) to create a rigorous, two-step verification system designed to identify high-probability trend expansions while filtering out low-volume market noise and chop.
### How It Works
1. **The Core Trend (MA Angle):** The script normalizes a moving average using an Average True Range (ATR) calculation to determine its precise geometric angle. It flags the trend as bullish or bearish only when the moving average breaks past a user-defined threshold (e.g., 6°), turning flat ranges grey (**No Trade Zone**).
2. **The Volatility Trigger (MACD BB):** A custom MACD line is tracked natively against standard deviation Bollinger Bands. When momentum expands, the MACD line punches outside the bands.
3. **The Confluence Signal:** When **both** systems simultaneously turn bright green or bright red, the script prints a distinct **Confluence Dot** on the zero line, signaling an institutional momentum breakout.
---
### Key Use Cases
*🚀 **Squeeze Play & Volatility Breakout Entries***
Entering the trade on the first Confluence Dot catches the absolute beginning of a macro trend expansion.
*📈 **High-Probability Trend Following***
As long as the lines and histograms stay locked in solid green or red, it proves that the velocity of the move is being actively sustained by volume.
*⚠️ **False Breakout Filter (Staying Out of Chop)***
Many traders lose money by buying a breakout on the price chart, only for it to immediately reverse. This indicator acts as a gatekeeper. If price makes a sudden spike upward, the MACD might briefly flash green. However, if the broader Moving Average Angle remains flat and stuck in the "No Trade Zone," the indicator refuses to print a buy dot, preventing FOMO entries.
*⏱️ **Scalping with the Live Delta Dashboard***
If an asset is moving up but the live angle change starts decaying (e.g., dropping from +2.5° down to +0.2°), it signals a hidden momentum loss—alerting you to take profits before the price action actually stalls out.
---
### Key Features
* **Adaptive MA Selection:** Swap between EMA, SMA, HMA, LSMA, ALMA, and McGinley.
* **Built-in Volatility Filter:** Bollinger Bands track the MACD line directly to confirm momentum expansion.
* **Live Statistics Table:** View current trend angles and live changes on every tick.
* **Strict Non-Repainting Signals:** Confluence triggers confirm at the close of the bar to ensure historical data accuracy.
---
### Credits & Acknowledgments
This script is a customized confluence engine built upon the excellent open-source work of two brilliant developers in the TradingView community. Special thanks to:
* ** @Mango2Juice ** for the foundational logic behind the *Angle of Moving Averages* script.
* ** @Algokid ** for the original concept and design of the *AK MACD BB indicator*.
This version modernizes the calculations into Pine Script v5 , introduces a dynamic real-time tracking dashboard, and establishes a strict non-repainting mathematical handshake between both metrics. אינדיקטור

Harbor Reversal Ledger [JOAT]Harbor Reversal Ledger
Introduction
Harbor Reversal Ledger is an open-source reversal timing indicator that combines completed higher-timeframe candle context with confirmed local RSI divergence.
The objective is not to predict turning points early.
The objective is to wait for enough evidence that a reversal thesis is becoming structurally credible.
Many reversal tools repaint because they depend on unfinished higher-timeframe candles or unconfirmed pivot comparisons.
Harbor Reversal Ledger avoids that by:
requesting completed higher-timeframe candles only
confirming RSI pivots before evaluating divergence
scoring confluence from multiple independent ingredients
projecting higher-timeframe structure onto the execution chart
rendering a timing ledger in its own pane
Core Concepts
1. Completed Higher-Timeframe Context
The script requests prior higher-timeframe candles rather than reading the currently forming candle.
This keeps the higher-timeframe pattern engine stable and non-repainting.
2. Candle Pattern Recognition
Bullish and bearish engulfing patterns can be enabled, and pin-bar style rejection patterns can also be used.
These patterns contribute directional context, not automatic entries.
3. Confirmed RSI Divergence
Local price and RSI pivots are both confirmed using left/right pivot logic.
Only after the pivots are locked does the script compare price progression against RSI progression to determine bullish or bearish divergence.
4. Distance-to-Extreme Scoring
Reversal evidence becomes more meaningful when price is still close to a recent extreme.
The confluence engine therefore includes distance-based scoring relative to a configurable lookback.
5. Projection and Confluence Zones
Completed higher-timeframe candles can be projected forward on the execution chart, while divergence events can create local confluence zones when the evidence stack is strong enough.
Features
Completed HTF candle projection: prior higher-timeframe range and body projected onto the chart
HTF pattern engine: bullish and bearish engulfing and pin-bar style patterns
Confirmed RSI divergence: bullish and bearish divergence using pivot confirmation
Dual-pane logic: overlay objects explain price context while the pane acts as a reversal timing ledger
Confluence scoring: combines HTF pattern, local divergence, and distance-to-extreme logic
Premium/discount context: position of price relative to the HTF midpoint is plotted
Confluence zones: optional chart zones highlight stronger bullish or bearish reversal regions
State-based RSI coloring: RSI line color reflects the current net confluence
Top-right dashboard: summarizes pattern state, divergence state, confluence, and location context
Non-repainting design: no unfinished HTF candles and no unconfirmed pivot divergence
Input Parameters
Higher Timeframe Context
HTF Candle Source
Enable Engulfing Patterns
Enable Pin Bar Patterns
Project Completed HTF Candle
Projection Offset Bars
Projection Width Bars
Execution Divergence
RSI Length
Pivot Left
Pivot Right
Show Divergence Lines
Show Confluence Zones
Confluence Engine
Distance Lookback
Distance Weight
Pattern Weight
Divergence Weight
Display
Show RSI State Fill
Dashboard Position
Dashboard Size
How to Use This Indicator
Step 1: Start With the Higher-Timeframe Projection
Use the projected completed candle to understand whether the larger reference bar is signaling rejection, acceptance, or neutrality.
Step 2: Wait for Local Divergence Confirmation
The script intentionally waits for confirmed pivots.
That delay is a feature, not a flaw.
Step 3: Read the Net Confluence, Not Just RSI
The pane is not meant to be treated like a normal RSI oscillator.
Its color and context matter because they reflect the broader reversal evidence stack.
Step 4: Use Confluence Zones as Areas of Interest
Zones identify places where the higher-timeframe context and local divergence align.
They are not guaranteed turning points.
Step 5: Respect the Directional Imbalance
If the higher-timeframe candle context is strongly bearish, a minor bullish divergence alone may not be enough to justify a reversal thesis, and vice versa.
Indicator Limitations
Confirmed divergence necessarily appears after the pivot forms, which introduces intentional timing delay
Higher-timeframe pattern quality depends on the selected timeframe and instrument behavior
RSI divergence can persist without immediate reversal in strong directional markets
Projection objects are context tools, not price targets
Originality Statement
Harbor Reversal Ledger is designed as a confluence ledger rather than a single-pattern reversal marker.
Its distinguishing structure comes from pairing completed higher-timeframe candle analysis, confirmed divergence, distance scoring, projected context, and pane-based confluence visualization into one disciplined, non-repainting timing framework.
Disclaimer
This indicator is provided for educational and informational purposes only.
It is not financial advice and should not be used as a standalone reason to enter or exit a market.
All reversal readings are based on historical chart data and can fail, especially in strongly trending or event-driven conditions.
Use proper risk management and independent judgment.
אינדיקטור

אסטרטגייה