אסטרטגייה

EMA Color Plus [ChartWhizzperer]EMA Colour Plus PRO | Momentum Guard by ChartWhizzperer
The clinical approach to momentum filtering.
Moving averages are the foundation of trend analysis, but standard EMAs are inherently flawed. They fall victim to market noise, consume valuable indicator slots on your chart, and frequently suffer from toxic higher-timeframe repainting.
As a system architect, I engineered the EMA Colour Plus to eradicate these inefficiencies. This open-source script is not just a moving average; it is a multi-dimensional momentum guard designed for uncompromising precision and chart hygiene.
CORE ARCHITECTURE (Why this filter outperforms standard EMAs):
Repaint-Proof MTF Protocol: When utilising the higher-timeframe (HTF) functionality, the algorithm strictly locks onto confirmed historical closures. There are no real-time illusions and no retrospective repainting. The line is carved in stone.
The Slot-Saver Integration: Free users are heavily restricted by indicator limits. This script integrates a dynamic EMA, Bollinger Bands, RSI momentum gating, and ROC filtering into a single, highly optimised mathematical unit.
Data-Vacuum Failsafe: Standard Volume Weighted Moving Averages (VWMA) crash when broker feeds temporarily drop volume data (common in Forex). This script features a custom fallback injection that simulates baseline volume during data vacuums, ensuring the indicator never disappears from your chart.
Mathematical Symmetry: Momentum thresholds (like RSI) are perfectly mirrored against the median, reducing input clutter while maintaining strict logic for both bullish and bearish state transitions.
Examine the source code: You will find clean, single-line compiled logic and a flawless security protocol for MTF data retrieval.
However, an EMA does not pull the trigger. Ask me for more!
Disclaimer
Signals and alerts are provided for informational purposes only and do not constitute financial advice or a recommendation to buy or sell.
Trading involves substantial risk and may result in the total loss of capital. Execution via third-party tools may differ from alerts. Past performance is not indicative of future results. אינדיקטור

Case's Modern MACD-Volatility Normalized MomentumCase's Modern MACD-Volatility Normalized Momentum
Based on the award-winning academic research of Alex Spiroglou, CFTe, MSTA — NAAIM Founders Award & Charles H. Dow Award (2022)
📄 Original paper: SSRN #4099617
What Is MACD-V?
The standard MACD has a fundamental flaw: its raw values are denominated in price, making them incomparable across assets, timeframes, and volatility regimes. A MACD reading of 5.0 means something completely different on NVDA vs. SPY vs. BTC.
MACD-V solves this by dividing the MACD by ATR × 100, producing a volatility-normalized momentum oscillator that is:
Comparable across all tickers and timeframes
Centered around fixed, meaningful thresholds (±50, ±150, ±200)
Regime-aware — you know exactly where you stand in the momentum lifecycle at all times
This script extends the core MACD-V framework with a full Momentum Lifecycle Road Map, Trend Regime Filter, Regime-Aware Opportunity Zones, Acceleration (2nd Derivative), and several supporting systems.
Core Components
1. MACD-V Line
The volatility-normalized momentum line. Default parameters: Fast EMA 12, Slow EMA 26, ATR 26 — the same as classic MACD, but normalized. The line is color-coded by momentum state (see Momentum Lifecycle below).
2. Signal Line
A 9-period EMA of MACD-V. Crossovers and the MACD-V's position relative to the signal define sub-states within each momentum zone.
3. MACD-VH Histogram
The difference between MACD-V and its Signal Line. Color-coded by direction and growth:
Teal (growing positive) — bullish momentum expanding
Light teal (shrinking positive) — bullish momentum fading
Light red (rising negative) — bearish momentum fading
Red (falling negative) — bearish momentum expanding
Extreme histogram readings beyond ±40 signal short-term overextension.
4. Acceleration (2nd Derivative)
A smoothed EMA of the bar-to-bar change in MACD-V, scaled for visibility. Think of it as the rate of change of momentum. When acceleration is positive (teal), momentum is building. When negative (red), it's waning — even if the MACD-V line itself is still rising. This is particularly powerful for timing entries and exits.
The Momentum Lifecycle Road Map
MACD-V's fixed thresholds carve price momentum into 8 distinct states, each with a precise behavioral expectation:
StateMACD-V Rangevs. SignalColorInterpretationRisk (Overbought)> 150—🔴 RedMomentum extended; risk of reversal or correctionRallying50 to 150Above🟢 GreenStrong bullish momentum with trend confirmationRetracing50 to 150Below🟠 OrangeBullish zone but losing momentum; cautionRanging (Bullish)-50 to 50Above🩵 TealConsolidation with bullish biasRanging (Bearish)-50 to 50Below🔴 RedConsolidation with bearish biasRebounding-150 to -50Above🟢 Light GreenRecovering from oversold; potential reversalReversing-150 to -50Below🟣 PurpleBearish zone, still decliningRisk (Oversold)< -150—🔴 RedMomentum deeply negative; exhaustion risk/opportunity
A status table in the top-right corner always shows the current state, trend regime, opportunity zone, and acceleration direction — no squinting at the chart required.
Trend Regime Filter (200 EMA Slope)
A row of dots plotted below the oscillator, colored by the slope of the 200-period EMA:
🟢 Green — Rising 200 EMA → Bullish Regime
🔴 Red — Falling 200 EMA → Bearish Regime
⚫ Gray — Flat → Neutral Regime
This single filter dramatically changes how you interpret every other signal on the indicator.
Regime-Aware Opportunity Zones
This is where the indicator gets powerful for active traders. The trend regime context transforms oversold/overbought readings into actionable setups:
🟢 Bull Regime Signals (200 EMA rising)
SignalConditionMeaningBuy the Dip ZoneMACD-V between -50 and -150Normal pullback in an uptrend — historically high-probability long entryRare Buy!MACD-V ≤ -100Deep dip in bull trend — a rarer, higher-conviction setupExtreme OB WarningMACD-V > 200Even in a bull regime, this level of extension warrants caution
🔴 Bear Regime Signals (200 EMA falling)
SignalConditionMeaningShort the Rip ZoneMACD-V between 50 and 150Counter-trend bounce in a downtrend — potential short entryRare Short!MACD-V ≥ 100Extended rip in a bear regime — rarer, higher-conviction short setupExtreme OS OpportunityMACD-V < -200Even in a bear regime, this extreme may offer a tradeable bounce
Zones are highlighted with background color fills and shape markers (triangles for zone entries, diamonds for rare signals) at the pane edges.
How to Use It: Practical Examples
Example 1: Buying the Dip in a Bull Trend
Scenario: SPY, daily chart. 200 EMA is rising (green dots). MACD-V drops from +80 (Rallying) into the -50 to -150 range.
Regime dots turn green → confirmed bull regime
Status table shows "Buy the Dip Zone" with green background
MACD-V hits -90, acceleration flips positive (teal area)
MACD-V crosses above signal line → state transitions from Reversing to Rebounding
Entry signal: long on the Rebounding transition with acceleration confirming. Stop below the prior swing low. Target: return to Rallying zone (+50 to +150)
Example 2: Shorting the Rip in a Bear Trend
Scenario: QQQ, daily chart. 200 EMA is falling (red dots). After a sharp decline, price bounces and MACD-V pushes up toward +80.
Regime dots are red → confirmed bear regime
MACD-V enters the 50–150 range → "Short the Rip Zone" activates
Histogram begins shrinking (light teal → light red)
Acceleration turns negative while MACD-V is still above +50
MACD-V crosses below signal line → Rallying → Retracing state change
Entry signal: short on the Retracing state entry. Target: return to Ranging or lower
Example 3: Identifying Exhaustion at Extremes
Scenario: Individual stock surges — MACD-V blows past +150 into Risk (Overbought) and then crosses +200 (Extreme OB).
Status table shows "Risk (Overbought)" — position sizing should be reduced
MACD-V crosses +200 → Extreme OB background activates (dark red)
If in a bull regime: the "Extreme OB Warning" marker fires at the pane ceiling — this is a warning to tighten stops or take partial profits, not necessarily to go short outright
Acceleration turns negative while MACD-V is still above 150 → divergence between price extension and momentum rate-of-change
Watch for MACD-V to turn down and re-enter the 50–150 Rallying zone — that first pullback often offers the next long entry
Example 4: Reading the Histogram for Short-Term Timing
Scenario: You've identified a bullish setup but want better entry timing.
MACD-V is in Ranging (Bullish) (-50 to 50, above signal)
Histogram is positive but shrinking (light teal) — don't chase yet
Wait for histogram to grow again (dark teal bars) → momentum is re-accelerating
Acceleration area flips from red to teal → confirmation
This sequence often pinpoints within 1-2 bars of the optimal entry
Example 5: The Bearish Divergence Setup
Scenario: A stock is below its daily 200 SMA but MACD-V is in the Rebounding or Reversing zone.
Price is in a longer-term downtrend (below 200 SMA)
A light blue background appears — this is the bearish divergence warning: short-term momentum is recovering, but the bigger picture remains weak
Use this signal to fade bounces or simply avoid longs until the regime and trend realign
Supporting Systems (Optional)
LBR 3/10 Oscillator (Sardine)
Linda Bradford Raschke's classic short-term momentum oscillator, volatility-normalized using the same MACD-V methodology. Toggle on to use as a leading signal for MACD-V crossovers — the 3/10 typically turns before the 12/26.
Elder Impulse Plus Bar Coloring
Combines the direction of a 13-period EMA with the direction of the MACD-VH histogram to color price bars:
🟢 Green: EMA rising + histogram expanding positive → buy
🔴 Red: EMA falling + histogram expanding negative → sell/avoid longs
🔵 Blue: Mixed signals → stand aside
Built-In Alerts
The indicator includes 18 alert conditions, covering:
MACD-V / Signal Line crossovers (bullish & bearish)
Zero line crossovers
Entry into all 8 momentum lifecycle states
Extreme regime signals (Bull + >200, Bear + <-200)
MACD-VH overbought/oversold extremes (±40)
MACD-V direction changes (turned up / turned down)
Set alerts on any condition without having to stay glued to the chart.
Pine Screener Compatible
Four numeric values are plotted to the Data Window for use with TradingView's Pine Screener:
Momentum State # (4 to -4)
MACD-V Direction (1, 0, -1)
Trend Regime # (1, 0, -1)
Acceleration Direction (1, -1)
Screen entire watchlists for, e.g., "Bull regime + Momentum State = Rebounding + Acceleration positive" — a powerful combination for systematic scan-based trading.
Settings Reference
ParameterDefaultPurposeFast / Slow EMA12 / 26MACD-V core calculationATR Length26Volatility normalizationSignal Line9EMA of MACD-VRisk Levels±150Overbought/oversold thresholdsFast/Slow Boundary±50Momentum zone boundariesTrend EMA Length200Regime filterRare Buy/Short Level±100Rare signal thresholdsExtreme Level±200Extreme zone definitionAccel Smooth / Scale5 / 4.0Acceleration sensitivity
Credits & Disclaimer
This indicator is a heavily extended implementation of the MACD-V framework developed by Alex Spiroglou, winner of the 2022 NAAIM Founders Award and Charles H. Dow Award. Full academic methodology is available in the original paper linked above.
This script is published for educational and analytical purposes only. Nothing here constitutes financial advice. All trading involves risk. Past performance of any indicator is not indicative of future results.
אינדיקטור

MACD Reversal & RSI OB/OS Dots v1.1📊 MACD Reversal + RSI Exhaustion Dots (1s Scalping Tool)
This indicator is designed for ultra-fast scalping environments, specifically optimized for 1-second charts, where precision and timing are critical.
It combines MACD momentum shifts with RSI exhaustion levels to identify potential short-term reversal points and highlight them directly on the price chart using simple visual signals.
⚙️ How It Works
This script detects early momentum reversals by analyzing the MACD histogram:
A bullish reversal is identified when the MACD histogram stops decreasing and begins increasing.
A bearish reversal is identified when the MACD histogram stops increasing and begins decreasing.
To filter out weaker signals, reversals are only considered valid when paired with RSI extreme conditions:
🟢 Green Dot (Bullish Setup)
MACD histogram reverses upward
RSI is oversold (≤ 30)
Plotted below the candle
🔴 Red Dot (Bearish Setup)
MACD histogram reverses downward
RSI is overbought (≥ 70)
Plotted above the candle
🎯 Purpose
This indicator helps traders:
Identify potential reversal points in fast-moving markets
Spot momentum shifts at exhaustion levels
Improve entry timing for scalping strategies
Reduce noise by requiring confluence between two indicators
🚀 Best Use Cases
1-second and low timeframe scalping
Futures trading (e.g., MNQ, NQ, ES)
High-volatility sessions (market open, news events)
Traders looking for quick reaction signals
⚠️ Important Notes
Signals are reactive, not predictive — they confirm a shift that has already started.
On extremely fast timeframes, false signals can occur due to market noise.
Best used in combination with:
Trend direction
Key support/resistance levels
Volume or order flow tools
🔔 Alerts
The script includes alert conditions for both bullish and bearish signals, allowing traders to automate notifications when setups occur.
⚖️ Disclaimer
This indicator is provided for educational and informational purposes only and does not constitute financial advice.
Trading stocks, options, and futures involves substantial risk and is not suitable for every investor. Past performance is not indicative of future results. You are solely responsible for your own trading decisions, risk management, and financial outcomes.
The creator of this script assumes no liability for any losses or damages incurred from the use of this indicator.
💡 Final Thoughts
This tool is intentionally simple, fast, and visual — designed to give traders a clear edge in speed, not complexity.
Use it as a confirmation tool, not a standalone system. אינדיקטור

אינדיקטור
AI Signal Confluence [forexobroker]🔶 OVERVIEW
AI Signal Confluence is a multi-indicator voting system that scores market conditions across seven independent technical dimensions — trend, momentum, volume, volatility, MACD, SuperTrend, and market structure — and combines them into a single weighted confidence score from 0 to 100. Signals fire only when the composite score crosses a configurable threshold, ensuring that multiple analytical perspectives agree before any trade is suggested.
The problem this solves is analysis paralysis. Traders who use multiple indicators often receive conflicting signals and struggle to synthesize them into a clear decision. This indicator does the synthesis automatically: each component votes bullish or bearish with a 0-100 score, the votes are weighted by user-defined importance, and the result is a single confidence percentage that answers the question "how aligned is everything right now?"
This tool is ideal for traders who value confluence-based decision-making and want a systematic, rules-based framework rather than discretionary chart reading.
🔶 CONCEPTS
Confluence in trading means multiple independent signals pointing in the same direction at the same time. A single indicator can be wrong, but when trend direction, momentum, volume, volatility expansion, MACD histogram, SuperTrend direction, and market structure all agree, the probability of a successful trade increases meaningfully.
The weighted scoring approach recognizes that not all indicators are equally important in every market context. Trend-following traders might weight SuperTrend and EMA alignment heavily, while mean-reversion traders might emphasize RSI and Bollinger Band width. By allowing users to adjust the weights, the same indicator framework adapts to different trading styles and market conditions.
🔶 HOW IT WORKS
• Seven sub-indicators are calculated independently: EMA alignment (trend), RSI positioning (momentum), relative volume ratio, Bollinger Band width expansion (volatility), MACD histogram direction and magnitude, SuperTrend direction, and price position relative to recent pivot structure
• Each sub-indicator produces a bullish score from 0 to 100, and the bearish score is derived as the complement
• Scores are combined using user-defined percentage weights, producing a composite bull confidence and bear confidence
• A buy signal fires when the bull confidence crosses above the threshold (default 70%) on a confirmed bar with the cooldown satisfied; sell signals use the bear confidence crossing its threshold
• The dashboard displays each component's individual vote, score, and the aggregate confidence with a visual bar gauge
🔶 HOW TO USE
Add the indicator to any chart — the dashboard immediately shows how all seven components are voting and the composite confidence level
Monitor the confidence gauge at the bottom of the dashboard — when it fills toward 80-90%, a signal is likely imminent in that direction
When a signal fires with the confidence percentage displayed, evaluate whether the broader context supports the trade — check the individual component scores in the dashboard for any outliers
Adjust component weights in the Advanced settings to match your trading style — give more weight to the indicators you trust most
🔶 FEATURES
• Non-repainting signals (uses barstate.isconfirmed)
• Works on all timeframes and instruments
• 9 alert conditions with webhook JSON support
• Professional dashboard display with component-by-component voting visualization
• Fully customizable weight system for each of the seven indicators
• Gradient bar coloring and background that reflects real-time confidence level
🔶 SETTINGS GUIDE
• Confidence Threshold — Minimum composite score to trigger a signal (default: 70%)
• Signal Cooldown — Minimum bars between consecutive signals (default: 15)
• EMA Fast / Mid / Slow — EMA periods for trend alignment scoring (default: 9 / 21 / 50)
• RSI Length — RSI calculation period for momentum scoring (default: 14) • BB Length / Multiplier — Bollinger Band parameters for volatility scoring (default: 20 / 2.0)
• MACD Fast / Slow / Signal — MACD parameters for histogram scoring (default: 12 / 26 / 9)
• SuperTrend Length / Factor — SuperTrend parameters for direction scoring (default: 10 / 3.0)
• Pivot Lookback — Bars for structure scoring via pivot highs and lows (default: 5)
• Trend / Momentum / Volume / Volatility / MACD / SuperTrend / Structure Weight — Percentage weight for each component in the composite score
🔶 ALERTS
• AISC Buy Signal — Fires on confirmed bullish confluence signal
• AISC Sell Signal — Fires on confirmed bearish confluence signal • Any AISC Signal — Fires on any confirmed signal
• High Confidence (>80%) — Fires when either bull or bear confidence exceeds 80%
• Extreme Confidence (>90%) — Fires when confidence exceeds 90%
• Trend Fully Aligned — Fires when the trend component reaches a perfect score
• Volume Spike (>2x) — Fires when relative volume exceeds 2x the average
• All Indicators Agree — Fires when confidence exceeds 90% with perfect trend alignment
• Webhook JSON — JSON-formatted alert for automated bot integration
🔶 LIMITATIONS & DISCLAIMER
• This is a technical analysis tool, not financial advice
• Past patterns do not guarantee future results
• Best used alongside price action context and proper risk management
• The composite score can lag during sharp reversals because the underlying indicators are inherently reactive
• The term "AI" refers to the systematic weighted voting framework, not machine learning — no neural network or external data is used אינדיקטור

AG Pro Stochastic Exhaustion Map [AGPro Series]AG Pro Stochastic Exhaustion Map
OVERVIEW
AG Pro Stochastic Exhaustion Map is not designed as a classic overbought / oversold reversal script.
This tool uses a stochastic framework to map trend maturity, extension pressure, momentum fatigue, and reset behavior. The objective is not to label every extreme reading as a turning point. Instead, the script is built to show whether a move still looks fresh, whether it is becoming stretched, whether exhaustion risk is increasing, or whether the market is moving through a reset phase after an extended run.
That distinction is important. In strong trends, stochastic values can remain elevated or depressed for long periods. This script does not assume that an extreme reading automatically means the move should reverse. It treats those conditions as contextual information and then evaluates whether the move still has healthy drive, whether it is becoming late-stage, or whether the structure is normalizing.
The result is a state-based reading model rather than a basic signal-only oscillator. The emphasis is on chart context, trend maturity, and fatigue mapping.
WHAT THIS SCRIPT DOES
This script organizes stochastic behavior into a compact state model built around five practical conditions:
• Build-Up
• Drive
• Stretch
• Exhaustion Risk
• Reset
These states are not intended to predict exact tops or bottoms. They are designed to help the user evaluate where the current move may sit within its broader development cycle.
In practical terms, the script focuses on questions such as:
• Is the move still behaving like an active and healthy expansion?
• Has the move become stretched?
• Is momentum support beginning to weaken?
• Has the market started to normalize after an extended push?
• Is current behavior better described as continuation pressure or late-stage fatigue?
That is the core purpose of the indicator.
UNIQUE EDGE
The unique edge of this script is that it does not reduce stochastic analysis to simple line crosses or fixed threshold reactions.
Instead of treating the oscillator as a binary overbought / oversold tool, the script uses it as a context engine for reading trend fatigue. The internal logic emphasizes four broad components:
1) Persistence in extreme zones
How long the oscillator remains in an extended area matters. Persistence alone is not treated as a reversal condition, but prolonged persistence can indicate that a move is progressing into a more mature phase.
2) Momentum decay
A move can remain extended while its internal strength starts to weaken. The script evaluates whether the oscillator is still advancing with conviction or whether follow-through is becoming less efficient.
3) Push efficiency
Price can continue expanding while oscillator quality becomes less supportive. That mismatch can be relevant when assessing whether the move still looks healthy or whether it is becoming increasingly vulnerable to a reset.
4) Reset behavior
After extended conditions, the market often goes through a normalization phase. The script attempts to identify when that process is occurring so the user can distinguish late-move fatigue from post-extension reset behavior.
Together, these components form a stochastic-based exhaustion map instead of a traditional threshold trigger script.
HOW IT WORKS
The script begins with a smoothed stochastic structure and then builds a higher-level state model on top of it.
The model evaluates:
• extreme-zone persistence
• directional decay in stochastic slope
• push-efficiency deterioration
• reset-zone normalization
Those components are blended into an Exhaustion Score, which is then interpreted through the state engine.
The state engine classifies the current condition as one of the following:
Build-Up
An early or re-engaging phase where activity is present but extension pressure is still relatively modest.
Drive
An active expansion phase where the move still appears supported and not yet meaningfully fatigued.
Stretch
A more mature condition where extension is becoming more visible and the move should be read with greater caution.
Exhaustion Risk
A late-stage condition where extension and internal weakening combine strongly enough to raise fatigue risk.
Reset
A normalization phase following recent extreme behavior, where the market is no longer best described as active drive or rising exhaustion.
This is why the script should be read as a contextual map rather than a standalone trade-decision engine.
SUMMARY PANEL
The panel is designed to keep the reading compact and practical. It includes:
• current state
• directional bias
• exhaustion score
• persistence profile
• decay profile
• reset quality
• context label
The panel is not intended to replace chart reading. It is there to summarize the current exhaustion model in a clean format.
HOW TO INTERPRET THE STATES
Build-Up
Early participation or reactivation. The move is not yet heavily stretched.
Drive
The move appears active and supported. This does not mean it must continue. It simply means the exhaustion model is not yet describing the condition as late-stage.
Stretch
The move is becoming more mature. This is a cautionary condition rather than an automatic reversal condition.
Exhaustion Risk
The model is detecting stronger signs of extension plus weakening support. This still does not guarantee reversal. It indicates that late-stage fatigue risk is becoming more relevant.
Reset
The market is moving away from an extended condition and toward normalization. This state can be useful when separating active fatigue from post-extension cooling.
ALERTS
Alerts are state-based and intentionally descriptive. They are designed to notify the user when the model shifts into meaningful phases such as Build-Up, Stretch, Exhaustion Risk, or Reset.
These alerts should be interpreted as contextual transitions rather than direct instructions.
HOW THIS DIFFERS FROM AG PRO RSI PRESSURE MAP
This difference should be understood very clearly.
AG Pro RSI Pressure Map is centered on pressure.
AG Pro Stochastic Exhaustion Map is centered on fatigue.
RSI Pressure Map focuses on whether directional pressure is building, holding, or weakening. Its primary reading axis is pressure intensity and directional dominance.
Stochastic Exhaustion Map focuses on whether a move is fresh, extended, maturing, fatigued, or resetting. Its primary reading axis is trend maturity and exhaustion state.
Put simply:
• RSI Pressure Map asks: which side is applying pressure?
• Stochastic Exhaustion Map asks: how mature or fatigued is the move?
That is not a small wording difference. It changes the analytical role of the script.
A user looking for pressure development, directional participation, or pressure persistence would generally be closer to the RSI Pressure Map framework.
A user looking for extension maturity, late-stage risk, and reset behavior would generally be closer to the Stochastic Exhaustion Map framework.
So even though both tools operate in the broader momentum / context space, they are not the same type of instrument and they are not trying to answer the same question.
HOW THIS DIFFERS FROM CLASSIC STOCHASTIC SCRIPTS
This script is not built as a standard stochastic crossover tool.
It is not built as a basic 80 / 20 reversal script.
It is not built as a simple divergence detector.
Many conventional stochastic scripts are primarily concerned with:
• K / D crossovers
• overbought and oversold threshold events
• simple turn signals from extreme zones
This script takes a different route.
Here, an extreme reading is not automatically treated as a reversal signal.
A crossover is not the main event.
The main objective is to describe the condition of the move itself: active, stretched, fatigued, or resetting.
That distinction is fundamental.
HOW THIS DIFFERS FROM AG PRO STRUCTURAL MOMENTUM OSCILLATOR
Structural Momentum Oscillator is more directly concerned with momentum structure and directional behavior inside the move.
Stochastic Exhaustion Map is more concerned with where the move stands in its lifecycle.
In simplified terms:
• Structural Momentum Oscillator = structure and momentum character
• Stochastic Exhaustion Map = maturity and exhaustion character
The overlap is limited because the purpose is different.
HOW THIS DIFFERS FROM AG PRO MACD DRIFT FILTER
MACD Drift Filter is centered on drift quality and directional continuation behavior through a MACD-derived lens.
Stochastic Exhaustion Map is not trying to grade drift quality in that way. Its emphasis is on extension maturity, internal fatigue, and reset conditions within a stochastic state framework.
So the user should not think of this script as a MACD variant with a different formula. The conceptual job is different.
HOW THIS DIFFERS FROM GENERIC MEAN REVERSION TOOLS
This script does not attempt to force a mean reversion call every time the market becomes extended.
It explicitly allows for the reality that strong moves can remain extended for longer than expected. The goal is to map the transition from healthy extension to increasing fatigue risk, not to declare that every extreme must immediately reverse.
That design choice is central to the script.
LIMITATIONS AND TRANSPARENCY
This script has important limitations.
First, extreme stochastic conditions can persist during strong trends. For that reason, an elevated reading should not be interpreted as an automatic turning point.
Second, exhaustion risk is not the same as reversal confirmation. A market can look stretched and still continue.
Third, reset behavior should be read as normalization context, not as a guaranteed reload condition.
Fourth, no single oscillator should be used in isolation. This script is intended to complement market structure, trend context, support / resistance analysis, volatility conditions, and the user's broader workflow.
The model is deterministic, but deterministic does not mean certain. It means the same conditions will produce the same classification logic.
RISK DISCLOSURE
This indicator is a chart-analysis and contextual state-mapping tool.
It is not a prediction engine.
It is not financial advice.
It should not be used as the sole basis for entries, exits, or risk decisions. אינדיקטור

High-Momentum Option Breakout(MastersinMarkets)Overview
The High-Momentum Option Breakout is a technical tool designed to identify high-probability volatility expansions in equity indices. By combining price action breakouts with trend, strength, and volume filters, it aims to pinpoint specific windows where momentum is likely to accelerate.
How It Works
The script utilizes a multi-layered confirmation process to reduce "fakeouts" often found in standard breakout systems:
Breakout Engine: It monitors a user-defined lookback period to establish dynamic upper and lower bands based on recent price extremes.
Trend Hierarchy: A 200-period Exponential Moving Average (EMA) acts as a high-timeframe filter, ensuring signals align with the broader market regime.
Strength Filter (ADX): To confirm momentum, the script requires the Average Directional Index (ADX) to be above a specific threshold (default 20), indicating a trending environment rather than a sideways churn.
Volume Confirmation: Signals are only triggered when current volume exceeds the 20-period average, suggesting institutional participation in the move.
Dynamic Risk Management: The indicator plots a trailing exit level based on the Average True Range (ATR), which adjusts to market volatility to help protect capital.
How to Use
Long Bias (BUY CE): Triggered when price crosses above the upper band while trading above the 200 EMA with rising ADX and high volume.
Short Bias (BUY PE): Triggered when price crosses below the lower band while trading below the 200 EMA with rising ADX and high volume.
Momentum Exit: While the ATR-based stop is the primary defense, the script also suggests an exit if ADX begins to fall, signaling that the immediate momentum "steam" may be dissipating.
Originality and Value
This script is unique because it integrates momentum decay (falling ADX) as a specific exit trigger tailored for option buyers who need to manage time decay (Theta). It automates the confluence of four distinct technical pillars into a single, non-repainting visual interface.
Risk Disclaimer
Trading involves significant risk. This indicator is a tool for analysis and does not guarantee future profits. Past performance, including the visual signals shown on this chart, is not indicative of future results. Users should always use independent judgment and proper position sizing.
אינדיקטור

Velocity Spectrum Analyzer [JOAT]Velocity Spectrum Analyzer
Introduction
The Velocity Spectrum Analyzer is an advanced open-source momentum wave system that combines Munich Wave methodology with ALMA enhancement and multi-basis momentum tracking. This indicator analyzes momentum across five distinct velocity layers, creating a spectrum of momentum waves that reveal trend strength, regime shifts, and momentum alignment across multiple timeframes.
Unlike single-line momentum indicators, the Velocity Spectrum Analyzer provides multi-dimensional momentum analysis through layered EMA calculations, ALMA enhancement, regime classification, and spread analysis. The indicator is designed for traders who understand that momentum flows in waves and that multi-layer alignment signals institutional conviction.
Why This Indicator Exists
This indicator addresses the need for multi-dimensional momentum analysis. By combining five momentum layers with ALMA enhancement and regime detection, it reveals:
Five Velocity Layers: Fast (9), Medium (21), Slow (55), Very Slow (100), and Ultra Slow (200) EMAs create a momentum spectrum
ALMA Enhancement: Arnaud Legoux Moving Average provides adaptive smoothing with reduced lag
Basis Calculations: Averages between EMA layers create intermediate momentum levels
Regime Classification: Extreme Bull/Bear detection using Bollinger-style bands
Spread Analysis: Distance between fast and slow layers measures momentum strength
Wave State Detection: All layers bullish or bearish signals strong directional momentum
Background Coloring: Visual regime indication shows extreme conditions
Core Components Explained
1. Core Momentum Calculation
The indicator starts with basic momentum (current close minus close N bars ago), then applies ALMA for adaptive smoothing:
The ALMA offset (default 0.85) and sigma (default 6) parameters control the balance between responsiveness and smoothness. Higher offset values shift the average toward recent prices, while higher sigma values increase smoothness.
2. Five EMA Layers
Five EMAs are calculated on the momentum values:
Fast EMA (9): Captures short-term momentum shifts
Medium EMA (21): Tracks intermediate momentum trends
Slow EMA (55): Identifies primary momentum direction
Very Slow EMA (100): Reveals long-term momentum bias
Ultra Slow EMA (200): Shows institutional momentum positioning
Each layer responds at different speeds, creating a spectrum of momentum perspectives.
3. Basis Calculations
Five basis levels are calculated as averages between EMA layers:
Basis 1: Average of Fast and Medium EMAs
Basis 2: Average of Medium and Slow EMAs
Basis 3: Average of Slow and Very Slow EMAs
Basis 4: Average of Very Slow and Ultra Slow EMAs
Basis 5: Average of Ultra Slow and Fast EMAs (wraps around)
These basis levels create intermediate momentum zones that smooth transitions between layers.
4. Trend Classification Functions
Two functions classify momentum direction:
Growing: Momentum > basis (bullish momentum)
Falling: Momentum <= basis AND momentum <= ALMA (bearish momentum)
Each basis is classified independently, creating five separate momentum assessments.
5. Regime Detection with Bollinger-Style Bands
The indicator calculates bands around the average of all five basis levels:
Origin: SMA of basis average (default 25 periods)
Deviation: Standard deviation multiplied by factor (default 6.0)
Top Band: Origin + deviation (extreme bullish threshold)
Bottom Band: Origin - deviation (extreme bearish threshold)
When basis 1 and ALMA both exceed the top band with rising momentum, the indicator signals extreme bullish conditions. When both fall below the bottom band with falling momentum, it signals extreme bearish conditions.
6. Mean Range Calculation
A long-term mean range (default 415 bars) tracks the highest and lowest basis average values. The center of this range serves as a reference point for ALMA positioning. When ALMA is above the center mean with all layers bullish, strong upward momentum is confirmed.
7. Wave State Analysis
The indicator tracks when all five basis levels are simultaneously bullish or bearish:
All Bullish: All five basis levels show growing momentum - strong uptrend
All Bearish: All five basis levels show falling momentum - strong downtrend
Mixed: Some layers bullish, some bearish - transitional or choppy conditions
Wave state alignment indicates institutional conviction across all momentum timeframes.
8. Spread Calculation
The spread between Basis 1 (fastest) and Basis 5 (slowest) measures momentum divergence:
Positive Spread (> 10): Fast momentum exceeds slow momentum - bullish acceleration
Negative Spread (< -10): Fast momentum below slow momentum - bearish acceleration
Extreme Spread (> 20 or < -20): Very strong momentum divergence - potential exhaustion
Large spreads indicate strong directional momentum, while narrowing spreads warn of momentum loss.
Visual Elements
Five Velocity Layer Lines: Thick colored lines showing each basis level with dynamic coloring (cyan = bullish, yellow = bearish, white = neutral)
ALMA Enhanced Line: Separate line showing ALMA-adjusted momentum with tri-color scheme
Wave State Line: Zero line colored based on overall wave state
Background Regime: Red background for extreme bull, green background for extreme bear
Information Dashboard: Displays wave state, regime, spread, ALMA position, momentum value, layer alignment, and signal status
Signal Generation
The indicator generates four types of signals:
Lean Short: Bearish crossover with falling Basis 1 and 2, spread <= -10
Maybe Buy: Bearish crossover with falling Basis 1 and 2, extreme bear regime, spread <= -20 (oversold)
Lean Long: Bullish crossover with growing Basis 1 and 2, spread >= 10
Maybe Sell: Bullish crossover with growing Basis 1 and 2, extreme bull regime, spread >= 20 (overbought)
Additional signals:
All Aqua: All layers bullish for 4+ consecutive bars - strong uptrend confirmation
All Yellow: All layers bearish for 4+ consecutive bars - strong downtrend confirmation
How to Use This Indicator
Step 1: Check Wave State
Monitor the dashboard for wave state (All Bullish, All Bearish, or Mixed). Trade in the direction of wave state alignment.
Step 2: Analyze Regime
Watch for extreme bull/bear regimes (red/green backgrounds). These often precede reversals or strong continuation moves.
Step 3: Monitor Spread
Large spreads (> 20 or < -20) indicate strong momentum but potential exhaustion. Narrowing spreads warn of momentum loss.
Step 4: Check ALMA Position
ALMA above center mean with bullish layers confirms uptrend. ALMA below center mean with bearish layers confirms downtrend.
Step 5: Count Layer Alignment
The dashboard shows how many layers are bullish (X/5). 5/5 bullish = strongest uptrend, 0/5 bullish = strongest downtrend.
Step 6: Wait for Signal Confirmation
Lean Long/Short signals work best when wave state aligns. Maybe Buy/Sell signals at extremes offer reversal opportunities.
Best Practices
Trade with wave state alignment, not against it
Use extreme regimes as reversal warnings, not continuation signals
Monitor spread for momentum strength - large spreads indicate strong trends
Wait for all layers to align (5/5) before taking aggressive positions
Use Maybe Buy/Sell signals only at extreme regimes with high spread
Combine with price action - momentum shows intent, price shows result
Be cautious when layers are mixed (2/5 or 3/5) - indicates choppy conditions
Watch for spread narrowing as early warning of trend exhaustion
Input Parameters
Momentum Engine:
Source: Price input (default: close)
Momentum Length: Period for momentum calculation (default: 21)
ALMA Offset: Offset parameter for ALMA (default: 0.85)
ALMA Sigma: Sigma parameter for ALMA (default: 6)
Momentum Layers:
Fast EMA: Short-term momentum (default: 9)
Medium EMA: Intermediate momentum (default: 21)
Slow EMA: Primary momentum (default: 55)
Very Slow EMA: Long-term momentum (default: 100)
Ultra Slow EMA: Institutional momentum (default: 200)
Regime Classification:
Mean Lookback: Period for mean range (default: 415)
StdDev Length: Period for standard deviation (default: 25)
StdDev Multiplier: Band width multiplier (default: 6.0)
Background Offset: Shift background display (default: 0)
Visual Configuration:
Bullish Color: Color for bullish momentum (default: cyan)
Bearish Color: Color for bearish momentum (default: yellow)
Neutral Color: Color for neutral momentum (default: white)
Enable Alerts: Toggle alert conditions (default: enabled)
Originality Statement
This indicator is original in its multi-layer momentum approach. While individual components (EMAs, ALMA, momentum) are established concepts, this indicator is justified because:
It combines five distinct momentum layers into a unified spectrum analysis
The basis calculation system creates intermediate momentum zones between layers
ALMA enhancement provides adaptive smoothing with reduced lag
Regime detection using Bollinger-style bands on basis average identifies extremes
Wave state analysis tracks alignment across all five layers simultaneously
Spread calculation measures momentum divergence between fast and slow layers
The comprehensive dashboard presents all momentum dimensions simultaneously
Disclaimer
This indicator is provided for educational and informational purposes only. It is not financial advice. Trading involves substantial risk of loss. Momentum analysis does not guarantee profitable trades. Past momentum patterns do not guarantee future results. Always use proper risk management and never risk more than you can afford to lose.
-Made with passion by officialjackofalltrades אינדיקטור

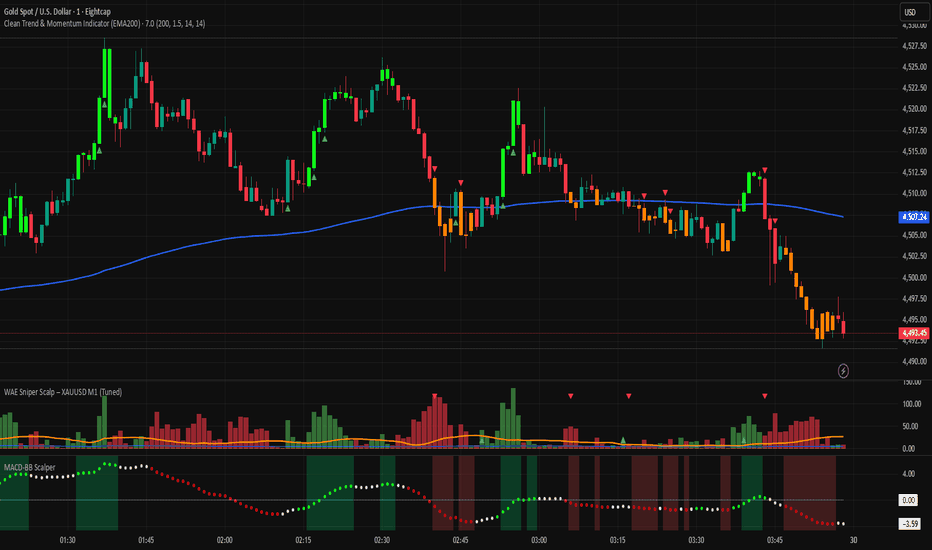
Clean Trend & Momentum (EMA200 + Volume Confirmation)Since you are publishing this on TradingView, a professional and clear English description will help your script gain more visibility and trust.
Here is a high-quality, structured description you can copy and paste directly:
Indicator Name: Clean Trend & Momentum (EMA200 + Volume Confirmation)
Overview
The Clean Trend & Momentum Indicator is a professional-grade trend-following tool designed to identify high-probability entries. By combining the foundational EMA 200 for trend direction with Relative Candle Body Analysis and Volume Filtering, this script helps traders filter out market noise and focus on "power moves" where real momentum is present.
How it Works
This indicator looks for a "confluence" of three major factors:
Trend Direction: It uses the EMA 200 as a "Golden Line." It only permits Buy signals when the price is above the EMA and Sell signals when the price is below.
Momentum (Large Candle): It compares the current candle body size to the average of the last 14 candles. A signal only triggers if the candle is significantly larger (default 1.5x) than the average, indicating a surge in momentum.
Volume Validation: To prevent "fakeouts" during low liquidity, the indicator checks if the current volume is higher than the average volume. (This filter can be toggled in the settings).
Key Features
Smart Momentum Detection: Automatically calculates volatility to find "Explosive Candles."
Volume Filter: Reduces false signals during consolidation or low-volume periods.
Clean Visuals: Minimalist design with clear Buy/Sell shapes (Triangles) that don't clutter your chart.
Fully Customizable: Easily adjust the EMA length, Body Multiplier, and Lookback periods to suit your trading style (Scalping, Day Trading, or Swing Trading).
Built-in Alerts: Ready-to-use alert conditions for automated notifications.
How to Trade
🟢 Buy Signal: Price > EMA 200 + Large Green Candle + High Volume.
🔴 Sell Signal: Price < EMA 200 + Large Red Candle + High Volume.
Best Used On: 1m, 5m, 15m, 1h, and 4h timeframes for the most reliable trend confirmation.
Settings
EMA Length: Default is 200. Lower it (e.g., 50) for more aggressive entries.
Body Multiplier: Increase this (e.g., 2.0) to find only the most extreme "Power Bars."
Volume Filter: Toggle this off if you are trading assets with low volume data accuracy (like some OTC stocks). אינדיקטור
Candle Momentum Burst Detector Candle Momentum Burst Detector
━━━━━━━━━━━━━━━━━━━━━━━━━━━━━━━━━━━━━━━━
⚠️ EDUCATIONAL PURPOSE ONLY — This script does not generate buy or sell signals. It is a market analysis and visualization tool built for educational and informational purposes only. It does not constitute financial advice. Trading involves significant risk. Always use proper risk management and consult a qualified financial advisor before making any trading decisions.
━━━━━━━━━━━━━━━━━━━━━━━━━━━━━━━━━━━━━━━━
💡 WHAT MAKES THIS DIFFERENT
━━━━━━━━━━━━━━━━━━━━━━━━━━━━━━━━━━━━━━━━
Most momentum indicators confirm a move AFTER it has already run. This indicator detects the BIRTH of the move — the exact candle where compressed energy releases explosively in one direction. No RSI. No MACD. No Bollinger Bands. 100% original math built from scratch in Pine Script v6.
━━━━━━━━━━━━━━━━━━━━━━━━━━━━━━━━━━━━━━━━
⚙️ 4 ENGINE SYSTEM
━━━━━━━━━━━━━━━━━━━━━━━━━━━━━━━━━━━━━━━━
● ENGINE 1 — RANGE COMPRESSION DETECTOR
Compares the last 5 candles average range against the last 20 candles average. When the short-term average drops below a threshold percentage of the long-term average, the market is coiling and a burst is building.
● ENGINE 2 — BURST CANDLE IDENTIFIER
The first strong directional candle after compression. Must have a large range expansion above the short-term average, a strong body ratio closing decisively near the high or low, and a close in the top 40 percent for bull or bottom 40 percent for bear.
● ENGINE 3 — VOLUME CONFIRMATION
Volume must be above its average on the burst candle. A candle expanding in range without volume is often a false move. This engine filters those out automatically.
● ENGINE 4 — MOMENTUM SCORE (0 to 4)
Each condition above 2x threshold adds one point to the score. Score 4 means all conditions are at maximum strength — historically the highest probability continuation setup.
━━━━━━━━━━━━━━━━━━━━━━━━━━━━━━━━━━━━━━━━
🎨 VISUAL ELEMENTS
━━━━━━━━━━━━━━━━━━━━━━━━━━━━━━━━━━━━━━━━
● Yellow compression zone box — marks where the market was coiling before the burst
● Bull Burst label (teal) — appears below the burst candle with score
● Bear Burst label (red) — appears above the burst candle with score
● Two dotted target lines — projected at 1x and 1.5x the burst candle range forward
● Candle coloring — burst candles colored by direction and strength
● Gray candles — marks active compression zones on the chart
━━━━━━━━━━━━━━━━━━━━━━━━━━━━━━━━━━━━━━━━
💪 MOMENTUM SCORE GUIDE
━━━━━━━━━━━━━━━━━━━━━━━━━━━━━━━━━━━━━━━━
● EXTREME ★★★★ — All 4 conditions at maximum strength — highest probability
● STRONG ★★★☆ — 3 conditions strong — reliable observation
● MODERATE★★☆☆ — 2 conditions met — valid but use with caution
● WEAK ★☆☆☆ — Use Min Score filter to hide these
━━━━━━━━━━━━━━━━━━━━━━━━━━━━━━━━━━━━━━━━
📊 DASHBOARD
━━━━━━━━━━━━━━━━━━━━━━━━━━━━━━━━━━━━━━━━
● Compression State — COILING / READY / NORMAL shown in real time
● Burst Score — live 0 to 4 score with readiness meter
● Last Signal — most recent burst direction
● Range vs Average — current candle range as percentage of long average
● Compression % — how compressed the market currently is
● Volume vs Average — current volume as percentage of average
● Body Ratio — current candle body strength percentage
● Burst Multiplier Needed — exact points needed for a burst on current bar
● Bull and Bear Burst counts for the session
Dashboard position is fully movable from settings — Top, Bottom, Middle, Left, Right, Center. No code editing needed.
━━━━━━━━━━━━━━━━━━━━━━━━━━━━━━━━━━━━━━━━
📖 HOW TO READ IT — STEP BY STEP
━━━━━━━━━━━━━━━━━━━━━━━━━━━━━━━━━━━━━━━━
● STEP 1 — Watch for gray candles
Gray or compressed candles mean the market is coiling. Do not trade during this period. Wait for the burst.
● STEP 2 — Compression State in dashboard
When dashboard shows COILING — energy is building. When it shows READY — compression happened recently and burst may be imminent.
● STEP 3 — Burst label appears
When BULL BURST or BEAR BURST label appears, check the score. Score 2 or above is the recommended minimum for any observation.
● STEP 4 — Check the target lines
Two dotted lines project forward from the burst candle. First line is 1x target, second is 1.5x target. These are educational reference levels, not guarantees.
● STEP 5 — Best observation combination
Score 4 plus COILING state just before plus volume above 150 percent of average equals the strongest setup this indicator can identify. Study these on historical data first.
━━━━━━━━━━━━━━━━━━━━━━━━━━━━━━━━━━━━━━━━
⚡ RECOMMENDED SETTINGS
━━━━━━━━━━━━━━━━━━━━━━━━━━━━━━━━━━━━━━━━
● Timeframe — 5 min or 15 min recommended for intraday
● Min Score — set to 2 for balanced signals
● Works on — Nifty, BankNifty, stocks, crypto, forex, any liquid instrument
● Alerts — set Bull Burst and Bear Burst alerts for phone notifications
━━━━━━━━━━━━━━━━━━━━━━━━━━━━━━━━━━━━━━━━
✅ TECHNICAL TRANSPARENCY
━━━━━━━━━━━━━━━━━━━━━━━━━━━━━━━━━━━━━━━━
● No Repainting — all calculations on confirmed candle data only
● No Lookahead Bias — zero future data access
● No External Data — built purely on price and volume
● Pine Script v6 — latest version, fully optimized
● Original Code — not derived from any existing open-source script
● ta.* functions called at top level only — fully compliant with Pine Script v6 rules
━━━━━━━━━━━━━━━━━━━━━━━━━━━━━━━━━━━━━━━━
⚠️ DISCLAIMER
━━━━━━━━━━━━━━━━━━━━━━━━━━━━━━━━━━━━━━━━
This indicator is published for educational and informational purposes only. It does not generate buy or sell signals. It does not guarantee any trading results. Past performance of any pattern or observation shown by this tool does not guarantee future results. The author is not responsible for any financial losses. Always do your own research and consult a licensed financial professional before trading. אינדיקטור

AG Pro RSI Pressure Map [AGPro Series]AG Pro RSI Pressure Map
OVERVIEW
AG Pro RSI Pressure Map is an overlay indicator that interprets RSI behavior as directional pressure on price rather than presenting RSI as a standalone oscillator panel. The script maps bullish and bearish pressure conditions directly on the chart, highlights confirmed pressure builds, and separates those states from release conditions and internal weakening.
The goal is not to repeat standard RSI threshold usage such as simple overbought/oversold signals. Instead, this script translates RSI persistence, slope, trend alignment, and price response efficiency into a chart-based pressure model. The result is a structure-aware visual framework that helps users evaluate whether momentum is building, fading, or attempting to reassert itself.
This tool is designed for traders who prefer price-chart context over isolated oscillator readings. By keeping the logic on the main chart, it becomes easier to observe how directional pressure develops around swings, pullbacks, transitions, and continuation attempts.
UNIQUE EDGE
The distinctive idea behind this script is that RSI is not treated here as a one-line trigger engine. Instead, RSI is used as a pressure input inside a multi-step state model. A bullish or bearish condition is not activated by a single threshold alone. It requires a combination of persistence, slope, trend-side alignment, and minimum response quality.
That makes this script structurally different from conventional RSI overlays or threshold markers. It does not simply mark every move above or below a level. It attempts to identify whether price is actually behaving like a pressure phase, whether that phase lasts long enough to matter, and whether the move later transitions into a release or a weakening sequence.
Another important distinction is the use of zone persistence and signal spacing. Short-lived fluctuations are filtered by minimum zone duration, paint delay, cooldown spacing, and failure-lock logic. This helps reduce repetitive chart clutter and keeps the output more focused on pressure phases that remain contextually relevant for more than a single bar.
WHAT THE SCRIPT DOES
This indicator classifies chart behavior into a small number of practical states:
- Bullish Pressure
- Bearish Pressure
- Bullish Release
- Bearish Release
- Pressure Failure
- No Active Zone
Pressure zones are displayed as soft background states once a valid zone remains active long enough to pass the paint delay requirement. Signal markers and optional labels identify important transitions, including new pressure builds and release conditions. A panel summarizes the current state so users can quickly read the broader condition without scanning every marker.
The script is intended to help with context and organization. It is not limited to trend continuation use only. It can also help identify when an apparent move is weakening internally or when a previous stretch phase may be transitioning into a more constructive re-engagement.
METHODOLOGY
The script combines several components into a single state engine:
1. RSI baseline calculation
RSI is calculated from user-defined length and can optionally be smoothed. This creates the base momentum input for the pressure model.
2. RSI slope and persistence
The script evaluates whether RSI is rising or falling, and whether that direction persists across a configurable lookback window. This helps distinguish stable directional pressure from one-bar fluctuation.
3. Trend alignment
Price is compared against a trend EMA so the script can evaluate whether a pressure condition is aligned with the prevailing side of the market. This reduces cases where RSI alone may look strong while price structure remains inconsistent.
4. Price response efficiency
The model checks whether recent price movement is meaningful relative to ATR. This is used to filter low-quality pressure states where RSI movement exists but price response is weak.
5. Zone state logic
A bullish or bearish pressure state is only activated when the required conditions are present and remains active until exit logic invalidates it. Minimum zone duration and flat cooldown logic are used to reduce rapid state flipping.
6. Release logic
Release conditions are derived from pressure transitions that also satisfy contextual requirements such as recent stretch history and price-side confirmation. This is meant to make release signals more selective than ordinary threshold crosses.
7. Failure logic
The script can detect internal weakening inside an active zone when slope deteriorates and response quality drops. Failure-lock behavior is used to avoid excessive repetition inside the same pressure phase.
Because the model works through a state engine rather than isolated threshold events, the output is better understood as a pressure map than as a classical oscillator trigger set.
SIGNALS AND ALERTS
The script provides the following event types:
- Bullish Pressure Build
- Bearish Pressure Build
- Bullish Release Confirmed
- Bearish Release Confirmed
- Pressure Failure
These alerts are meant to notify users about state transitions, not to replace trade planning or execution rules. A pressure build does not automatically imply continuation. A release does not guarantee reversal or acceleration. A failure does not guarantee collapse. Each event is best interpreted in the context of structure, liquidity, volatility, and timeframe.
KEY INPUTS
RSI Length
Controls the base RSI period.
RSI Smoothing
Applies optional smoothing to RSI before state evaluation.
Trend EMA Length
Defines the trend alignment reference.
Persistence Lookback / Minimum Persistence Count
Control how stable RSI direction must be before a pressure state becomes valid.
Bull Entry RSI / Bear Entry RSI
Set the activation thresholds for bullish and bearish pressure.
Bull Exit RSI / Bear Exit RSI
Define when active pressure zones can terminate.
Minimum Push Efficiency
Filters low-quality states where RSI movement is not supported by sufficient price response.
Release Lookback
Controls how far back the script checks for recent stretch context before validating release behavior.
Minimum Zone Bars / Flat Cooldown Bars
Reduce rapid flip behavior and help pressure zones remain more stable.
Zone Paint Delay
Prevents immediate background painting on very early bars of a new zone.
Build Label Offset / Release Label Offset / Failure Label Offset
Allow spacing between labels and candles for cleaner presentation.
Build Label Minimum Gap Bars / Release Label Minimum Gap Bars
Reduce repeated labels on the same side and improve chart readability.
HOW TO READ IT
A bullish pressure zone means the script currently sees persistent bullish-side momentum that remains aligned with trend-side conditions and minimum response requirements. A bearish pressure zone means the same on the downside.
A bullish release is not simply “bullish RSI.” It represents a more selective re-engagement condition built on prior context. The bearish release follows the same idea in reverse.
A pressure failure suggests that the active zone may be weakening internally. This is not a standalone reversal call. It is a cautionary state that says the current pressure phase is losing quality.
The panel should be read as a summary layer:
- RSI State shows the active state classification
- Pressure Bias shows the normalized directional bias
- Stretch Status shows whether RSI is in an extreme region
- Structure Align shows whether price and RSI are aligned
- Signal State shows the latest meaningful state event
LIMITATIONS AND TRANSPARENCY
This script is not a prediction engine and should not be interpreted as one. It is a state-classification tool built from RSI behavior, EMA alignment, ATR-normalized response, and rule-based persistence logic.
Like all chart tools, it is sensitive to timeframe selection, volatility regime, and market structure. A setting combination that feels appropriate on one symbol or timeframe may be too loose or too strict on another.
The script also does not solve broader market context. It does not evaluate macro conditions, volume profile, order flow, news, or execution quality. Users should treat it as a chart-organization tool, not as a complete trading framework.
The output is intentionally selective, but any filter system involves trade-offs. More filtering may reduce noise while also delaying some transitions. Less filtering may make the script more responsive while increasing signal density.
This indicator should be used as a supporting layer for chart reading, not as a substitute for risk management, independent analysis, or confirmation from the user’s own process.
WHAT THIS SCRIPT IS NOT
- Not a basic RSI overbought/oversold marker set
- Not a simple RSI 50-line crossover script
- Not a buy/sell guarantee system
- Not a replacement for execution rules
- Not a full strategy with entries, exits, and sizing logic
It is a rule-based pressure mapping tool designed to help visualize directional momentum states on price.
RISK DISCLOSURE
This indicator is for analysis and chart interpretation only. It does not provide financial advice, investment advice, or guaranteed outcomes. All trading involves risk, including the risk of loss. Users should test settings, validate behavior on their own markets and timeframes, and make independent decisions based on their own methodology and risk tolerance. אינדיקטור

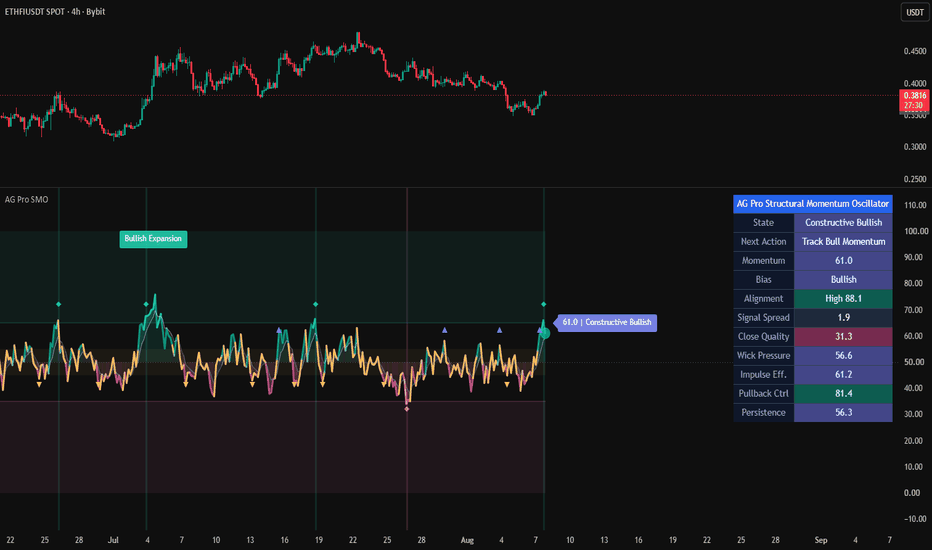
AG Pro Structural Momentum Oscillator [AGPro Series]AG Pro Structural Momentum Oscillator
OVERVIEW
AG Pro Structural Momentum Oscillator evaluates momentum through price structure instead of relying on a standard oscillator formula alone. The goal is not to duplicate a classic RSI, MACD, or stochastic workflow, but to study how price behaves internally: where bars close within their own range, how upper and lower wicks are distributed, how efficiently directional travel develops, and whether pullbacks remain controlled or start to damage the underlying move.
This produces a structure-based momentum reading that is designed to help users distinguish between constructive directional pressure, weak or unstable movement, and transition phases. In practice, the oscillator is intended for traders who want more context than a simple overbought/oversold style reading, while still keeping the visual experience compact and readable in a separate pane.
The model is normalized into a clean oscillator format and supported by an optional panel that exposes the internal components behind the headline score. This makes the script easier to inspect without turning it into a crowded dashboard. The result is a momentum tool that remains chart-friendly while still offering transparency about what is driving the current state.
WHAT THIS SCRIPT DOES
This script builds a composite momentum score from structural price behavior. Instead of measuring momentum only through smoothed distance or rate-of-change logic, it examines whether bars are closing with quality, whether wick balance supports continuation or rejection, whether the move is advancing efficiently, whether counter-moves are being absorbed, and whether directional pressure is persisting across the selected lookback.
The oscillator is shown in a separate pane so that the price chart remains clean. Stronger bullish conditions push the reading toward the upper zone, stronger bearish conditions push it toward the lower zone, and transitional behavior tends to cluster around the middle band. Optional markers can highlight structural shifts, expansion entries, and midline events, while the panel can display both the current state and the underlying component scores.
UNIQUE EDGE
The core idea here is structure-based momentum assessment.
This script does not attempt to repackage a traditional oscillator with cosmetic changes. Its momentum reading is built from several structural observations working together:
- close quality within the bar range
- wick pressure balance
- impulse efficiency
- pullback control
- directional persistence
That combination is what makes the oscillator different. It is not asking only whether price moved. It is asking how price moved, whether that movement was internally supportive, and whether the recent sequence of bars reflects constructive continuation or unstable friction.
Because of that design, the oscillator can be useful in situations where traders want additional confirmation around trend continuation, weakening follow-through, or state transitions, without depending on a single legacy oscillator formula.
METHODOLOGY
The composite score is built from a weighted structural model.
1) Close Quality
This measures where the bar closes relative to its own range. Bars that close with directional conviction contribute more positively or negatively than bars that finish in weak or indecisive positions.
2) Wick Pressure
This evaluates the balance between upper and lower wick behavior. It helps estimate whether rejection pressure is supporting the current direction or working against it.
3) Impulse Efficiency
This compares net directional progress against recent travel. Large movement alone is not treated as strength if the structure is inefficient or overly noisy.
4) Pullback Control
This examines whether counter-direction movement remains contained or begins to undermine the active directional leg.
5) Persistence
This tracks whether structural bias has been holding together across the recent window instead of flipping constantly from bar to bar.
These components are normalized and combined into a structural momentum oscillator score. The separate panel allows users to inspect the same internal drivers individually, which can be helpful when the headline reading is near transition levels.
SIGNALS AND ALERTS
The oscillator can be used visually or through alerts.
Depending on settings, the script can monitor:
- bullish structural shifts
- bearish structural shifts
- bullish expansion entries
- bearish expansion entries
- midline events
Optional markers can be displayed directly in the oscillator pane. The legend row in the panel explains what each marker type represents. Users who prefer a cleaner presentation can disable markers or legend items from the settings.
As with most technical tools, signals are best interpreted in context. A structural shift is not the same thing as a trade command. It is an analytical event showing that the model detected a meaningful change in the balance of recent price behavior.
KEY INPUTS
The script includes the following input groups:
- structure length
- persistence window
- pullback window
- smoothing
- expansion thresholds
- panel visibility and font size
- signal marker mode
- marker legend visibility
- marker cooldown
These controls allow the user to keep the oscillator relatively clean by default, or expose more information when deeper inspection is needed.
HOW TO READ IT
A higher reading generally indicates stronger constructive bullish structure. A lower reading generally indicates stronger constructive bearish structure. Readings near the middle zone typically represent mixed or transitional behavior rather than strong directional consensus.
The panel state labels are designed to summarize that environment in plain language. The component rows below the headline score can help explain why the state is strong, weak, improving, or deteriorating.
In general, the oscillator is most useful when read together with price structure, trend context, and nearby technical levels, rather than in complete isolation.
LIMITATIONS AND TRANSPARENCY
This script is an analytical aid, not a predictive engine.
It does not know future price direction. It only evaluates the recent structural character of price action according to its own model. Like any momentum-based tool, it can react quickly during strong directional phases and become less reliable during noisy, event-driven, or highly erratic conditions.
Different symbols and timeframes can also produce different structural behavior. Users should expect to adjust settings where appropriate and validate how the oscillator behaves on the markets they follow.
The script is designed to provide a structured interpretation of momentum, but it should not be treated as a guarantee of continuation, reversal, or trade outcome.
RISK DISCLOSURE
This indicator is provided for chart analysis, research, and educational use only. It does not provide financial advice, investment advice, or guaranteed signals. All trading decisions remain the sole responsibility of the user. Technical indicators should be used with risk management and broader market context, not as standalone certainty tools. אינדיקטור
אינדיקטור

GCM SMILE with DC ProtocolDescription:
Title: GCM SMILE with DC Protocol
Strategic Momentum. Masterful Execution. — Powered by uniGram.
Overview
The GCM S.M.I.L.E. (Stochastic Momentum Index & Logical Executor) with DC Protocol is an institutional-grade algorithmic trading suite designed to strip emotion from the charts. By fusing double-smoothed momentum tracking with volatility-adjusted risk management and spatial price mapping, the SMILE Protocol provides quantitative traders with a deterministic framework for market entry, risk evaluation, and trade management.
Unlike standard retail indicators that lag or provide isolated data points, this suite operates as a complete, real-time confluence engine. It maps market structure, identifies hidden exhaustion, and projects immediate risk parameters directly onto the price action without cluttering the visual field.
Core Architecture & Visual Engine
1. The SMI Engine (Stochastic Momentum Index)
At the heart of the system is a double-smoothed momentum oscillator designed to eradicate standard market noise.
Precision Entries: The engine isolates true directional thrusts, plotting high-contrast, pinpoint signal dots (Size: Tiny) directly on the execution candle only when critical crossovers occur.
Clean Visuals: Stripped of all unnecessary ribbons and conflicting slopes, it leaves only the purest buy/sell momentum triggers on the chart.
2. The DC Protocol (Spatial Pricing & Liquidity Zones)
Price is rarely random; it moves between Premium and Discount zones. The DC (Donchian Channel) Protocol maps these institutional boundaries in real-time using native dashed bands.
Dynamic Gradient Shading: Utilizing a mathematically locked 40%-to-100% gradient matrix, the protocol visually identifies the Premium Zone (Forest Green) for highly probable distribution areas and the Discount Zone (Deep Red) for optimal accumulation areas.
Slope-Reactive Midline: The equilibrium solid midline dynamically shifts color (Lime/Red/Gray) to indicate shifting structural balance, giving traders an immediate bias read.
3. Algorithmic Divergence Scanner
The system actively hunts for hidden institutional footprints by measuring price action against underlying momentum.
Automated Detection: It continuously scans user-defined pivot lookback windows (default 5 bars) for Regular Bullish and Bearish Divergence
Pro-Level Visual Alerts: When momentum fails to confirm a new price extreme, the protocol draws a clean dashed structural line connecting the pivots. It then plots a high-opacity (100%), soft-dark label with crisp white text to warn the trader of impending trend exhaustion without burning the retinas.
4. The Logical Executor (Volatility-Adjusted Risk)
Amateur traders use static stop losses; professionals use volatility. The Logical Executor manages the trade parameters the second a signal fires.
ATR-Driven Ribbons: Upon a signal trigger, the executor instantly calculates a customized Stop Loss based on current Average True Range (default 1.5x) and locks it in.
Future Projection: To prevent the gradient clouds from muddying your live trade data, the risk ribbons (Entry, Stop Loss, and Live Tracking lines) are projected 3 bars into the future, separating risk management visuals from the core price action.
5. Quantitative H.U.D. (Heads-Up Display)
A comprehensive, real-time data terminal overlays the chart, providing immediate quantitative feedback:
Live SMI values and contextual momentum summaries ("STRONG BULL", "BEARISH", etc.).
Volume validation dynamically checked against a 20-period SMA.
DC Zone identification (Premium vs. Discount).
Active Divergence tracking (holds state for 10 bars so you never miss a flash signal).
Live Trade Metrics: Real-time tracking of open risk (LIC), open profit (POC), equity erosion (LIP), and live Risk-to-Reward (R:R) ratios.
6. Institutional Alert Routing
Fully equipped for algorithmic deployment, the protocol contains built-in webhook-ready alerts for:
Long Crossovers & Short Crossunders.
Bullish & Bearish Divergence Detections.
The Execution Playbook
🟢 Protocol A: The Discount Strike (Long Entry)
Spatial Alignment: Price must be trading in or interacting with the Discount Zone (Red Gradient / Lower DC Band).
Momentum Trigger: Wait for a confirmed Bullish SMI Crossover (Lime Green Dot below the candle).
Volume Confirmation: Check the HUD. Volume should display 🟢.
Logical Execution: Enter Long on the close. Stop Loss is mapped by the Red ATR dashed line (LIC).
Target Matrix: Target the DC Midline for Partial TP1, and the DC Upper Band for final targets.
🔴 Protocol B: The Premium Strike (Short Entry)
Spatial Alignment: Price must be trading in or interacting with the Premium Zone (Green Gradient / Upper DC Band).
Momentum Trigger: Wait for a confirmed Bearish SMI Crossunder (Red Dot above the candle).
Volume Confirmation: Check the HUD. Volume should display 🔴.
Logical Execution: Enter Short on the close. Stop Loss is mapped by the Green ATR dashed line (LIC).
Target Matrix: Target the DC Midline for Partial TP1, and the DC Lower Band for final targets.
⚠️ Protocol C: The Exhaustion Reversal (Divergences)
When the Divergence Engine triggers a soft-colored, 100% opaque Bull Div or Bear Div label, structural exhaustion is imminent. Do not enter blindly. Use the label as advanced warning to aggressively trail stops, or wait for the very next SMI Signal Dot in the direction of the divergence to execute a high-probability reversal.
⚖️ Risk Disclaimer
For Educational and Analytical Purposes Only.
The GCM SMILE with DC Protocol is a quantitative trading tool designed to visualize mathematical formulas and historical data. It does not constitute financial advice, investment recommendations, or a solicitation to buy or sell any asset. Trading involves a substantial risk of loss and is not suitable for all investors. By using this suite, you acknowledge that you are entirely responsible for your own execution and risk management. Always trade with capital you can afford to lose.
Strategic Momentum. Masterful Execution. — Powered by uniGram.
HAPPY TRADING
________________________________________
Description in Kannada Language (ಕನ್ನಡ ವಿವರಣೆ)
Title: GCM SMILE with DC Protocol
Strategic Momentum. Masterful Execution. — Powered by uniGram.
ಅವಲೋಕನ (Overview)
GCM S.M.I.L.E. (Stochastic Momentum Index & Logical Executor) with DC Protocol ಎಂಬುದು ಚಾರ್ಟ್ಗಳಿಂದ ಭಾವನೆಗಳನ್ನು (emotions) ಹೊರಹಾಕಲು ವಿನ್ಯಾಸಗೊಳಿಸಲಾದ ಒಂದು ಇನ್ಸ್ಟಿಟ್ಯೂಷನಲ್-ಗ್ರೇಡ್ ಅಲ್ಗಾರಿದಮಿಕ್ ಟ್ರೇಡಿಂಗ್ ಸೂಟ್ ಆಗಿದೆ. ಮೊಮೆಂಟಮ್ ಟ್ರ್ಯಾಕಿಂಗ್, ವೊಲಟಾಲಿಟಿ-ಅಡ್ಜಸ್ಟೆಡ್ ರಿಸ್ಕ್ ಮ್ಯಾನೇಜ್ಮೆಂಟ್ ಮತ್ತು ಪ್ರೈಸ್ ಮ್ಯಾಪಿಂಗ್ ಅನ್ನು ಸಂಯೋಜಿಸುವ ಮೂಲಕ, ಈ ಪ್ರೋಟೋಕಾಲ್ ಟ್ರೇಡರ್ಗಳಿಗೆ ಎಂಟ್ರಿ, ರಿಸ್ಕ್ ಮತ್ತು ಟ್ರೇಡ್ ಮ್ಯಾನೇಜ್ಮೆಂಟ್ಗಾಗಿ ಒಂದು ನಿಖರವಾದ ಚೌಕಟ್ಟನ್ನು ಒದಗಿಸುತ್ತದೆ.
ಇದು ಕೇವಲ ಡೇಟಾವನ್ನು ತೋರಿಸುವ ಸಾಮಾನ್ಯ ಇಂಡಿಕೇಟರ್ ಅಲ್ಲ; ಇದು ರಿಯಲ್-ಟೈಮ್ ಕಾನ್ಫ್ಲುಯೆನ್ಸ್ ಇಂಜಿನ್ ಆಗಿ ಕಾರ್ಯನಿರ್ವಹಿಸುತ್ತದೆ. ಇದು ಮಾರುಕಟ್ಟೆಯ ರಚನೆಯನ್ನು ಮ್ಯಾಪ್ ಮಾಡುತ್ತದೆ ಮತ್ತು ಸಂಭಾವ್ಯ ರಿವರ್ಸಲ್ಗಳನ್ನು ಗುರುತಿಸುತ್ತದೆ.
ಪ್ರಮುಖ ವಿನ್ಯಾಸ ಮತ್ತು ವಿಶುವಲ್ ಇಂಜಿನ್
1. SMI ಇಂಜಿನ್ (Stochastic Momentum Index)
ಮಾರುಕಟ್ಟೆಯ ಅನಗತ್ಯ ಶಬ್ದವನ್ನು (noise) ತೆಗೆದುಹಾಕಲು ಇದನ್ನು ವಿನ್ಯಾಸಗೊಳಿಸಲಾಗಿದೆ.
ನಿಖರವಾದ ಎಂಟ್ರಿ (Precision Entries): ಕ್ರಿಟಿಕಲ್ ಕ್ರಾಸ್ಓವರ್ಗಳು ಸಂಭವಿಸಿದಾಗ ಮಾತ್ರ ಎಕ್ಸಿಕ್ಯೂಶನ್ ಕ್ಯಾಂಡಲ್ ಮೇಲೆ ಸಣ್ಣ ಸಿಗ್ನಲ್ ಡಾಟ್ಗಳನ್ನು (Size: Tiny) ಇದು ಪ್ರದರ್ಶಿಸುತ್ತದೆ.
ಕ್ಲೀನ್ ವಿಶುವಲ್ಸ್: ಚಾರ್ಟ್ನಲ್ಲಿ ಯಾವುದೇ ಗೊಂದಲವಿಲ್ಲದೆ ಕೇವಲ ಶುದ್ಧವಾದ ಬೈ/ಸೆಲ್ ಮೊಮೆಂಟಮ್ ಟ್ರಿಗ್ಗರ್ಗಳನ್ನು ಮಾತ್ರ ಇದು ತೋರಿಸುತ್ತದೆ.
2. DC ಪ್ರೋಟೋಕಾಲ್ (Spatial Pricing & Liquidity Zones)
ಬೆಲೆಯು ಯಾವಾಗಲೂ ಪ್ರೀಮಿಯಂ ಮತ್ತು ಡಿಸ್ಕೌಂಟ್ ವಲಯಗಳ ನಡುವೆ ಚಲಿಸುತ್ತದೆ. ಇದನ್ನು ಡೊಂಚಿಯನ್ ಚಾನಲ್ (DC) ಪ್ರೋಟೋಕಾಲ್ ರಿಯಲ್-ಟೈಮ್ನಲ್ಲಿ ಗುರುತಿಸುತ್ತದೆ.
ಡೈನಾಮಿಕ್ ಗ್ರೇಡಿಯಂಟ್ ಶೇಡಿಂಗ್: 40% ರಿಂದ 100% ಗ್ರೇಡಿಯಂಟ್ ಮ್ಯಾಟ್ರಿಕ್ಸ್ ಬಳಸಿ, ಇದು ಪ್ರೀಮಿಯಂ ಜೋನ್ (ಗಾಢ ಹಸಿರು - ಮಾರಾಟಕ್ಕಾಗಿ) ಮತ್ತು ಡಿಸ್ಕೌಂಟ್ ಜೋನ್ (ಗಾಢ ಕೆಂಪು - ಖರೀದಿಗಾಗಿ) ಅನ್ನು ಗುರುತಿಸುತ್ತದೆ.
ಸ್ಲೋಪ್-ರಿಯಾಕ್ಟಿವ್ ಮಿಡ್ಲೈನ್: ಮಧ್ಯದ ರೇಖೆಯು ಮಾರುಕಟ್ಟೆಯ ದಿಕ್ಕಿಗೆ ಅನುಗುಣವಾಗಿ ಬಣ್ಣವನ್ನು (Lime/Red/Gray) ಬದಲಾಯಿಸುತ್ತದೆ.
3. ಅಲ್ಗಾರಿದಮಿಕ್ ಡೈವರ್ಜೆನ್ಸ್ ಸ್ಕ್ಯಾನರ್
ಬೆಲೆ ಮತ್ತು ಮೊಮೆಂಟಮ್ ನಡುವಿನ ವ್ಯತ್ಯಾಸವನ್ನು (Divergence) ಇದು ಪತ್ತೆಹಚ್ಚುತ್ತದೆ.
ಸ್ವಯಂಚಾಲಿತ ಪತ್ತೆ: ಇದು ರೆಗ್ಯುಲರ್ ಬುಲಿಶ್ ಮತ್ತು ಬೇರಿಶ್ ಡೈವರ್ಜೆನ್ಸ್ಗಳನ್ನು ನಿರಂತರವಾಗಿ ಸ್ಕ್ಯಾನ್ ಮಾಡುತ್ತದೆ.
ವಿಶುವಲ್ ಅಲರ್ಟ್ಗಳು: ಡೈವರ್ಜೆನ್ಸ್ ಪತ್ತೆಯಾದಾಗ ಚಾರ್ಟ್ ಮೇಲೆ 'Dashed' ಲೈನ್ ಮತ್ತು 100% ಅಪಾರದರ್ಶಕ (Opaque) ಲೇಬಲ್ಗಳನ್ನು ತೋರಿಸುತ್ತದೆ.
4. ಲಾಜಿಕಲ್ ಎಕ್ಸಿಕ್ಯೂಟರ್ (Logical Executor)
ಇದು ವೊಲಟಾಲಿಟಿಗೆ ಅನುಗುಣವಾಗಿ ರಿಸ್ಕ್ ಅನ್ನು ನಿರ್ವಹಿಸುತ್ತದೆ.
ATR-ಚಾಲಿತ ರಿಬ್ಬನ್ಗಳು: ಸಿಗ್ನಲ್ ಬಂದ ತಕ್ಷಣ, ಇದು ATR ಆಧಾರಿತ ಸ್ಟಾಪ್ ಲಾಸ್ ಅನ್ನು ಲೆಕ್ಕಾಚಾರ ಮಾಡುತ್ತದೆ.
ಫ್ಯೂಚರ್ ಪ್ರೊಜೆಕ್ಷನ್: ಚಾರ್ಟ್ ಕ್ಲೀನ್ ಆಗಿರಲು, ಈ ರಿಸ್ಕ್ ರಿಬ್ಬನ್ಗಳನ್ನು ಪ್ರಸ್ತುತ ಕ್ಯಾಂಡಲ್ಗಿಂತ 3 ಬಾರ್ಗಳಷ್ಟು ಮುಂದೆ ಪ್ರದರ್ಶಿಸಲಾಗುತ್ತದೆ.
5. ಕ್ವಾಂಟಿಟೇಟಿವ್ H.U.D. (Heads-Up Display)
ಚಾರ್ಟ್ ಮೇಲೆ ಡೇಟಾ ಟರ್ಮಿನಲ್ ಆಗಿ ಕಾರ್ಯನಿರ್ವಹಿಸುತ್ತದೆ:
ಲೈವ್ SMI ಮೌಲ್ಯಗಳು ಮತ್ತು ಮೊಮೆಂಟಮ್ ಸಾರಾಂಶ ("STRONG BULL", "BEARISH", ಇತ್ಯಾದಿ).
ವಾಲ್ಯೂಮ್ ವ್ಯಾಲಿಡೇಶನ್.
ಡೈವರ್ಜೆನ್ಸ್ ಟ್ರ್ಯಾಕಿಂಗ್.
ಲೈವ್ ಟ್ರೇಡ್ ಮೆಟ್ರಿಕ್ಸ್: ರಿಯಲ್-ಟೈಮ್ ರಿಸ್ಕ್ (LIC), ಪ್ರಾಫಿಟ್ (POC), ಮತ್ತು ರಿಸ್ಕ್-ಟು-ರಿವಾರ್ಡ್ (R:R) ಅನುಪಾತಗಳು.
ಎಕ್ಸಿಕ್ಯೂಶನ್ ಪ್ಲೇಬುಕ್ (ಹೇಗೆ ಟ್ರೇಡ್ ಮಾಡಬೇಕು)
🟢 ಪ್ರೋಟೋಕಾಲ್ A: ಡಿಸ್ಕೌಂಟ್ ಸ್ಟ್ರೈಕ್ (Long Entry)
ಬೆಲೆಯು ಡಿಸ್ಕೌಂಟ್ ಜೋನ್ (ಕೆಂಪು ಗ್ರೇಡಿಯಂಟ್) ನಲ್ಲಿರಬೇಕು.
ಬುಲಿಶ್ SMI ಕ್ರಾಸ್ಓವರ್ ಸಂಭವಿಸಬೇಕು (ಕ್ಯಾಂಡಲ್ ಕೆಳಗೆ ಹಸಿರು ಡಾಟ್).
HUD ನಲ್ಲಿ ವಾಲ್ಯೂಮ್ 🟢 ಆಗಿರಬೇಕು.
4. ಲಾಜಿಕಲ್ ಎಕ್ಸಿಕ್ಯೂಟರ್ ಸೂಚಿಸುವ ಕೆಂಪು ATR ಲೈನ್ (LIC) ಅನ್ನು ಸ್ಟಾಪ್ ಲಾಸ್ ಆಗಿ ಬಳಸಿ ಎಂಟ್ರಿ ಪಡೆಯಿರಿ.
🔴 ಪ್ರೋಟೋಕಾಲ್ B: ಪ್ರೀಮಿಯಂ ಸ್ಟ್ರೈಕ್ (Short Entry)
ಬೆಲೆಯು ಪ್ರೀಮಿಯಂ ಜೋನ್ (ಹಸಿರು ಗ್ರೇಡಿಯಂಟ್) ನಲ್ಲಿರಬೇಕು.
ಬೇರಿಶ್ SMI ಕ್ರಾಸ್ಓವರ್ ಸಂಭವಿಸಬೇಕು (ಕ್ಯಾಂಡಲ್ ಮೇಲೆ ಕೆಂಪು ಡಾಟ್).
HUD ನಲ್ಲಿ ವಾಲ್ಯೂಮ್ 🔴 ಆಗಿರಬೇಕು.
ಲಾಜಿಕಲ್ ಎಕ್ಸಿಕ್ಯೂಟರ್ ಸೂಚಿಸುವ ಹಸಿರು ATR ಲೈನ್ (LIC) ಅನ್ನು ಸ್ಟಾಪ್ ಲಾಸ್ ಆಗಿ ಬಳಸಿ ಎಂಟ್ರಿ ಪಡೆಯಿರಿ.
⚖️ ಹಕ್ಕುತ್ಯಾಗ (Risk Disclaimer)
ಶೈಕ್ಷಣಿಕ ಉದ್ದೇಶಗಳಿಗಾಗಿ ಮಾತ್ರ.
GCM SMILE with DC Protocol ಎಂಬುದು ಗಣಿತದ ಸೂತ್ರಗಳನ್ನು ಆಧರಿಸಿದ ಒಂದು ಸಾಧನವಾಗಿದೆ. ಇದು ಯಾವುದೇ ಹೂಡಿಕೆ ಸಲಹೆಯಲ್ಲ. ಹಣಕಾಸು ಮಾರುಕಟ್ಟೆಯಲ್ಲಿನ ವ್ಯಾಪಾರವು ಹೆಚ್ಚಿನ ಅಪಾಯವನ್ನು ಹೊಂದಿರುತ್ತದೆ. ನೀವು ಮಾಡುವ ಯಾವುದೇ ಲಾಭ ಅಥವಾ ನಷ್ಟಕ್ಕೆ ನೀವೇ ಜವಾಬ್ದಾರರಾಗಿರುತ್ತೀರಿ. ಕಳೆದುಕೊಳ್ಳಲು ಸಿದ್ಧವಿರುವ ಹಣವನ್ನು ಮಾತ್ರ ಹೂಡಿಕೆ ಮಾಡಿ.
Strategic Momentum. Masterful Execution. — Powered by uniGram.
HAPPY TRADING
אינדיקטור

אינדיקטור

Machine Learning: Trend Classifier [identityKa]Overview
The Machine Learning: Trend Classifier is a professional-grade algorithmic momentum and trend analysis tool designed for data-driven traders. Unlike traditional moving averages that inherently lag behind live price action, this script introduces a multi-factor mathematical classification engine that evaluates real-time market behavior to predict the true direction of the trend.
Core Mechanics & Detection
The algorithm uses a continuous data-stream calculation to locate major market shifts:
Bullish Classification (Neon Green): Detected when the underlying momentum, volatility, and trend-flow simultaneously show aggressive upward expansion. The dynamic data ribbon shifts to green, encapsulating the price.
Bearish Classification (Neon Red): Detected when the structural momentum shifts downwards. The dynamic ribbon turns red, acting as algorithmic resistance.
Neutral / Chop Zones (Orange): Detected when the market loses clear direction. The engine recognizes this as a friction zone and shifts to a neutral state, warning the trader of potential whipsaws.
The Algorithmic Classification Engine
A fundamental rule of this indicator is the "AI Confidence Score". The engine normalizes multiple indicators (RSI, CCI, and MACD flows) into a strict 0 to 100 percentage scale.
The script constantly monitors this confidence score. If the score is above 20%, a Bullish state is confirmed. If it is below -20%, a Bearish state is confirmed. Anything in between is classified as market noise.
Upon crossing these algorithmic thresholds, the script instantly updates the on-chart Ribbon, ensuring that only statistically significant trend shifts are highlighted for the trader. This keeps the workspace incredibly clean and mathematically sound.
HUD Dashboard & AI Logic
The on-chart intelligence panel evaluates the live market state and generates actionable data:
Dangerous: Displayed actively whenever the current live price is trading inside the Neutral zone (Confidence Score between -20% and 20%). This serves as a warning that the price is in a high-friction area where sharp rejections and false breakouts are imminent.
LONG / SHORT: The engine tracks the macro bias based on the classification state. If the AI Confidence heavily favors upward momentum, the bias shifts to LONG. If the momentum breaks downwards, the bias shifts to SHORT.
How to Use It
This tool provides exceptional context for trade entries and trend following. When the AI Suggestion reads "LONG," traders should look for pullbacks toward the lower band of the green ribbon. When the state reads "Dangerous," it is highly recommended to stay out of the market or tighten stop losses until a clear trend direction is re-established by the algorithm. אינדיקטור

Gold Live DashboardTo trade Gold effectively, you need to understand that it isn't just a commodity; it's the world's oldest anti-currency. It moves based on how much people trust (or distrust) the US Dollar and the return they can get from "risk-free" government debt.
1. The DXY (The "Price Tag" Factor)Gold is priced in US Dollars ($XAU/USD$).The Relationship: Generally Inverse. When the Dollar gets stronger (DXY goes up), Gold becomes more expensive for people using other currencies (like Euros or Yen) to buy. This kills demand and drops the price.The Trade: If the DXY is ripping higher, trying to long Gold is like swimming against a tsunami. You want to see the DXY stalling or dropping before you look for Gold entries.
2. The 2-Year Yield (The "Fed" Factor)The 2-Year Treasury yield is the market’s "crystal ball" for what the Federal Reserve is going to do with interest rates over the next several months.Why it matters: It is highly sensitive to monetary policy. If the 2-Year yield is spiking, the market is pricing in rate hikes or a "higher for longer" stance from the Fed.The Impact: Higher rates make the Dollar more attractive to hold, which indirectly pressures Gold. If the 2-Year yield is falling, the market expects "cheap money" is coming back, which is fuel for Gold.
3. The 10-Year Yield (The "Opportunity Cost" Factor)The 10-Year is the global benchmark for "risk-free" return.The Battle for Cash: Gold is a "non-yielding" asset—it doesn't pay you a monthly check or interest just for holding it.The Logic: If the 10-Year yield is high (say 4.5% or 5%), big institutional investors would rather park their billions in "guaranteed" government bonds than sit on Gold.The Impact: When the 10-Year yield falls, the "opportunity cost" of holding Gold disappears, making it much more attractive for big money to rotate back into the metal.
Summary Table for your
DXY Up 🔴 BAD Makes Gold more expensive globally.
2-YR Up 🔴 BAD Signals the Fed is staying "Hawkish"
10-YR Up🔴 BAD Bonds are paying more; people sell Gold to buy Bonds. אינדיקטור

Ready, Aim, Fire!═════════════════════════════════════════════════════════════
TRADINGVIEW PUBLICATION — Ready, Aim, Fire! - March 19, 2026
════════════════════════════════════════════════════════════D
Ready, Aim, Fire! is a momentum-state oscillator that identifies trade-ready inflection points through a three-phase signal progression.
█ HOW IT WORKS
The indicator combines three independent engines into a unified visual system:
1. STOCHASTIC STATE ENGINE — Three stochastic oscillators (periods 5, 8, and 17) with exponential smoothing track momentum crossovers. Each qualifying crossover advances the state counter:
• READY: First crossover detected. Momentum is coiling.
• AIM: Second consecutive crossover in the same direction. Momentum is loaded and directional bias is strengthening.
2. FISHER TRANSFORM MOMENTUM LINE — A recursive Fisher Transform applied to the slowest stochastic (K17) compresses momentum into a bounded oscillator. The magenta momentum line oscillates above and below zero, providing instant visual confirmation of directional pressure and momentum extremes relative to the overbought/oversold levels.
3. FIRE! SIGNALS — When the Fisher Transform derivative flips sign (momentum inflects), a directional FIRE! label appears:
• Green FIRE! (label up) = bullish inflection — momentum turning upward.
• Red FIRE! (label down) = bearish inflection — momentum turning downward.
These are the original MajorBuy / MajorSell inflection signals with enhanced visual presentation.
█ ADDITIONAL COMPONENTS
• TEMA TREND FILTER — A Triple Exponential Moving Average with ATR buffer determines the prevailing trend state. The zero line color reflects this: green (bullish), red (bearish), or yellow (neutral/transitional).
• ADX STRENGTH MARKERS — Colored squares appear on the zero line when ADX turns upward, confirming trend strength is increasing. The zero line creates a visual gap around each square for clarity.
• BACKGROUND CLOUDS — Shaded zones between the overbought and oversold levels indicate the current phase. Deeper color = AIM (loaded). Lighter color = READY (coiling). Green clouds for bullish cycles, red clouds for bearish cycles.
█ SIGNAL INTERPRETATION
The three-phase progression provides context for each FIRE! signal:
• FIRE! during READY: Momentum is inflecting early in the cycle. Lower conviction — fewer confirming crossovers behind it. Use additional confluence.
• FIRE! during AIM: Momentum is inflecting after multiple crossovers have loaded in the same direction. Higher conviction — the state engine confirms directional bias.
• FIRE! in OB/OS territory: The Fisher line is at an extreme when it inflects. These signals often mark significant turning points.
█ INPUTS AND CUSTOMIZATION
• Smoothing Length (default 28): Controls the TEMA period and ADX calculation. Higher values produce smoother signals with fewer whipsaws.
• Overbought/Oversold Level (default 1.2): Sets the horizontal threshold lines. Adjust based on instrument volatility.
• Toggle controls for FIRE! labels, inflection arrows, READY/AIM labels, ADX markers, and background clouds — customize the visual density to your preference.
• Alert support for FIRE! signals with optional AIM-state filtering.
█ USAGE NOTES
• This indicator is designed as a lower-pane oscillator. It does not overlay on price.
• Works on any liquid market and any timeframe. Developed and tested on micro futures (MNQ, MES, MYM, MGC, MCL) but equally applicable to forex, stocks, crypto, and commodities.
• Best used in confluence with price action, market structure, and your existing methodology — not as a standalone entry system.
• The three-phase progression (READY → AIM → FIRE!) provides a framework for trade preparation, not prediction.
█ ORIGIN
Converted from ThinkScript (ThinkOrSwim) to Pine Script v6 with professional visual enhancements by NPR21. Original momentum-state concept by David H. Starr (© 2010-2020). Pine Script conversion, FIRE! label system, ADX square markers, and all visual design elements are original work by NPR21. אינדיקטור

Chop ShieldThe Chop Shield is an all-in-one market state indicator designed to solve the two biggest problems for intraday traders: over-trading in sideways "chop" and entering breakouts with no institutional backing.
Built specifically for high-speed environments like SPY 0DTE and Tick Charts, this script uses a multi-layered confluence of volatility, momentum, and adaptive volume to "gray out" the noise and highlight high-probability "coiled spring" releases.
### Key Features
Smart "Traffic Light" Candle Coloring:
Slate Blue (#708090): The "Neutral Zone." This triggers during volatility squeezes, low ADX (Average Directional Index), or the mid-day "Lunch Doldrums." If it’s Slate, you stay at your desk.
White/Black High-Contrast Bodies: Once the market breaks out of chop, the candles return to a clean White (Bullish) or Black (Bearish) state.
The Squeeze Engine (Orange Background):
Uses a Bollinger Band/Keltner Channel relationship to identify periods of extreme volatility contraction. These "Squeezes" are the precursor to the largest moves of the day.
High-Confidence "Pressure" Signals:
Green/Red Diamonds: These appear when a candle meets strict price action criteria (70%+ solid body, closing at extremes) paired with high relative volume.
Live Bias Arrows: "BUY/SELL" markers trigger only when the High-Confidence bar aligns with the VWAP Slope and price location.
Adaptive Session Volume (The Yellow Marker):
Standard RVOL indicators are useless at the open because volume is always high. Our Adaptive Logic uses a 2.5x threshold during the 9:30–10:15 AM window and scales down to 1.5x for the rest of the day. If you see a yellow marker, it means volume is truly abnormal for that specific time of day.
Professional Filtering:
RTH Only: Automatically hides all signals and coloring during Pre-Market and Post-Market to keep your chart clean for the opening bell.
Lunch Doldrums: Hard-coded "Gray Zone" between 11:30 AM and 1:30 PM EST to protect you from the lowest-probability trading window.
### How to Trade It
This indicator is best used as a Validation Filter for levels-based strategies (Initial Balance, ORB, or Gap Fills).
The Setup: Identify a Volatility Squeeze (Orange Background) where candles are Slate Blue.
The Trigger: Wait for the Squeeze to end and the candles to turn White or Black.
The Confirmation: Look for a Green/Red Diamond paired with an Adaptive Volume Spike (Yellow "|").
The Exit: Use the Blue VWAP Line as your dynamic trailing stop or mean-reversion target.
### Confluence
Perfect for traders using Edgeful, ICT/SMC concepts, or standard Initial Balance breakouts. It removes the "guesswork" of whether a breakout is real or a low-volume trap. אינדיקטור
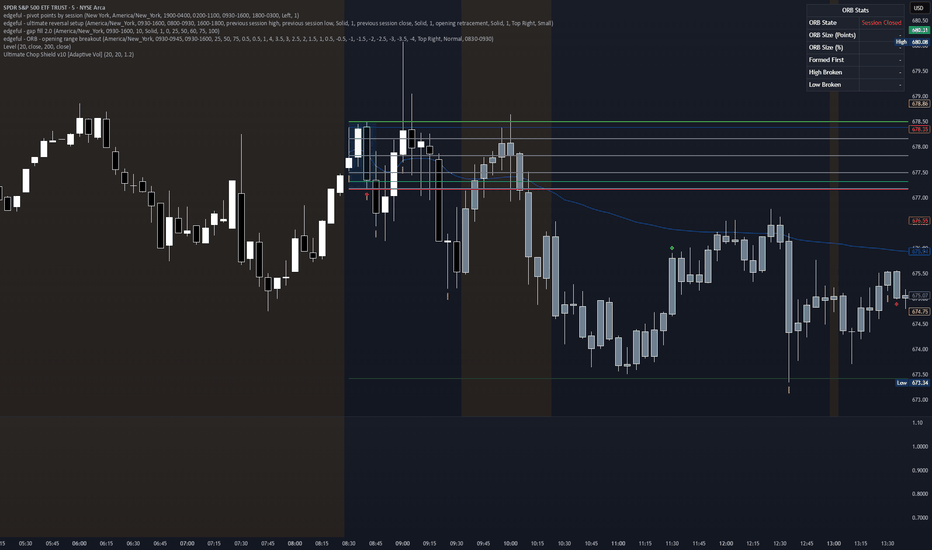
Institutional Decision Engine [JOAT]Institutional Decision Engine
Introduction
The Institutional Decision Engine is a comprehensive, unified trading system that integrates six distinct analytical engines into a cohesive decision-making framework. This is not just another indicator - it's a complete trading intelligence system designed to replicate the analytical approach of institutional trading desks. By combining market regime classification, structural analysis, momentum pressure, volatility intelligence, directional bias, and signal qualification into one unified system, this engine provides the holistic market analysis that professional traders rely on for consistent success.
This tool is built for serious traders who understand that successful trading requires multiple layers of analysis and confirmation. Whether you're a systematic trader needing a complete decision framework, a discretionary trader seeking comprehensive market intelligence, or an algorithm developer requiring robust signal generation, this engine provides the institutional-grade analysis needed to trade with the confidence and precision of professional market participants.
Why This Engine Exists
Most traders use fragmented indicators that provide conflicting signals, leading to confusion and poor decisions. This engine solves that fundamental problem by:
Unified Framework: Six engines working together as one cohesive system
Regime-Adaptive Logic: Automatically adjusts analysis based on market conditions
Multi-Layer Confirmation: Requires confluence across multiple analytical dimensions
Signal Qualification: Objectively scores and grades every potential signal
Risk Intelligence: Dynamic risk management based on market volatility and structure
Visual Clarity: Comprehensive visualization of all analytical components
The engine transforms the chaotic world of multiple indicators into a single, unified source of market truth that provides clear, actionable trading intelligence.
Core Components Explained
Engine 1: Market Regime Classification
The first engine identifies the current market environment:
// Regime Classification: 0=Neutral, 1=Trending, 2=Ranging, 3=Volatile
int market_regime = 0
if volatility_state == 1 and adx_value < i_trend_threshold
market_regime := 3 // Volatile Expansion
else if adx_value >= i_trend_threshold
market_regime := 1 // Trending
else if volatility_state == -1
market_regime := 2 // Ranging/Consolidation
// Regime Strength (0-100)
float regime_strength = 0.0
if market_regime == 1
regime_strength := math.min(adx_value / 50.0 * 100, 100)
else if market_regime == 2
regime_strength := math.min((1 - volatility_ratio) / (1 - i_contraction_mult) * 100, 100)
Regime types:
Trending: Strong directional markets with ADX > 25
Ranging: Low volatility consolidation phases
Volatile: High volatility, chaotic conditions
Neutral: Transition periods between defined states
Regime Strength: How strongly the market exhibits regime characteristics
Regime classification determines which strategies are appropriate and how risk should be managed.
Engine 2: Structural Behavior Analysis
The second engine maps market structure and key levels:
// Structure Analysis
bool higher_high = not na(last_swing_high) and not na(prev_swing_high) and last_swing_high > prev_swing_high
bool lower_low = not na(last_swing_low) and not na(prev_swing_low) and last_swing_low < prev_swing_low
bool higher_low = not na(last_swing_low) and not na(prev_swing_low) and last_swing_low > prev_swing_low
bool lower_high = not na(last_swing_high) and not na(prev_swing_high) and last_swing_high < prev_swing_high
// Structure Score (0-100)
float structure_score = 0.0
structure_score += structure_bias == 1 ? 30 : structure_bias == -1 ? 0 : 15
structure_score += higher_high ? 20 : lower_low ? 0 : 10
structure_score += bos_bullish ? 30 : bos_bearish ? 0 : 15
Structure components:
Swing Points: Key highs and lows defining market structure
Market Structure: Higher highs/higher lows (bullish) or lower highs/lower lows (bearish)
Break of Structure: Confirmation of trend changes
Liquidity Zones: Equal highs/lows where orders cluster
Structure Score: Quantifies structural quality (0-100)
Structural analysis identifies the levels where professional traders place orders.
Engine 3: Momentum Pressure Analysis
The third engine measures buying and selling pressure:
// Composite Momentum Score
float momentum_bull_score = 0.0
momentum_bull_score += wt_bullish ? 25 : 0
momentum_bull_score += rsi_bullish ? 25 : 0
momentum_bull_score += weighted_pressure > 0.1 ? 25 : weighted_pressure > 0 ? 12.5 : 0
momentum_bull_score += macd_bullish ? 25 : 0
// Net Momentum State
float net_momentum = momentum_bull_score - momentum_bear_score
int momentum_state = net_momentum > 25 ? 1 : net_momentum < -25 ? -1 : 0
Momentum components:
WaveTrend: Trend-following momentum oscillator
RSI: Relative strength with momentum filter
Pressure Analysis: Volume-weighted buying/selling pressure
MACD: Trend acceleration and deceleration
Momentum State: Bullish, bearish, or neutral momentum
Momentum analysis confirms the strength and timing of potential moves.
Engine 4: Volatility Intelligence Layer
The fourth engine analyzes volatility cycles and squeezes:
// Squeeze Detection
bool squeeze_on = bb_lower > kc_lower and bb_upper < kc_upper
bool squeeze_off = bb_lower < kc_lower or bb_upper > kc_upper
// Volatility Cycle Phase
int vol_cycle_phase = 0
if squeeze_on and squeeze_duration > 5
vol_cycle_phase := 1 // Compression
else if squeeze_off and squeeze_duration > 0
vol_cycle_phase := 2 // Expansion Trigger
else if volatility_ratio > 1.2
vol_cycle_phase := 3 // Active Expansion
// Adaptive Multipliers
float stop_multiplier = vol_cycle_phase == 3 ? 1.5 : vol_cycle_phase == 1 ? 0.8 : 1.0
float target_multiplier = vol_cycle_phase == 3 ? 1.3 : vol_cycle_phase == 1 ? 1.5 : 1.0
Volatility components:
Bollinger Bands: Standard deviation-based volatility
Keltner Channels: ATR-based volatility
Squeeze Detection: Volatility compression patterns
Cycle Phases: Compression, trigger, expansion, normal
Adaptive Multipliers: Dynamic risk adjustments
Volatility intelligence ensures risk management adapts to market conditions.
Engine 5: Directional Bias Model
The fifth engine establishes directional conviction:
// Bias Computation
float bullish_bias = 0.0
bullish_bias += ma_bullish_stack ? 30 : 0
bullish_bias += price_above_structure ? 20 : 0
bullish_bias += close > ma_anchor ? 15 : 0
bullish_bias += pos_di > neg_di ? 20 : 0
bullish_bias += slopes_aligned_bull ? 15 : 0
// Net Bias
float net_bias = bullish_bias - bearish_bias
int bias_direction = net_bias > i_bias_threshold / 2 ? 1 : net_bias < -i_bias_threshold / 2 ? -1 : 0
Bias components:
MA Stack: Fast/slow/anchor moving average relationships
Price Position: Where price sits relative to MAs
ADX Direction: +DI vs -DI for trend confirmation
MA Slopes: Directional momentum of moving averages
Bias Strength: 0-100 indicating directional conviction
Directional bias provides the primary directional framework for trading decisions.
Engine 6: Signal Qualification System
The sixth engine evaluates and qualifies all signals:
// Confluence Scoring
int bull_confluence = 0
bull_confluence += market_regime == 1 and trend_direction == 1 ? 2 : 0
bull_confluence += structure_bias == 1 ? 1 : 0
bull_confluence += bos_bullish ? 1 : 0
bull_confluence += momentum_state == 1 ? 2 : 0
bull_confluence += bias_direction == 1 ? 2 : 0
bull_confluence += squeeze_off and net_momentum > 0 ? 1 : 0
// Qualification Check
bool bull_qualified = bull_confluence >= i_min_confluence
bool bear_qualified = bear_confluence >= i_min_confluence
// Final Signal Generation
bool long_signal = bull_qualified and bull_trigger and bars_since_bull > i_signal_cooldown and
bar_confirmed and market_regime != 3
Qualification components:
Confluence Score: Points from each engine (max 10)
Minimum Threshold: Required confluence for signals (default: 5)
Signal Triggers: Entry conditions (crossovers, breakouts, etc.)
Cooldown Management: Prevents overtrading
Quality Grades: A-D grades based on confluence score
Signal qualification ensures only high-probability setups are traded.
Visual Elements
Directional Cloud: Dynamic cloud showing trend and conviction
Signal Markers: Clear entry signals with quality grades
Risk Levels: Visual stop loss and target levels
Structure Points: Marked swing highs and lows
Squeeze Background: Volatility compression indication
Signal Background: Signal strength background shading
Moving Averages: Color-coded MA system
Dashboard: Comprehensive intelligence panel
The dashboard displays:
1. Current market regime and strength
2. Trend direction and bias scores
3. Momentum state and pressure readings
4. Volatility cycle and squeeze status
5. Structure analysis and bias
6. Signal qualification and grade
7. Risk metrics and multipliers
8. Active position information
Input Parameters
Regime Engine:
ADX Period: Trend strength calculation (default: 14)
Trend Threshold: Minimum ADX for trend (default: 25)
Volatility Multipliers: Expansion/contraction thresholds
Structure Engine:
Swing Sensitivity: Pivot detection sensitivity (default: 10)
Structure Confirmation: Bars for confirmation (default: 3)
Show Liquidity: Display liquidity zones
Momentum Engine:
Pressure Period: Pressure calculation (default: 14)
WaveTrend Settings: Channel and average periods
RSI Period: Momentum oscillator (default: 14)
Volatility Layer:
Bollinger Settings: Period and deviation
Keltner Settings: Period and multiplier
Adaptive Stops: Enable dynamic stops
Signal Qualification:
Minimum Confluence: Required score (default: 5)
Signal Cooldown: Bars between signals (default: 5)
Minimum R:R: Risk/reward requirement (default: 1.5)
How to Use This Engine
Step 1: Understand Market Regime
Check the dashboard for current regime. Avoid trading in volatile regimes (red), focus on trending regimes (green), and adapt strategy for ranging regimes (purple).
Step 2: Assess Directional Bias
Look for strong bias scores (>60) with MA stack confirmation. The bias should be clear across multiple components before considering entries.
Step 3: Confirm Momentum
Ensure momentum supports the directional bias. Look for pressure in the direction of trade and momentum acceleration.
Step 4: Verify Structure
Entries near structural levels have higher probability. Look for BOS confirmation and avoid trading against established structure.
Step 5: Check Volatility
Be aware of volatility cycles. Squeeze releases offer high-probability breakout opportunities. Adjust stops based on volatility multipliers.
Step 6: Qualify Signals
Only take signals with 5+ confluence points. A-grade signals (8+ points) offer the highest probability and deserve larger position sizing.
Best Practices
Always trade in the direction of the dominant bias
Higher confluence scores mean higher probability setups
Respect regime changes - they signal strategy adjustments
Use the directional cloud as primary trend guidance
Place stops using the volatility-adjusted levels
Scale out at multiple targets as provided
Avoid trading during volatile regimes unless experienced
Wait for A-grade setups rather than forcing mediocre trades
Keep a trade journal tracking regime/bias combinations
Never override the system's risk management without strong reason
Strategy Integration
This engine is a complete trading system:
Use signal qualification as primary entry filter
Apply regime-based position sizing
Import bias scores for trend confirmation
Use structure levels for stop placement
Integrate volatility multipliers for risk management
Export all engine outputs for custom strategies
Technical Implementation
Built with Pine Script v6 featuring:
Six-engine architecture with unified signal processing
Advanced regime detection with ADX/ATR analysis
Comprehensive structure analysis with swing detection
Multi-factor momentum scoring system
Volatility cycle analysis with squeeze detection
Directional bias calculation with multiple confirmations
Signal qualification with confluence scoring
Dynamic risk management with adaptive multipliers
Comprehensive visualization with directional cloud
Real-time dashboard with 12 key metrics
Export functions for complete system integration
The code uses confirmed bars throughout to prevent repainting and ensure reliable signals.
Originality Statement
This engine is original in its comprehensive integration of six distinct analytical systems into a unified decision framework. While individual components (ADX, moving averages, RSI, etc.) are established tools, this engine is justified because:
It synthesizes six independent analytical engines into one cohesive system
The regime-adaptive logic automatically adjusts behavior based on market conditions
Signal qualification provides objective, numerical evaluation of trade quality
The directional cloud visualization offers intuitive trend analysis
Dynamic risk management adapts to volatility and structure
Comprehensive dashboard presents all critical metrics in one view
Each engine contributes unique insights: regime shows when to trade, structure shows where, momentum shows timing, volatility shows how much, bias shows direction, and qualification shows quality
The engine solves the real problem of indicator overload and conflicting signals
Export functions enable complete system integration and customization
This is institutional-grade analysis typically available only to professional traders
The engine's value lies in providing a complete, unified trading intelligence system that eliminates analysis paralysis and provides clear, actionable signals based on comprehensive market analysis.
Disclaimer
This engine is provided for educational and informational purposes only. It is not financial advice or a recommendation to buy or sell any financial instrument. This is a comprehensive analysis tool, not a guaranteed profit system.
Even with comprehensive analysis, markets can behave unpredictably due to news events, economic data, or changes in market structure. Past performance of the system does not guarantee future results. The engine's signals are mathematical calculations based on historical patterns and should be used with proper risk management.
Always use stop losses and position sizing appropriate for your account size and risk tolerance. Never risk more than you can afford to lose on any single trade, regardless of signal quality or confluence score.
The author is not responsible for any losses incurred from using this engine. Users assume full responsibility for all trading decisions made using this system.
-Made with passion by officialjackofalltrades
אינדיקטור

Viprasol Multi-Timeframe Trend Signal EngineOverview
The Multi-Timeframe Trend Signal Engine is a comprehensive overlay indicator that combines SuperTrend signals, a 5-EMA trend ribbon, EMA cloud, chaos trend line, order blocks, and an RSI-based take profit system with a 6-timeframe ADX trend dashboard. The core system — originally developed by Zakaria Safri — is a mature, feature-rich trading toolkit. This version adds a confluence quantification layer that transforms the dashboard's six independent timeframe readings into a single scored consensus metric, turning passive multi-timeframe observation into an actionable alignment signal.
How It Works
SuperTrend Signal Engine:
A custom SuperTrend calculation generates buy and sell signals using ATR-based dynamic bands. All signals require bar-close confirmation to prevent repainting on confirmed bars. Two modes are available: "All Signals" shows every crossover, while "Filtered Signals" adds an EMA gate requiring price to be above (for buys) or below (for sells) the main EMA before a signal qualifies.
Multi-Timeframe ADX Dashboard:
The indicator fetches ADX trend quality from six timeframes (5m, 15m, 1H, 4H, 12H, Daily) using an anti-repaint security pattern (previous bar value with lookahead — confirmed bars only). Each timeframe is classified as Bullish, Bearish, or Neutral based on an adaptive threshold derived from the median ADX value multiplied by a configurable factor. This means trend classification adjusts to the instrument's own volatility regime rather than relying on fixed levels.
MTF Confluence Score (Viprasol Addition):
The six individual timeframe trend readings are aggregated into a Confluence Score ranging from 0 to 6. The score counts how many timeframes currently show a bullish ADX trend. A separate bear confluence count tracks bearish alignment independently. The score is color-coded in the dashboard: green at 5-6 (strong bullish consensus), yellow at 3-4 (mixed), red at 0-2 (weak or bearish-dominant). This transforms what would otherwise be six separate readings requiring manual interpretation into a single quantified alignment metric. Two dedicated alert conditions fire when 5 or more timeframes agree on direction, providing automated detection of high-confluence setups.
Trend Ribbon:
Five EMAs (20, 25, 35, 45, 55) form a color-coded ribbon. The ribbon is bullish when the fastest EMA leads and bearish when it trails, shifting state on crossover. It provides a visual trend context layer independent of the SuperTrend signal system.
EMA Cloud:
A 150/250 EMA cloud identifies longer-term structural trend direction. Green fill indicates bullish structure, red fill indicates bearish structure. This serves as a backdrop for assessing whether shorter-term signals align with the broader trend.
Chaos Trend Line:
An adaptive trend line using pivot-based detection with ATR channels. It tracks the prevailing trend using highest and lowest pivot levels and changes color on confirmed reversals, providing another independent trend perspective.
Order Blocks:
Structural order blocks based on pivot break-of-structure logic. Bullish order blocks form at swing lows when higher highs break structure; bearish order blocks form at swing highs when lower lows break structure. Boxes fade when price tests them and are removed when fully invalidated.
RSI Take Profit System:
A sequential TP system using RSI crossovers at configurable levels (default 70/85/100 for bullish, 30/15/5 for bearish). Each TP level only fires after the previous one has triggered within the current signal cycle, creating a staged exit framework. TP1 must trigger before TP2 becomes active, and TP2 before TP3.
Reversal Signals:
A 25-period RSI-based reversal detector that fires when RSI crosses above the oversold level or below the overbought level, using bar-close confirmation.
Risk Management Lines:
Visual-only TP and SL lines plotted relative to entry price. These are for reference only and do not execute trades.
Key Features
- SuperTrend buy/sell signals with bar-close confirmation (no repainting on confirmed bars)
- Two signal modes: All Signals and EMA-Filtered Signals
- 6-timeframe ADX trend dashboard (5m, 15m, 1H, 4H, 12H, Daily)
- MTF Confluence Score (0-6) quantifying multi-timeframe bullish/bearish alignment
- 5-EMA trend ribbon with directional color coding
- EMA 150/250 cloud for structural trend context
- Adaptive chaos trend line with pivot-based detection
- Structural order blocks with fade-on-test and auto-invalidation
- RSI-based sequential take profit system (TP1, TP2, TP3)
- Visual TP/SL risk management lines
- RSI reversal signals at extreme levels
- Channel breakout levels from pivot highs and lows
- Three candle coloring modes (Scalper RSI, Trend Ribbon, EMA Direction)
- RSI background zones for overbought/oversold visualization
- Configurable dashboard position and font size
- All visual elements individually toggleable
- 10 alert conditions with dynamic messages
How to Use
Reading the Dashboard:
Start with the MTF Confluence Score. A score of 5-6 out of 6 indicates strong multi-timeframe bullish alignment — the majority of timeframes from 5-minute through Daily are trending in the same direction. A score of 0-1 indicates strong bearish alignment. Scores of 3-4 represent mixed conditions where caution is warranted. The individual timeframe rows below the score show exactly where agreement and disagreement exist, letting you identify which timeframes are diverging.
Signal Workflow:
Use "Filtered Signals" mode for higher-quality entries that align with the main EMA direction. Use "All Signals" mode when you want to capture more frequent opportunities in ranging or transitional markets. Reversal signals (purple labels) flag potential exhaustion at RSI extremes. The sequential TP markers (TP1, TP2, TP3) provide staged exit targets based on RSI momentum progression.
Combining Confluence with Signals:
The confluence score is most valuable as a directional filter. A buy signal firing when the confluence score is 5 or 6 carries more weight than one firing at a score of 2. Similarly, a sell signal at confluence 0 or 1 has stronger multi-timeframe backing. This is the core analytical addition — rather than visually scanning six rows, you get a single number that quantifies alignment strength.
Suggested Starting Points:
- Scalping (1m-5m): Sensitivity 2.0, ATR Factor 8, Filtered mode
- Intraday (15m-1H): Sensitivity 2.5, ATR Factor 11, All Signals mode
- Swing (4H-1D): Sensitivity 3.0, ATR Factor 14, Filtered mode
Settings
Main Settings — Sensitivity (controls signal frequency), Signal Mode (All or Filtered), ATR Factor (band width)
Trend Settings — Toggle trend ribbon, EMA cloud, chaos trend line, order blocks; configurable main EMA period
Signal Settings — Show/hide buy-sell signals, candle coloring mode selection, RSI background zones, channel breakouts
Dashboard Settings — Show/hide dashboard, position selection, font size
Risk Management — Visual-only TP/SL lines, TP strength multiplier, individual TP level toggles
Alerts
1. Buy Signal — SuperTrend crossover buy confirmed at bar close
2. Sell Signal — SuperTrend crossover sell confirmed at bar close
3. Filtered Buy — Buy signal with price above main EMA
4. Filtered Sell — Sell signal with price below main EMA
5. Reversal Up — RSI crosses above oversold level
6. Reversal Down — RSI crosses below overbought level
7. Ribbon Turned Bullish — EMA ribbon state change to bullish (edge-detected, fires once on crossover bar)
8. Ribbon Turned Bearish — EMA ribbon state change to bearish (edge-detected, fires once on crossover bar)
9. Strong Bullish MTF Alignment — 5+ of 6 timeframes showing bullish ADX trend
10. Strong Bearish MTF Alignment — 5+ of 6 timeframes showing bearish ADX trend
All alerts include dynamic message variables: {{ticker}}, {{close}}, and {{interval}}.
Limitations & Disclaimer
- MTF data uses the anti-repaint pattern (previous bar value with lookahead) to avoid repainting on confirmed bars. The current bar's data updates in real-time until that bar closes.
- ADX trend classification uses an adaptive threshold (median ADX multiplied by a configurable factor). "Neutral" readings are relative to the instrument's recent volatility, not fixed levels. This means the same ADX value may be classified differently across instruments or time periods.
- The RSI TP system is sequential — TP2 only becomes active after TP1 fires, and TP3 after TP2. If TP1 never triggers during a signal cycle, later levels will not fire.
- Order blocks use a simplified break-of-structure method based on 3-bar pivots. They are structural levels, not institutional order flow data.
- The Risk Management TP/SL lines are visual references only — they do not place or manage trades.
- This indicator is for educational and analytical purposes only. It is not financial advice. Always use proper risk management and validate signals with your own analysis. Test on a demo account before live trading.
Credits & Attribution
This script is derived from "Multi-Timeframe Trend Indicator with Signals" v4.4 by Zakaria Safri. The original is a substantial, feature-rich indicator that provides the SuperTrend signal engine, 5-EMA trend ribbon, EMA cloud, chaos trend line, 6-timeframe ADX dashboard, order block detection, RSI sequential take profit system, TP/SL risk management lines, reversal signals, channel breakout levels, three candle coloring modes, volatility measurement, and 8 alert conditions. The vast majority of the analytical logic in this script is Zakaria Safri's work.
Viprasol's additions: MTF Confluence Score (aggregating 6 timeframe readings into a 0-6 quantified alignment metric with color coding), separate bear confluence tracking, MTF alignment alerts (firing at 5+ timeframe agreement), and ribbon trend change alerts using edge detection for single-bar precision. These additions layer a confluence quantification system on top of the original's multi-timeframe dashboard.
Published open-source per TradingView House Rules governing derivative works of open-source scripts. אינדיקטור

Signal Qualification Engine [JOAT]Signal Qualification Engine
Introduction
The Signal Qualification Engine is a sophisticated multi-layer signal filtering system designed to identify high-probability trading opportunities through comprehensive confluence analysis. This indicator solves the universal trading problem of signal quality - not all signals are created equal, and distinguishing between mediocre setups and high-probability opportunities is what separates successful traders from the crowd. By evaluating signals across trend, momentum, volume, and structure layers, this engine provides institutional-grade signal qualification that helps traders focus only on the best opportunities.
This tool is built for traders who understand that edge in trading comes from the confluence of multiple factors rather than any single indicator. Whether you're a discretionary trader looking for confirmation, a systematic trader needing signal filtering, or an algorithm developer requiring quality scoring, this engine provides the comprehensive analysis needed to elevate your trading from random signals to systematic, high-quality setups.
Why This Indicator Exists
Most traders struggle with signal overload - too many signals, varying quality, and no systematic way to evaluate them. This indicator addresses that critical problem by:
Multi-Layer Analysis: Evaluates signals across four independent analytical layers
Quality Scoring: Provides objective, numerical quality scores for every signal
Confluence Detection: Identifies when multiple factors align for high-probability setups
Risk/Reward Validation: Ensures signals offer adequate profit potential relative to risk
Premium Signals: Flags exceptional setups with maximum confluence
Visual Zones: Shows entry zones, stop levels, and targets for clear risk management
The engine transforms subjective signal evaluation into an objective, systematic process that can be consistently applied across all market conditions and instruments.
Core Components Explained
1. Trend Analysis Layer
The trend layer evaluates the directional bias using multiple trend indicators:
// Trend scoring
int trend_bull_score = 0
int trend_bear_score = 0
// Moving average analysis
if price_above_fast_ma
trend_bull_score += 1
if price_above_slow_ma
trend_bull_score += 1
if ma_bullish_cross
trend_bull_score += 1
// ADX analysis
if adx > i_adx_thresh
trend_bull_score += plus_di > minus_di ? 2 : 0
trend_bear_score += minus_di > plus_di ? 2 : 0
Trend components:
Price vs MAs: Position relative to fast and slow moving averages
MA Crossovers: Recent trend changes and confirmation
ADX Strength: Trend strength above threshold (default 25)
Directional Movement: +DI vs -DI for trend direction
Trend Score: Cumulative trend strength (0-5 points)
The trend layer ensures we only trade in the direction of the established trend or during trend changes with confirmation.
2. Momentum Analysis Layer
Momentum is evaluated through multiple oscillators to ensure optimal timing:
// Momentum scoring
int momentum_bull_score = 0
int momentum_bear_score = 0
// RSI analysis
if rsi > 50 and rsi < 70 and rsi > rsi
momentum_bull_score += 1
if rsi < 50 and rsi > 30 and rsi < rsi
momentum_bear_score += 1
// Stochastic analysis
if stoch_k > stoch_d and stoch_k < 80
momentum_bull_score += 1
if stoch_k < stoch_d and stoch_k > 20
momentum_bear_score += 1
// MACD analysis
if macd_hist > 0 and macd_hist > macd_hist
momentum_bull_score += 1
if macd_hist < 0 and macd_hist < macd_hist
momentum_bear_score += 1
Momentum components:
RSI Direction: Momentum direction with overbought/oversold filters
Stochastic Crossovers: Entry timing with extreme level avoidance
MACD Histogram: Trend acceleration and deceleration
Momentum Score: Cumulative momentum strength (0-3 points)
Divergence Detection: Price/momentum divergences for early signals
The momentum layer ensures we enter when momentum supports our directional bias.
3. Volume Analysis Layer
Volume confirms the strength and conviction behind price movements:
// Volume analysis
float vol_sma = ta.sma(volume, 20)
float vol_ratio = vol_sma > 0 ? volume / vol_sma : 1.0
bool above_avg_vol = volume > vol_sma * 1.2
bool high_vol_session = session_vol_ratio > 1.5
// Volume scoring
int volume_score = 0
if above_avg_vol
volume_score += 1
if high_vol_session
volume_score += 1
if vol_ratio > 1.5
volume_score += 1
Volume components:
Volume Ratio: Current volume relative to 20-period average
Above Average Volume: Confirms signal strength (20% above average)
Session Volume Analysis: Compares current volume to historical session averages
Volume Score: Cumulative volume confirmation (0-3 points)
Volume Spike Detection: Exceptional volume that may signal institutional activity
The volume layer ensures signals have sufficient participation to be reliable.
4. Structure Analysis Layer
Structure identifies key levels where professional traders place orders:
// Structure analysis
float swing_high = ta.pivothigh(high, i_swing_left, i_swing_right)
float swing_low = ta.pivotlow(low, i_swing_left, i_swing_right)
bool near_resistance = math.abs(close - nearest_resistance) / close * 100 < i_level_proximity
bool near_support = math.abs(close - nearest_support) / close * 100 < i_level_proximity
bool sweep_high = high > nearest_resistance and close < nearest_resistance
bool sweep_low = low < nearest_support and close > nearest_support
Structure components:
Swing Points: Key highs and lows defining market structure
Level Proximity: Distance to nearest support/resistance
Liquidity Sweeps: Price moves beyond levels that quickly reverse
Break of Structure: Confirms trend changes
Structure Score: Cumulative structural confirmation (0-3 points)
The structure layer ensures entries occur at technically significant levels.
5. Signal Qualification System
All layers combine to produce a comprehensive qualification score:
// Total scores (max 14)
int bull_total = (
trend_bull_score + momentum_bull_score + volume_score + structure_score +
(near_support ? 1 : 0) + (sweep_low ? 1 : 0) + (rr_ratio >= i_min_rr ? 1 : 0)
)
int bear_total = (
trend_bear_score + momentum_bear_score + volume_score + structure_score +
(near_resistance ? 1 : 0) + (sweep_high ? 1 : 0) + (rr_ratio >= i_min_rr ? 1 : 0)
)
Qualification criteria:
Trend Score (0-5 points): Directional bias strength
Momentum Score (0-3 points): Timing confirmation
Volume Score (0-3 points): Participation confirmation
Structure Score (0-3 points): Level confirmation
Level Proximity (1 point): Entry at key level
Liquidity Sweep (1 point): Institutional activity
Risk/Reward (1 point): Adequate profit potential
Maximum Score: 14 points for perfect confluence
6. Quality Grading System
Signals are graded based on their qualification score:
// Quality grades
string bull_grade = bull_total >= 12 ? "A+" :
bull_total >= 10 ? "A" :
bull_total >= 8 ? "B" :
bull_total >= 6 ? "C" : "D"
string bear_grade = bear_total >= 12 ? "A+" :
bear_total >= 10 ? "A" :
bear_total >= 8 ? "B" :
bear_total >= 6 ? "C" : "D"
Grade meanings:
A+ (12-14 points): Exceptional setup with maximum confluence
A (10-11 points): High-quality setup with strong confluence
B (8-9 points): Good setup with moderate confluence
C (6-7 points): Acceptable setup with basic confluence
D (0-5 points): Weak setup, avoid trading
Only B-grade and above signals are typically considered for trading.
7. Risk/Reward Validation
Each signal is validated for adequate profit potential:
// Risk/Reward calculation
float atr_val = ta.atr(14)
float stop_distance = atr_val * i_stop_mult
float target_distance = atr_val * i_target_mult
float rr_ratio = target_distance / stop_distance
// RR validation
bool valid_rr = rr_ratio >= i_min_rr
RR features:
ATR-Based Stops: Dynamic stop placement based on volatility
Multiple Targets: Primary and secondary profit targets
Minimum RR Ratio: Configurable minimum (default 1.5:1)
RR Validation: Signals without adequate RR are disqualified
Visual Targets: Clear stop and target levels on chart
Visual Elements
Signal Markers: Clear entry signals with quality grades
Entry Zones: Shaded areas showing optimal entry regions
Risk Levels: Visual stop loss and target levels
Quality Meter: Real-time confluence score display
Background Colors: Signal strength background shading
Dashboard: Comprehensive metrics panel
Premium Signals: Special markers for A+ grade setups
The dashboard displays:
1. Current signal qualification scores
2. Quality grades and confluence percentages
3. Individual layer scores (trend, momentum, volume, structure)
4. Risk/Reward ratio and validation status
5. Nearest support/resistance levels
6. Volume analysis and session context
7. Signal cooldown status
8. Premium signal indicators
Input Parameters
Trend Settings:
Fast MA Period: Short-term trend (default: 21)
Slow MA Period: Medium-term trend (default: 55)
ADX Period: Trend strength (default: 14)
ADX Threshold: Minimum trend strength (default: 25)
Momentum Settings:
RSI Period: Momentum oscillator (default: 14)
Stochastic K/D: Entry timing (default: 14/3)
MACD Fast/Slow/Signal: Trend acceleration (default: 12/26/9)
Structure Settings:
Swing Left/Right: Pivot point detection (default: 10/5)
Level Proximity %: Distance to key levels (default: 0.5%)
Max Levels: Maximum swing levels to track (default: 20)
Qualification Settings:
Minimum Score: Required qualification score (default: 6)
Signal Cooldown: Bars between signals (default: 5)
Minimum R:R: Required risk/reward ratio (default: 1.5)
Require Confirmation: Wait for bar close (default: true)
How to Use This Indicator
Step 1: Monitor Signal Quality
Watch for B-grade or higher signals. A-grade signals offer the highest probability but occur less frequently. Focus on quality over quantity - one A-grade signal is worth ten C-grade signals.
Step 2: Verify Layer Alignment
Check the dashboard to see which layers are contributing to the signal. The best signals have confirmation from all four layers (trend, momentum, volume, structure).
Step 3: Assess Risk/Reward
Ensure the signal offers adequate profit potential. The indicator automatically validates RR ratios, but you should manually verify that targets make sense in the current market context.
Step 4: Time Entry with Structure
Use the entry zones and structure levels to time your entry precisely. The best entries occur when price is near key support/resistance levels or after liquidity sweeps.
Step 5: Manage Risk Dynamically
Use the visual stop and target levels as guidelines, but adjust based on your personal risk tolerance and account size. Never risk more than you're comfortable losing.
Step 6: Track Premium Signals
Pay special attention to A+ grade premium signals. These rare setups with maximum confluence often lead to the largest moves and deserve larger position sizes.
Best Practices
Be patient for A-grade signals rather than forcing mediocre trades
Use the qualification score as your primary filter - ignore signals below your minimum threshold
Combine with your own analysis for additional confirmation
Adjust the minimum score based on market conditions - higher in choppy markets, lower in strong trends
Keep a trade journal to track which grade performs best in each market condition
Use the cooldown period to avoid overtrading - quality signals require patience
Pay attention to volume confirmation - signals without volume support often fail
Structure is key - signals at major levels have higher success rates
Liquidity sweeps provide high-probatility reversal opportunities
Always respect the risk/reward validation - poor RR setups destroy accounts
Strategy Integration
This indicator is designed to enhance any trading system:
Use as a signal filter for existing strategies
Import quality scores to weight trade decisions
Combine with trend-following systems for entry timing
Use structure levels for stop placement in other systems
Integrate volume analysis for signal confirmation
Apply risk/reward validation to all trades
Use premium signals as standalone trade opportunities
Export layer scores for custom signal development
The indicator includes 12 export functions for integration:
Bull/Bear Score Export: Total qualification scores
Quality Grade Export: Letter grade as numeric value
Trend Score Export: Trend layer score
Momentum Score Export: Momentum layer score
Volume Score Export: Volume layer score
Structure Score Export: Structure layer score
RR Ratio Export: Current risk/reward ratio
Signal Export: Binary signal output
Premium Signal Export: A+ grade signal flag
Technical Implementation
Built with Pine Script v6 featuring:
Multi-layer signal analysis across four independent systems
Dynamic qualification scoring with configurable weights
Advanced market structure detection with pivot points
Volume analysis with session context
Risk/reward validation with ATR-based calculations
Comprehensive visualization with entry zones and risk levels
Real-time dashboard with 12 key metrics
Alert conditions for all signal types and grades
Export functions for strategy integration
Premium signal detection for exceptional setups
The code uses confirmed bars for all calculations to prevent repainting and ensure reliable signals.
Originality Statement
This indicator is original in its comprehensive approach to signal qualification and multi-layer confluence analysis. While individual components (RSI, MACD, ADX, etc.) are established tools, this indicator is justified because:
It synthesizes four distinct analytical layers into a unified qualification system
The scoring system provides objective, numerical signal evaluation
Quality grading transforms subjective analysis into systematic decision-making
Risk/reward validation ensures only profitable setups are considered
Structure analysis integration provides context for market microstructure
Volume layer adds confirmation often missing from signal systems
Premium signal detection identifies exceptional opportunities
Comprehensive visualization makes complex analysis accessible
Export functions enable integration with any trading system
Each layer contributes unique insights: trend provides direction, momentum provides timing, volume provides confirmation, and structure provides context
The indicator's value lies in transforming signal evaluation from art to science - providing traders with a systematic, objective way to identify and focus only on the highest probability trading opportunities.
Disclaimer
This indicator is provided for educational and informational purposes only. It is not financial advice or a recommendation to buy or sell any financial instrument. Signal qualification is a tool for improving trade selection, not a guarantee of success.
Even high-quality signals can fail due to unexpected market events, news, or changes in market conditions. Past performance of high-grade signals does not guarantee future results. The indicator's signals are mathematical calculations based on historical patterns and should be used in conjunction with proper risk management.
Always use stop losses and position sizing appropriate for your account size and risk tolerance. Never risk more than you can afford to lose on any single trade, regardless of signal quality.
The author is not responsible for any losses incurred from using this indicator. Users assume full responsibility for all trading decisions made using this system.
-Made with passion by officialjackofalltrades
אינדיקטור