אינדיקטור
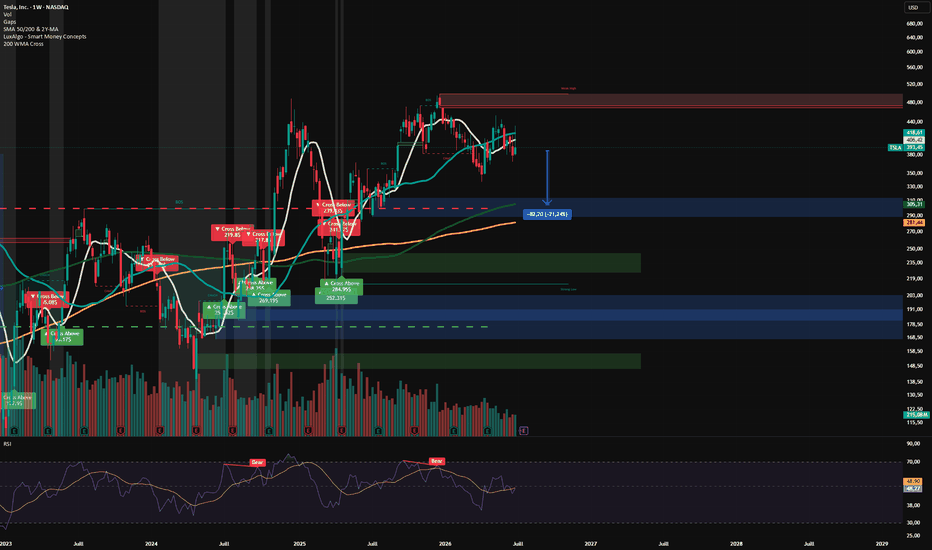
MTF Trend Classifier CORE V1 Public - Regime DB Base# MTF Trend Classifier CORE V1 Public
## 🇺🇸 English
### Trend First. Pattern Second. Context Matters.
Most trading strategies perform well only under specific market conditions.
Instead of searching for one strategy that works everywhere, this project starts with a different idea:
"Classify the market trend first, then study the patterns inside that trend."
This indicator is designed as a market regime analysis tool rather than an automatic buy/sell signal generator.
It attempts to classify the market using Multi-Timeframe EMA structures before interpreting chart patterns.
----------------------------------------
Current Research
----------------------------------------
• Higher Timeframe Trend Classification
• Multi-Timeframe EMA Structure
• EMA Expansion / Compression
• Trend Persistence
• Trend Transition Detection
• Pattern Database Research
----------------------------------------
Basic Usage
----------------------------------------
LONG MODE
• Only look for Long opportunities.
• Ignore Short opportunities.
• Wait for pullbacks toward EMA28 or EMA93 before making trading decisions.
SHORT MODE
• Only look for Short opportunities.
• Ignore Long opportunities.
• Wait for rallies toward EMA28 or EMA93 before making trading decisions.
This indicator is NOT an automatic buy/sell system.
Its purpose is to classify market context first and then analyze recurring patterns inside each trend.
----------------------------------------
Project Goal
----------------------------------------
Rather than predicting individual candles,
this project studies the market in the following order:
Trend
↓
Structure
↓
Pattern
The same chart pattern can have completely different meanings depending on the higher timeframe trend.
This project is an ongoing research to determine whether identifying the market regime first improves pattern interpretation.
----------------------------------------
Current Status
----------------------------------------
This is an experimental research project.
Feedback, ideas and constructive discussions are always welcome.
If you are interested in regime analysis, EMA behavior or pattern research, feel free to join the discussion.
==================================================================
## 🇰🇷 한국어
### 추세를 먼저, 패턴은 그 다음.
대부분의 매매 전략은 특정 시장에서는 잘 맞지만,
다른 시장에서는 쉽게 무너집니다.
저는 이런 고민에서 시작했습니다.
"모든 시장에서 통하는 하나의 전략을 찾기보다,
먼저 현재 시장의 추세를 분류하고,
그 안에서 패턴과 전략을 적용하면 어떨까?"
이 스크립트는 매수·매도 신호를 만드는 것이 목적이 아니라,
멀티 타임프레임 EMA 구조를 이용하여
현재 시장의 추세(Context)를 먼저 분석하는 연구용 프로젝트입니다.
----------------------------------------
현재 연구 내용
----------------------------------------
• 4시간 추세 분류
• 멀티 타임프레임 EMA 구조 분석
• EMA 수렴 / 확산
• 추세 지속 여부
• 추세 전환 후보 탐색
• 패턴 데이터베이스 연구
----------------------------------------
기본 사용법
----------------------------------------
🟢 롱 모드
• 롱만 고려합니다.
• 숏은 무시합니다.
• EMA28 또는 EMA93 눌림 이후 진입 여부를 판단합니다.
🔴 숏 모드
• 숏만 고려합니다.
• 롱은 무시합니다.
• EMA28 또는 EMA93 반등 이후 진입 여부를 판단합니다.
이 스크립트는 자동 매수·매도 시스템이 아닙니다.
먼저 시장의 방향을 분류한 뒤,
그 안에서 반복되는 패턴을 연구하기 위한 도구입니다.
----------------------------------------
프로젝트 목표
----------------------------------------
캔들 하나를 예측하는 것이 아니라
추세
↓
구조
↓
패턴
순서로 시장을 이해하는 것을 목표로 합니다.
같은 패턴이라도
상승추세인지,
하락추세인지,
횡보인지에 따라 의미가 달라질 수 있다고 생각합니다.
이 프로젝트는
"먼저 추세를 분류하고,
그 안에서 패턴을 해석할 수 있는가?"
를 연구하기 위한 프로젝트입니다.
----------------------------------------
현재 상태
----------------------------------------
현재도 계속 연구 및 검증을 진행 중입니다.
좋은 아이디어,
개선 의견,
건설적인 토론은 언제든지 환영합니다.
같이 더 좋은 방향으로 발전시켜 나갈 수 있으면 좋겠습니다. אינדיקטור

אינדיקטור

Smart Trend Filter V6Smart Trend Filter V6
Overview
Smart Trend Filter V6 is a trend-following indicator that combines multiple technical analysis tools into a single system to help traders identify high-quality trading opportunities. Instead of relying on one indicator alone, it uses trend, momentum, and volume confirmation to filter out weaker signals and highlight stronger market setups.
The goal of this indicator is to provide a cleaner view of the market by reducing noise and helping traders focus on trades that align with the prevailing trend.
---
How the Indicator Works
Smart Trend Filter V6 evaluates four important aspects of the market before generating a signal.
1. Trend Detection (EMA 20 & EMA 50)
The indicator uses two Exponential Moving Averages (EMAs) to determine the overall market direction.
- When EMA 20 is above EMA 50, the market is considered bullish.
- When EMA 20 is below EMA 50, the market is considered bearish.
This trend filter helps traders avoid trading against the dominant market direction.
2. Momentum Confirmation (RSI)
The Relative Strength Index (RSI) measures the strength of price movement.
- Higher RSI values indicate stronger bullish momentum.
- Lower RSI values indicate stronger bearish momentum.
RSI confirmation helps filter out weak crossovers that lack momentum.
3. Volume Confirmation
Volume plays an important role in validating price movements.
The indicator compares the current volume with its moving average.
Signals are generated only when trading volume is above average, increasing the likelihood that the move is supported by market participation.
4. Price Confirmation
Before a signal is confirmed, price must also agree with the trend.
For a Buy signal, price must close above the fast EMA.
For a Sell signal, price must close below the fast EMA.
This additional confirmation helps reduce false entries.
---
Buy Signal
A Buy signal appears when all of the following conditions are met:
- EMA 20 crosses above EMA 50.
- RSI is above the selected Buy threshold.
- Volume is above its moving average.
- Price closes above EMA 20.
---
Sell Signal
A Sell signal appears when all of the following conditions are met:
- EMA 20 crosses below EMA 50.
- RSI is below the selected Sell threshold.
- Volume is above its moving average.
- Price closes below EMA 20.
---
Features
- Non-repainting signal logic
- Trend confirmation using dual EMAs
- RSI momentum filter
- Volume-based confirmation
- Buy and Sell arrows
- Background trend highlighting
- Customizable settings
- TradingView alert support
- Works across multiple asset classes
---
Suitable Markets
Smart Trend Filter V6 can be used on:
- Forex
- Cryptocurrencies
- Stocks
- Commodities
- Indices
---
Recommended Timeframes
- 5 Minutes
- 15 Minutes
- 30 Minutes
- 1 Hour
- 4 Hours
- Daily
Higher timeframes generally produce fewer but stronger signals, while lower timeframes generate more opportunities with increased market noise.
---
Best Practices
For improved results:
- Trade in the direction of the higher-timeframe trend.
- Use stop-loss and proper risk management.
- Wait for candle close before acting on a signal.
- Combine the indicator with key support and resistance levels for additional confirmation.
---
Disclaimer
Smart Trend Filter V6 is designed as a technical analysis tool to assist with market analysis. No indicator can predict the market with complete accuracy, and all trading involves risk. Always perform your own analysis and apply sound risk management before making trading decisions.
If you find this indicator useful, consider adding it to your favorites and sharing your feedback. Your suggestions are always appreciated and help improve future updates. אינדיקטור

WallStreet 50/200 DMA EventsWallStreet 50/200 DMA Events — FROM DANNY BEE
This indicator is a long-term market regime visualization tool based on the classic 50-day and 200-day moving averages.
It detects confirmed daily Golden Cross and Death Cross events, plots the 50 DMA and 200 DMA on the chart, stores historical cross events, and tracks how price has performed since each event.
Main Features:
• Confirmed daily 50 DMA and 200 DMA
• Golden Cross and Death Cross detection
• Historical event labels
• Event performance tracking from the cross price to the current price
• Current Close vs 200D distance label
• Risk-On / Risk-Off regime table
• Customizable label detail: Minimal, Balanced, Detailed
• Customizable table position and text size
• Background highlight on new cross events
• Alerts for Golden Cross and Death Cross events
How to Read It:
Golden Cross = 50 DMA crosses above 200 DMA
This usually represents a long-term Risk-On regime.
Death Cross = 50 DMA crosses below 200 DMA
This usually represents a long-term Risk-Off regime.
The event table shows previous cross events, their date, event price, 50D value, 200D value, distance from 200D, return since the event, number of days passed, and the regime type.
Non-Repaint Logic:
The indicator uses confirmed daily data. The moving averages and cross signals are based on completed daily candles, not unfinished intraday movement. This makes the tool cleaner for long-term regime analysis.
Purpose:
This script is not designed to predict every market move or generate automatic buy/sell signals. It is designed to help traders and investors understand the broader market structure, identify major regime shifts, and study how price behaved after previous 50/200 DMA events.
This is a context tool, not a trading system by itself.
Use it together with risk management, market structure, macro context, and your own trading or investing plan.
Disclaimer:
This script is for educational and analytical purposes only. It is not financial advice. Markets involve risk, and past performance after Golden Cross or Death Cross events does not guarantee future results.
אינדיקטור

CTZ Bitcoin Cycle Master (Modified)Here's a description written in your own words for the TradingView publish page, with the required credit to the original author since it's a modification of an open-source script:
---
CTZ Bitcoin Cycle Master (Modified)
This is a modified version of the open-source Bitcoin Cycle Master by InvestorUnknown, republished under the Mozilla Public License 2.0 with full credit to the original author. The underlying on-chain models are unchanged — this version adjusts how the bands are positioned and adds user control over every line.
WHAT IT DOES
The indicator plots five long-term valuation models on the Bitcoin chart, designed for macro cycle analysis on high timeframes (weekly and monthly recommended, log scale):
Top Cap — a 35x multiple of Average Cap (the cumulative average of price over Bitcoin's lifespan). Acts as the upper boundary for speculative cycle peaks.
Terminal Price — derived from Coin Days Destroyed and normalised by Bitcoin's 21 million supply cap. A supply-adjusted price model historically relevant near cycle tops.
Realized Price — Realized Cap divided by circulating supply. The average on-chain cost basis of all coins, and a key line in bear market bottoms.
CVDD — Cumulative Value Coin Days Destroyed. A historically reliable floor model that has caught major cycle lows.
Balanced Price — Realized Price minus Transferred Price. A deep-value zone that has marked bear market capitulation lows.
WHAT'S DIFFERENT IN THIS VERSION
1. Recalibrated band positioning. Historical cycle behaviour shows diminishing returns — each cycle tops further below the classic upper bands. This version repositions three lines by default: Terminal Price sits 33 percent lower, CVDD 10 percent lower, and Balanced Price 5 percent lower than the original calculations.
2. Per-line offset multipliers. Every model has its own multiplier input, so you can shift any band up or down from the settings panel without touching code. Defaults reflect the recalibration above, but everything is fully adjustable back to the original values (set all multipliers to 1.0).
3. Delta Top removed. Stripped out to reduce chart clutter and focus on the models with the most consistent historical track record.
4. Full colour control. Each line has its own colour picker, so the indicator can be themed to any chart setup.
5. Converted to Pine Script v6.
HOW TO USE IT
Best viewed on INDEX:BTCUSD, weekly or monthly timeframe, logarithmic scale. Price approaching the upper bands (Top Cap, Terminal Price) has historically coincided with late-cycle euphoria and distribution. Price reaching the lower bands (Realized Price, CVDD, Balanced Price) has historically marked deep value and accumulation zones.
Data sources: Coin Metrics realized cap, Glassnode supply and transfer volume, INDEX:BTCUSD price history.
DISCLAIMER
This indicator is for research and educational purposes only and is not financial advice. On-chain models describe historical behaviour and offer no guarantee of future performance.
---
Two notes before you publish. TradingView house rules require open-source mods to stay open-source and credit the original, which this description does in the first line — keep the attribution in the code header too. And if this one is staying in the CTZ private collection rather than being published, you can drop the licence paragraph and just use the description from WHAT IT DOES downward. אינדיקטור

אינדיקטור

אינדיקטור

אסטרטגייה

אינדיקטור
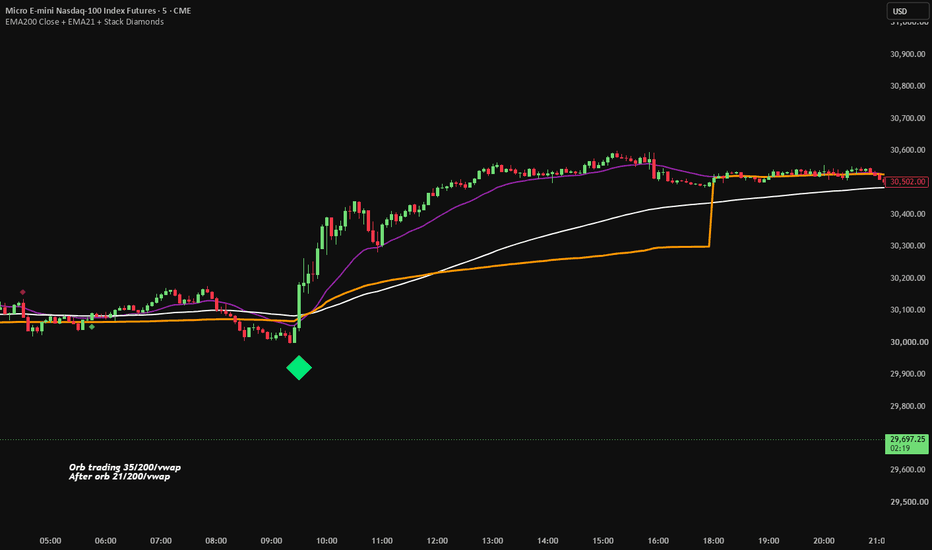
MR8 Trend Direction & Signal IndicatorThe MR8 is a dynamic trend-following indicator built on the McGinley Dynamic moving average — one of the most responsive and self-adjusting smoothing algorithms available. Unlike traditional EMAs that can lag or whipsaw in changing market conditions, the McGinley Dynamic automatically adapts its speed based on market velocity, resulting in cleaner, more reliable signals.
How It Works
MR8 plots two McGinley Dynamic lines — a faster Ribbon 8 and a slower Ribbon 9. When the faster line crosses above the slower line, the ribbon turns white, signaling bullish momentum and a potential long entry. When the faster line crosses below, the ribbon turns grey, signaling bearish momentum and a potential short entry. This crossover method filters out the noise and false flips that plague single-line slope-based indicators.
Built-In Stop Loss
MR8 includes an optional visual stop loss line calculated directly from the ribbon's current value — 2% above the line for shorts, 2% below for longs. Toggle it on in settings to see exactly where your risk level sits relative to the indicator itself, on any timeframe.
Alert Ready
MR8 includes two built-in alert conditions — one for long signals and one for short signals — with a webhook-compatible JSON message format. Connect directly to any automated trading bot or notification system with zero additional configuration.
Best Used On
BTC/USD and BTC/USDT
55 minute, 1 hour, and higher timeframes
Futures and spot markets
Settings
Ribbon 8 Length — controls the speed of the faster line (default 12)
Ribbon 9 Length — controls the speed of the slower line (default 21)
Stop Loss % — distance from the ribbon for the optional SL line (default 2%)
Show Stop Loss Line — toggle the SL visualization on or off אינדיקטור

אינדיקטור

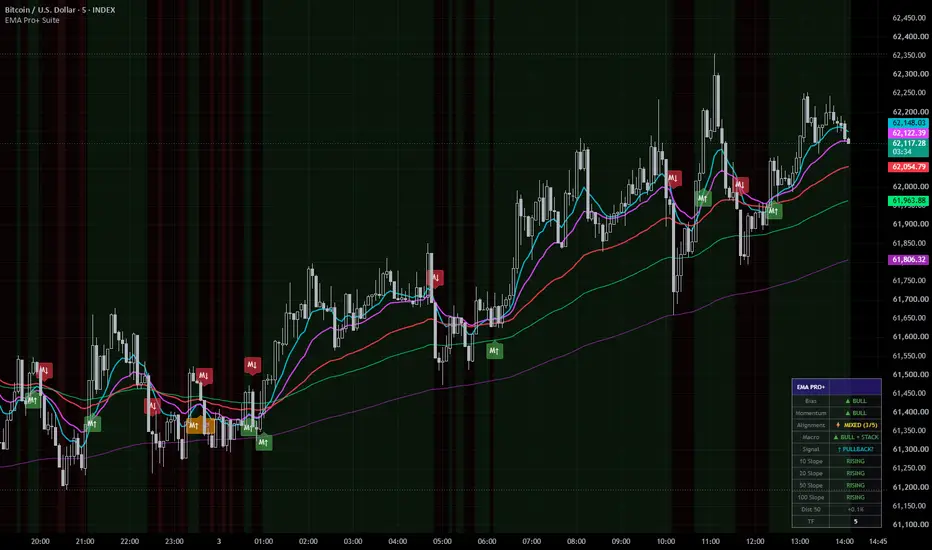
EMA Pro+ Suite# EMA Pro+ Suite
**A multi-layer EMA confluence framework for reading market state at a glance.**
---
## What It Is
EMA Pro+ Suite is an overlay indicator built around three exponential moving averages — a Fast (10), Mid (20), and Slow (50) EMA — organized into a structured three-layer state engine that tells you the current market regime, momentum direction, and whether price is in or out of alignment with that regime. Rather than treating each EMA in isolation, the suite reads them together as a system and surfaces a single, coherent market state at all times.
A corner dashboard table updates in real time, giving you an instant read on bias, momentum, alignment, EMA slopes, and price extension — without having to scan the chart manually.
---
## How It Works
The indicator evaluates three distinct layers on every bar:
**Layer 1 — Bias (Trend Regime)**
Defined by price relative to the 50 EMA. Price above = bullish bias. Price below = bearish bias. This is the macro filter — it determines which direction setups should be taken in.
**Layer 2 — Momentum**
Defined by the 10 EMA relative to the 20 EMA. When the fast EMA is above the mid EMA, momentum is bullish. When below, momentum is bearish. Momentum alignment with bias is the confirmation layer.
**Layer 3 — Price vs Fast EMA**
When bias and momentum are aligned but price is on the wrong side of the 10 EMA, the indicator flags a potential pullback or exhaustion condition. In a full bull regime, price dipping below the 10 EMA may represent a high-quality entry opportunity — or an early warning of trend exhaustion. Context determines which.
**Slope Engine**
Each EMA is evaluated for slope using a configurable lookback. RISING / FLAT / FALLING is displayed per EMA in the dashboard. A momentum flip on flat EMAs carries significantly less weight than one on rising or falling EMAs — this is critical for filtering out noise in ranging conditions.
**Price Distance from 50 EMA**
Tracks how extended price is from the slow EMA as a percentage. Large positive or negative readings flag mean reversion risk.
**Bar & Background Coloring**
- Green background + green bars = full bull alignment
- Red background + red bars = full bear alignment
- Yellow bars = conflicting bias and momentum (mixed / transitional state)
- Aqua bars = bull regime, price pulling back below 10 EMA
- Fuchsia bars = bear regime, price popping above 10 EMA
**Cross Signals**
- `M↑` (green) — 10 EMA crossed above 20 EMA in bull zone. Aligned, higher conviction.
- `M↓` (red) — 10 EMA crossed below 20 EMA in bear zone. Aligned, higher conviction.
- `M↑ 🐻` (orange) — Bullish momentum flip firing in bear zone. Counter-trend, lower conviction.
- `M↓ 🐂` (orange) — Bearish momentum flip firing in bull zone. Counter-trend, lower conviction.
**Multi-Timeframe Support**
All three EMAs can be calculated on a higher timeframe and plotted on the current chart. Use this to anchor your bias to the HTF structure while reading entries on a lower timeframe.
---
## Possible Ways to Use It
**Trend Following**
Wait for full alignment — green background, green bars, all three slopes RISING. Only look for long entries. Use the 10 EMA pullback (aqua bars) as a potential entry trigger. Reverse logic for shorts.
**Momentum Flip Entries**
Use aligned `M↑` / `M↓` signals (green/red) as entry triggers when bias and slope confirm. Discard or fade counter-trend orange signals unless you have a specific reason to trade against the regime.
**Regime Filter for Other Systems**
Use the bias layer (price vs 50 EMA) as a filter for another strategy. Only take long signals from your primary system when EMA Pro+ shows bull bias, and vice versa.
**HTF Confluence**
Set the EMA Timeframe to a higher timeframe (e.g. 4H or Daily) while trading on a 15m or 1H chart. The dashboard will show the HTF regime, giving you a structural anchor for your intraday reads.
**Avoiding Chop**
When all three slopes read FLAT and bars are yellow (mixed alignment), the market is in a transitional or ranging state. Consider standing aside or reducing position size until a clear regime re-establishes.
**Mean Reversion Awareness**
When Dist 50 shows a large positive or negative reading, price is extended from the slow EMA. In trending markets this can persist — but it raises the bar for adding to positions and flags potential snapback risk.
---
## Settings
| Setting | Description |
|---|---|
| EMA Timeframe | Blank = current chart timeframe. Enter any TF (e.g. 60, 240, D) for MTF mode. |
| Fast / Mid / Slow EMA Length | Default 10 / 20 / 50. Fully adjustable. |
| Slope Lookback | Number of bars used to calculate EMA slope. Increase on lower timeframes to reduce flat readings. |
| Show EMA Lines | Toggle the three EMA plots. |
| Show Bias Background | Toggle the green/red background tint. |
| Color Bars by State | Toggle bar coloring. |
| Show Cross Signals | Toggle M↑ / M↓ labels on chart. |
| Show Dashboard Table | Toggle the corner HUD. |
| Table Position | Top Right / Top Left / Bottom Right / Bottom Left. |
| Bar Close Reminder Alert | Fires a reminder alert on every bar close to check the setup. |
---
## Alerts
- Momentum Flip Bullish — Bull Zone (aligned)
- Momentum Flip Bullish — Bear Zone (counter-trend)
- Momentum Flip Bearish — Bear Zone (aligned)
- Momentum Flip Bearish — Bull Zone (counter-trend)
- Price Reclaimed 50 EMA (bias flipped bullish)
- Price Lost 50 EMA (bias flipped bearish)
- Bull Pullback Signal (bull regime, price below 10 EMA)
- Bear Pullback Signal (bear regime, price above 10 EMA)
- Bar Close Reminder
---
## Disclaimer
This indicator is provided for educational and informational purposes only. It does not constitute financial advice, investment advice, or a recommendation to buy or sell any asset. All trading involves substantial risk of loss. Past performance of any signal, strategy, or system is not indicative of future results.
EMA Pro+ Suite is a tool to assist with technical analysis — it does not predict price, guarantee accuracy, or remove the inherent uncertainty of financial markets. No indicator eliminates risk. You are solely responsible for your own trading decisions.
Always conduct your own research, apply proper risk management, and consider consulting a licensed financial professional before making any trading decisions. Only trade with capital you can afford to lose. אינדיקטור

Universal Scalper SystemThe Universal Scalper System is a powerful technical indicator designed specifically for intraday scalping on lower timeframes like 1-minute and 5-minute charts. It provides a streamlined approach to trading by combining trend identification with essential market data.
Key Features:
9 EMA Crossover: Generates clear, actionable Buy and Sell signals the moment the price crosses and closes beyond the 9-period Exponential Moving Average (EMA).
Live Market Dashboard: Includes a fully customizable dashboard that displays:
Current Chart Timer: Countdown until the current candle closes.
15-Minute Timeframe Timer: Tracks the closure of the 15-minute candle for higher-timeframe context.
Real-time Candle Info: Shows if the current candle is Bullish or Bearish along with live volume data.
Highly Customizable: Traders can easily adjust EMA settings, dashboard colors, text sizes, and dashboard positioning directly through the settings panel to fit their unique workspace.
Built-in Alerts: Features integrated alert conditions for both Buy and Sell signals, ensuring you never miss a trading opportunity.
This system is perfect for traders who prioritize speed, clean visuals, and real-time data at their fingertips.
Tags: Scalping, EMA, CrossOver, Dashboard, TradingSystem, PriceAction, TechnicalAnalysis, Indicator, Scalper, LiveTimer אינדיקטור

SMB Fashionably Late Scalp (9EMA x VWAP)SMB "Fashionably Late Scalp" (9 EMA × VWAP) — backtest & study tool
WHAT THIS IS
An open, fully tunable Pine v5 strategy implementation of the "Fashionably Late
Scalp," a 9-EMA-crosses-VWAP intraday setup published by SMB Capital. It is built
for honest backtesting and study of the setup's mechanics — not as a turnkey
profitable system (see "Honest notes on performance" below).
THE SETUP (long; short is the mirror)
1. Divergence — a sustained move separates the 9 EMA from the session VWAP.
2. The Turn — price puts in a distinct low of the day, then starts back up.
3. Convergence — the 9 EMA rises back and crosses VWAP. That cross is the trigger.
Entry: an up-sloping 9 EMA crossing a flat-to-downsloping VWAP (mirror for shorts).
Stop: 1/3 of the distance from VWAP to the low of day.
Target: a measured move — low-of-day to the cross, projected the same distance
beyond the cross.
TWO ENTRY MODES
• Anticipate cross (stop order) : TradingView can normally only act on the
bar AFTER a cross. Because the EMA's next value is deterministic in price
(EMA_next = α·P + (1−α)·EMA_now), the script solves for the exact price P that
makes the 9 EMA meet VWAP and rests a stop order there — so it fills AT the cross,
intrabar. Non-repainting: the trigger is fixed on the closed bar and refreshed
each bar.
• React next bar open (market): conventional market entry on the confirmed cross
(fills one candle late). Kept for A/B comparison.
Note: the anticipatory trigger sits above VWAP by ~4× the EMA-to-VWAP gap (9-EMA
algebra), so the further the EMA lags VWAP at entry, the higher the fill and the
lower the realized reward:risk. A "Minimum reward:risk" input — measured from the
actual fill, not from VWAP — bounds this.
KEY INPUTS
• EMA length; separate EMA & VWAP slope lookbacks/thresholds (VWAP uses a longer
lookback so "flat-to-downsloping" reflects the day's posture, not a 1-bar wiggle)
• Stop fraction, stop-anchor mode, cross-price mode, minimum reward:risk
• "The turn" requirement, re-entry cooldown, long/short toggles
• Optional filters: ideal EST session windows (10:00–10:45 / 10:46–13:30), a
>15-minute EMA-flat veto, and a volume-confirmation filter
• A signal-funnel table (top-right) showing how many crosses survive each gate, so
you can see exactly what is or isn't triggering
REQUIREMENTS & BEHAVIOR
• Needs a volume-bearing instrument (stocks/futures). On symbols without real
volume the session VWAP is undefined and the script stops with a message.
• Session VWAP and the low/high of day share one daily anchor, so they reset
together across RTH/ETH/24h charts.
• Signals evaluate on closed bars; no lookahead. Set realistic commission and
slippage in the Strategy Properties before drawing any conclusions.
HONEST NOTES ON PERFORMANCE
The source cites roughly a 60% win rate at ~3:1 reward:risk. Those numbers come
from a discretionary playbook, and in my own testing this mechanical version does
NOT reproduce them — it is not reliably profitable out of the box. That is
expected: the original depends on trader judgment this code cannot encode
(selecting "in-play" names, reading the speed/quality of the turn, position sizing,
skipping messy tape), and scalping costs erode a thin edge quickly. Treat this as a
faithful study/backtest harness for the mechanics and a base to experiment on — not
a signal to trade live. Nothing here is financial advice; test and manage your own
risk.
CREDITS
Setup concept: SMB Capital ("The Fashionably Late Scalp," public cheat sheet).
Pine v5 implementation, the anticipatory-cross entry, and the diagnostics are mine. אסטרטגייה

אינדיקטור
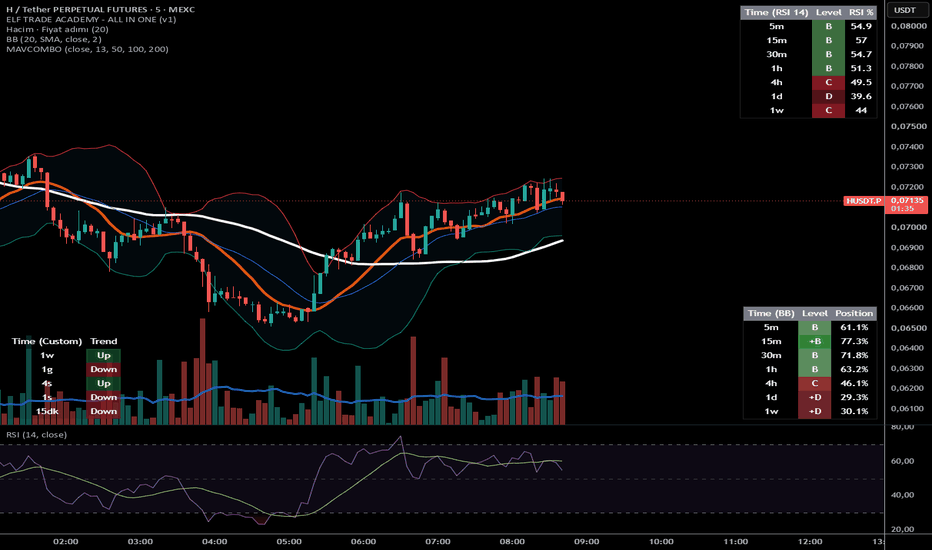
[Quadapt] Machine Learning Trader Machine Learning Trader
A multi-component Pine Script v6 trading assistant combining a kernel-regression MLMA trend model, dual-length signal envelopes, order block context, retest scoring, adaptive Fibonacci targets, stop loss projection, signal quality filtering, and optional webhook automation.
## Description
Machine Learning Trader is a full-featured market structure and signal confluence indicator built around a Machine Learning Moving Average (MLMA) trend model. It is designed to help traders analyze trend direction, signal quality, order block context, potential retest areas, and adaptive take-profit / stop-loss levels from one chart overlay.
The script is not a black-box strategy or a guaranteed signal generator. It is a discretionary analysis tool that combines several independent market-context modules into one workflow so traders can compare trend, volatility, structure, momentum, and risk levels before making a decision.
### What Makes This Script Different
The core of the indicator is a kernel-regression MLMA engine. Instead of using only a classic moving average, the script builds a regression-style trend estimate using configurable kernel functions and regression modes. This produces a smoothed adaptive trend line and cloud that can be used as a directional context filter.
The MLMA is combined with:
- dual-length nonlinear signal envelopes,
- market structure and order block detection,
- intelligent retest scoring,
- adaptive Fibonacci take-profit projection,
- stop-loss projection,
- multi-timeframe MLMA trend alignment,
- signal quality filtering,
- clustering prevention,
- market regime adaptation,
- optional webhook payload generation.
The result is a confluence-focused indicator: a buy or sell marker is not treated as useful by itself. It is evaluated against the MLMA trend, recent order blocks, volatility regime, momentum, volume, cloud position, and multi-timeframe alignment.
### MLMA Trend Engine
The MLMA module calculates a machine-learning-inspired moving average using kernel methods. The script supports several kernel types, including:
- RBF,
- Linear,
- Polynomial,
- Sigmoid,
- Laplacian,
- Matern,
- Periodic,
- Trigo.
The regression mode can be configured as:
- GPR,
- KRR,
- KPCR,
- SVR,
- Kernel Smoothing,
- Adaptive RQ.
The MLMA output forms the main trend reference. The script also builds upper and lower MLMA bands using an error envelope derived from average absolute deviation around the MLMA output. These bands are used for the cloud, trend state, signal validation, and context scoring.
When the MLMA state is bullish, the script treats price behavior above or near the bullish support side of the cloud as more constructive. When the MLMA state is bearish, the script treats price behavior below or near the resistance side of the cloud as more defensive.
### Instrument-Agnostic Envelope Logic
The signal envelope section is designed to work across instruments with very different price scales, including forex pairs, JPY pairs, metals, oil, gas, indices, and crypto. The nonlinear envelope transform keeps the original algorithmic shape, but price distance is normalized relative to the instrument's local price level before the transform and restored back into price units afterward.
This matters because a raw price move on EURUSD, GBPJPY, XAUUSD, or XNGUSD has a very different numerical size. Normalizing the envelope distance helps the signal engine behave more consistently across instruments instead of being tuned only for one price scale.
### Dual-Length Signal Engine
The script calculates two separate signal envelopes:
- Primary Length: the slower, broader signal model.
- Secondary Length: the faster signal model.
The dual-length system can run in three modes:
- Independent: either length can produce a signal.
- Consensus: both lengths must agree.
- Primary Priority: only the primary length drives the final signal.
This allows traders to choose between sensitivity and confirmation. Independent mode produces more signals, consensus mode is stricter, and primary priority keeps the chart focused on the slower model.
Signal labels can show regular and stronger buy/sell conditions. When both lengths align in Independent mode, the script can also mark BOTH signals.
### Order Block Detection
The order block module searches for volatility-based bullish and bearish blocks using candle direction, volatility expansion, momentum, optional volume confirmation, and trend alignment. Blocks can be displayed as chart boxes with volume and quality information.
Order block detection includes configurable controls for:
- volatility method,
- volatility length,
- smoothing length,
- minimum separation between blocks,
- maximum blocks per direction,
- consolidation filtering,
- trend filtering,
- volume filtering,
- momentum filtering,
- block display style.
The script assigns order block quality using factors such as block size, directional pressure, displacement, market structure, MLMA trend context, and volume. Higher-quality blocks can be emphasized while weaker blocks can be faded.
### Retest Detection
The retest engine evaluates whether price has returned to a recent order block in a meaningful way. Retests can be scored using:
- block strength,
- clean movement away from the block,
- volume confirmation,
- MLMA trend alignment,
- volatility regime,
- reaction quality near the block.
Retest labels can be displayed as simple `R` markers. Strong and weak retests can be controlled separately, and optional percentage display can show the retest confidence score.
### Adaptive Fibonacci Take Profit Levels
The script can project take-profit levels after valid buy or sell signals. The TP engine supports several methods:
- Dynamic ATR,
- Swing-Based,
- Adaptive Swing,
- Heuristic.
It can display multiple Fibonacci extension targets, optional confluence zones, and TP hit status. The TP table shows the current trade direction, entry reference, target levels, stop loss, and active status.
The TP logic is filtered through MLMA and order block context. For example, a buy signal is considered valid when MLMA context supports the buy, or when price is near a supportive bullish order block. This helps reduce target plotting during low-quality or conflicting conditions.
### Stop Loss Projection
The stop-loss module supports:
- ATR-based stops,
- swing-based stops,
- order-block-based stops,
- percentage-based stops.
Stop levels are plotted only after a valid trade setup is detected. The script also tracks whether price has reached the projected stop or take-profit levels.
### Signal Quality Engine
The signal quality engine scores buy and sell setups before final display. The quality score considers:
- MLMA trend context,
- price position relative to the MLMA,
- multi-timeframe alignment,
- order block support or opposition,
- volume quality,
- volatility regime,
- candle body behavior,
- momentum,
- choppy or no-trade conditions,
- cloud width and MLMA slope,
- recent loss-streak penalty logic.
Signals below the configured minimum score can be filtered out. If desired, rejected signals can also be displayed for research and tuning.
### Advanced Signal Filtering
The script includes adaptive clustering prevention and regime-aware filtering.
Clustering prevention reduces repeated signals in the same area by using a time window, ATR-based price window, decay factor, and maximum cluster count.
Regime-aware filtering adjusts confidence behavior using recent market context, including price movement, volatility trend, and volume trend. This helps the script respond differently in ranging, trending, quiet, and volatile periods.
### Multi-Timeframe Trend Table
The MLMA trend table summarizes the current trend state and several higher/lower timeframe states:
- current chart,
- 15m,
- 30m,
- 1H,
- 4H,
- 1D,
- 1W.
This table is useful for quickly checking whether the current signal is aligned with broader market direction.
### Market Exhaustion
The exhaustion module uses RSI, price extension, momentum change, and volume behavior to identify possible bullish or bearish exhaustion. Exhaustion markers are intended as context warnings, not standalone reversal signals.
### Webhook Automation
Optional webhook alerts can send structured payloads for external automation or journaling. The payload can include:
- symbol,
- ticker ID,
- timeframe,
- event type,
- action,
- account tag,
- risk percent,
- order type,
- entry,
- stop loss,
- TP levels,
- quality score,
- MLMA trend,
- bar time.
Webhook use is optional and should be tested privately before live use.
### Alerts Included
The script includes alert conditions for:
- ML Strong Buy Signal,
- ML Strong Sell Signal,
- ML Buy Signal,
- ML Sell Signal,
- rejected quality signals,
- wedge pattern,
- BOTH length signal,
- bullish order block,
- bearish order block,
- bullish exhaustion,
- bearish exhaustion,
- valid enhanced Fibonacci buy/sell signals,
- invalid buy/sell signals,
- Fibonacci TP hit,
- TP/SL levels set,
- order block retest,
- signal clustering,
- market regime change,
- advanced filtering active.
### How To Use
1. Add the indicator to a clean chart.
2. Start with the default settings.
3. Use the MLMA cloud and trend table to understand directional context.
4. Watch for buy/sell labels only when they align with trend, order block, and quality context.
5. Use order block boxes and retest markers to identify possible reaction zones.
6. Use TP/SL projections as planning references, not as automatic trade instructions.
7. Tune Primary Length, Secondary Length, Signal Mode, and Signal Quality settings for the instrument and timeframe you trade.
8. If using alerts or webhooks, test them on paper or in a private environment first.
### Practical Notes
- Lower lengths are more responsive but can produce more noise.
- Higher lengths are smoother but react later.
- Consensus mode is stricter than Independent mode.
- The Signal Quality Engine can remove many low-context signals.
- The Order Block module is most useful when combined with MLMA trend context.
- TP and SL levels are projections based on the selected method; they are not guarantees that price will reach those levels.
- Exhaustion markers are context warnings and should be confirmed with structure, trend, and volatility.
### Limitations
This indicator does not predict the future. It organizes market context using mathematical filters, kernel regression, volatility logic, order block heuristics, and signal-quality rules. It can still produce false signals, especially during news events, illiquid periods, low-volume sessions, strong trend exhaustion, sudden reversals, or choppy markets.
No indicator should be used alone. Traders should combine this tool with their own risk management, market understanding, and independent confirmation. Past chart behavior does not guarantee future results.
אינדיקטור

Smart Trend Confirmation (STC)🚀 Introducing Smart Trend Confirmation (STC)
Tired of taking trades against the trend? The Smart Trend Confirmation (STC) indicator is designed to help traders identify high-probability setups by combining trend, momentum, and volume into one simple system.
🔍 How It Works
✅ Trend Filter (EMA 200)
- Price above the 200 EMA = Only look for Buy opportunities.
- Price below the 200 EMA = Only look for Sell opportunities.
✅ Pullback Detection (EMA 20)
Instead of chasing price, STC waits for a healthy pullback toward the 20 EMA before looking for an entry.
✅ Momentum Confirmation (RSI)
- RSI above 55 confirms bullish momentum.
- RSI below 45 confirms bearish momentum.
✅ Volume Confirmation
Signals are generated only when trading volume is above its average, helping filter out weak market moves.
✅ ATR-Based Risk Management
The indicator automatically calculates dynamic Stop Loss and Take Profit levels using ATR, adapting to current market volatility.
📈 Buy Conditions
• Price above the 200 EMA
• Pullback near the 20 EMA
• RSI above 55
• Volume above average
• Bullish candle closes
📉 Sell Conditions
• Price below the 200 EMA
• Pullback near the 20 EMA
• RSI below 45
• Volume above average
• Bearish candle closes
⭐ Key Features
✔ Trend-following strategy
✔ Non-repainting signals (generated after candle close)
✔ Dynamic Stop Loss & Take Profit
✔ Buy/Sell alerts
✔ Works on Forex, Crypto, Stocks, and Indices
Best Timeframes: 15M, 1H, and 4H.
⚠️ No indicator is 100% accurate. Always use proper risk management and combine signals with your own market analysis before entering a trade. אינדיקטור

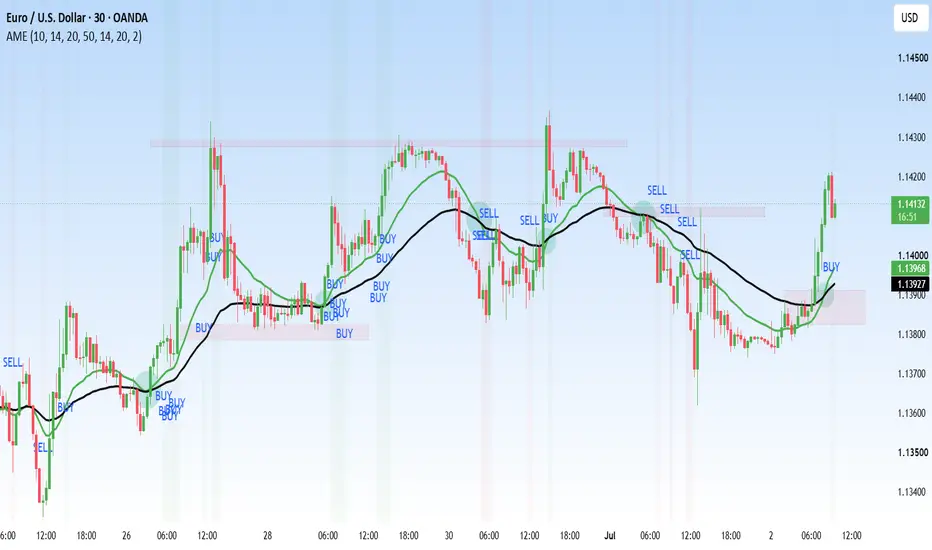
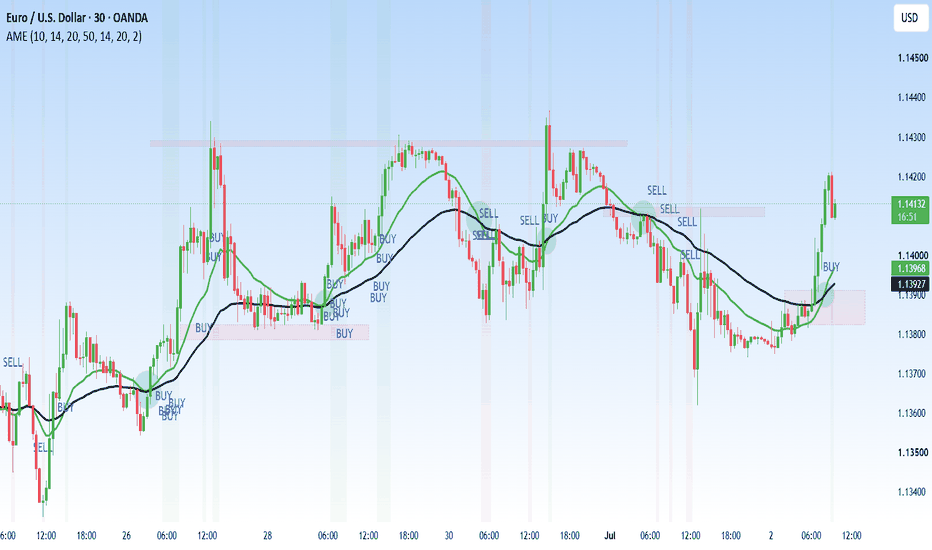
Adaptive Momentum Exhaustion (AME)Adaptive Momentum Exhaustion (AME) is a trend-following indicator designed to identify high-probability continuation trades while filtering out weak and overextended price movements.
Unlike traditional momentum indicators, AME normalizes momentum using the Average True Range (ATR), making it adaptive to changing market volatility. It combines four key market factors:
- Momentum: Measures the strength of price movement relative to volatility.
- Trend: Uses the 20 EMA and 50 EMA to determine the prevailing market direction.
- Volume: Confirms that price movement is supported by above-average trading activity.
- Exhaustion: Uses RSI and Bollinger Bands to avoid entering trades after the market has become overbought or oversold.
A Buy signal is generated only when bullish momentum is strong, the market is in an uptrend, trading volume is above average, and price is not showing signs of exhaustion.
A Sell signal is generated only when bearish momentum is strong, the market is in a downtrend, trading volume is above average, and price is not showing signs of exhaustion.
The objective of AME is to reduce false signals, avoid late entries, and improve trade quality by waiting for strong, healthy trends instead of chasing exhausted price moves. It is best suited for trending markets and can be applied across stocks, forex, cryptocurrencies, and commodities on multiple timeframes. אינדיקטור
אינדיקטור

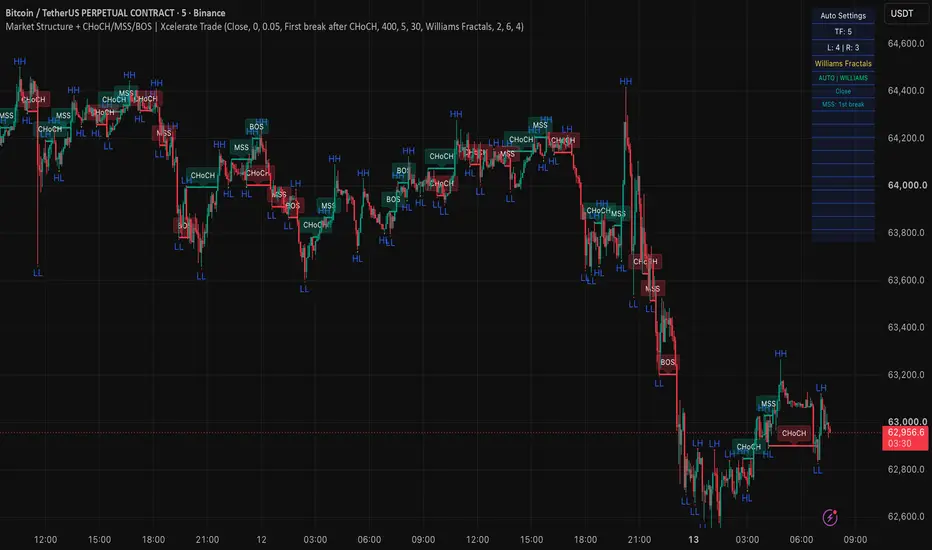
Market Structure + CHoCH/MSS/BOS | Xcelerate TradeMarket Structure + CHoCH / MSS / BOS | Xcelerate Trade
A precise market-structure mapper from the Xcelerate Trade team. It auto-detects swing highs / lows, classifies every break of structure as CHoCH (Change of Character), MSS (Market Structure Shift) or BOS (Break of Structure), and labels each pivot as HH / HL / LH / LL. Designed for SMC and price-action traders who want a clean, repaint-aware structural read of the chart.
What you get on the chart
Swing labels: HH (Higher High), HL (Higher Low), LH (Lower High), LL (Lower Low) — auto-placed on every detected pivot.
Break lines: every confirmed break is drawn as a horizontal segment from the swing bar to the breaking bar.
Break tags: each break line gets a label — CHoCH, MSS or BOS — so you can read structure at a glance.
Info table (top-right): current settings (Auto / Manual, TF, L/R, detection method, MSS definition, break validation) and an optional debug panel with trend state, flags, pre-CHoCH levels, last-break details.
Pattern alerts: ready-to-use alertcondition for HH-HL-HH and LL-LH-LL sequences.
Pivot detection — two modes
Williams Fractals (default): classic ta.pivothigh / ta.pivotlow with separate left and right lengths. Configurable in Manual Settings (defaults L = 6, R = 4) or selected automatically per timeframe via Auto Timeframe Settings:
Timeframe L / R
1m
4 / 4
5m
4 / 3
15m
5 / 4
30m+, daily, weekly, monthly
6 / 4
Simple Fractals: SMC-style, symmetric — current bar is a pivot if it's the highest / lowest within simpleFractalPeriod bars on each side. Faster but more frequent than Williams.
You can also force Wait for bar close (default ON) to confirm pivots only on closed bars.
Break validation — 4 modes
Choose how a level is considered "broken":
Close — close beyond the swing level (cleanest, default).
High/Low (wick) — wick beyond the level (most aggressive).
Close beyond buffer (ticks) — close beyond level ± N × mintick.
Close beyond buffer (%) — close beyond level ± X%.
Buffer fields appear conditionally so you can tune the strictness of structure breaks per instrument (forex, indices, crypto, etc.).
Structure classification — CHoCH / MSS / BOS
Trend state is tracked internally (Bullish, Bearish, Neutral). Every confirmed break is then classified:
CHoCH — first break that reverses the trend (bullish CHoCH on a close above the last swing high while bearish; bearish CHoCH on a close below the last swing low while bullish), or the very first break when the trend is still neutral. CHoCH flips the trend and starts a fresh leg.
MSS — first qualifying break in the direction of the new trend after CHoCH, per the MSS definition setting:
First break after CHoCH — any first break in trend direction = MSS, then BOS.
First break >= pre-CHoCH level — MSS only when the broken swing is at or beyond the swing level that existed before the CHoCH. Stricter — protects against premature MSS calls.
HL + >= pre-CHoCH (legacy) — same as above, plus a confirming HL (bull) / LH (bear) is required after CHoCH before MSS can fire.
BOS — every subsequent break in the trend direction after MSS — until the opposite CHoCH occurs and the cycle restarts.
This rule set keeps only one MSS per trend leg, with everything before it being CHoCH and everything after being BOS — exactly how SMC traders read it.
Pre-CHoCH levels (transparent reasoning)
When CHoCH fires, the script captures the swing-high / swing-low that existed before the trend flip (pre_choch_swing_high / pre_choch_swing_low). These are used by the stricter MSS modes and shown in the debug rows of the info table, so you can verify exactly why a break was classified as MSS or BOS.
Last broken swing tracking
For every confirmed break the indicator stores:
lastBreakSwingBarIndex — the bar where the broken swing originally formed (its ID).
lastBreakSwingPrice — the level that was broken.
lastBreakClassification — CHoCH / MSS / BOS.
lastBreakDirection — above swing high / below swing low.
lastBreakDetectBarIndex — the bar where the break passed your validation filter.
These are visible in the debug rows when Show debug rows (table) is on — useful for forensic / journal-style review.
Drawing budget (FIFO)
The indicator caps the number of CHoCH / MSS / BOS line + label pairs at Max CHoCH/MSS/BOS lines + labels (default 400, max ~80% of TradingView's 500 limit). Older drawings are removed first (FIFO), so you never hit the line cap on long histories.
Alerts
Two ready-to-use alert conditions:
HH-HL-HH Alert — fires when an HH-HL-HH pattern completes.
LL-LH-LL Alert — fires when an LL-LH-LL pattern completes.
Use TradingView's alert dialog → choose the alert condition by name. Messages include {{ticker}} and {{interval}} placeholders.
Suggested settings (from the Xcelerate Trade team)
Default for most traders: Auto settings ON, Williams Fractals, Wait for bar close ON, Break validation = Close, MSS definition = First break after CHoCH.
Strict structural read (low noise): Break validation = Close beyond buffer (%) with 0.05–0.10%, MSS definition = First break >= pre-CHoCH level.
Aggressive / fast feedback: Simple Fractals with period 2, Break validation = High/Low (wick), Wait for bar close = OFF.
Forensic review: turn ON Show debug rows (table) to see trend state, CHoCH / MSS flags, pre-CHoCH levels and the last-break summary.
Notes & disclaimers
Williams Fractals confirm with a delay equal to the right-length (R bars). This is intentional — pivots are not repainted after confirmation.
Simple Fractals confirm with a delay equal to simpleFractalPeriod bars.
This is an analytical tool — no automated buy / sell labels. Pair with your own execution rules.
Pine Script v6.
Built and maintained by the Xcelerate Trade team. A complete CHoCH / MSS / BOS market-structure read with HH / HL / LH / LL labels, four break-validation modes, three MSS definition modes, an info / debug table and ready alert conditions. אינדיקטור

אינדיקטור

xKen-t Williams %R + EMA w/COT Bias GateWhat's original here
This isn't a Williams %R repaint. Standard %R gives a level; this script converts it into a filtered, context-aware timing engine through four combined mechanisms: (1) exit-from-extreme triggers that fire when %R crosses back out of −80/−20 rather than when it reaches them, so signals mark the reversal instead of the ongoing move; (2) EMA-side confirmation that validates the exit against the 13-EMA; (3) a −50 regime filter that blocks counter-regime signals; and (4) a directional-bias gate that normalizes any external series you feed it (e.g. a COT commercial-net line) to a 0–100 position-in-range index and suppresses every signal that disagrees with that bias. The gate is the core idea — it makes the oscillator time entries only in a separately chosen direction, turning a reversal oscillator into a with-context pullback tool. A status table surfaces %R, its EMA, the regime, the active bias, the higher-timeframe read, and the last signal in one place.
Overview
A Williams %R momentum tool rebuilt around three ideas: it signals on the exit from an extreme rather than the touch, confirms that exit with the %R/EMA relationship, and can gate every signal by an external directional bias (such as Commitments of Traders positioning) so only signals agreeing with that bias are shown. This targets the two classic Williams %R weaknesses — catching falling knives at the band, and firing endless counter-trend reversals during strong trends.
What it calculates
- Williams %R (default 21): the standard oscillator (0 to −100) measuring where the close sits within the lookback's high-low range.
- 13-EMA of %R: a smoothing/confirmation line.
- Triggers: in "Band exit" mode a long fires when %R crosses back up through −80 (leaving oversold) and a short when it crosses back down through −20 (leaving overbought). In "EMA cross in zone" mode the trigger is %R crossing its EMA while in the lower/upper half. Either way, it marks the turn, not the extreme reading itself.
- EMA confirmation (optional): requires %R on the trigger side of its EMA at signal time.
Regime filter (optional): longs only when the %R EMA is above the −50 midline, shorts only when below.
- COT Bias Gate: point the "COT source" input at any external series on the chart — e.g. a Commitments of Traders commercial-net or COT-index line. The script converts it to a 0–100 position-in-range index over a lookback; ≥80 is treated as bullish bias, ≤20 as bearish. With the gate on, longs show only in a bullish bias and shorts only in a bearish one; opposite-bias signals are suppressed. You can also set the bias manually or turn the gate off for standalone %R.
- Divergence (optional): regular bull/bear divergence between price pivots and %R pivots.
Higher-timeframe read (optional): shows a higher-timeframe %R value in the table for top-down context.
How to use it
1. Add it on your entry timeframe (defaults: %R 21, EMA 13, band-exit, EMA confirmation on).
2. Set the bias — manually (Bullish/Bearish), or "Auto" pointed at a COT/context line, or Off.
3. Trade the markers: green up-triangle = confirmed long trigger, red down-triangle = confirmed short. Combine with your own levels and risk management.
Notes and limitations
- Divergence markers are drawn back at the confirmed pivot using an offset — they plot in the past and can repaint until the pivot forms. Treat them as context, not a standalone trigger.
- The gate reads whatever series feeds the source input; on the default (Close) the "bias" is computed from price, not COT — point it at a real COT/context line for it to be meaningful.
- The higher-timeframe read uses non-lookahead requests (no future data).
- Analysis tool for timing within a chosen bias. It does not predict outcomes and is not financial advice. אינדיקטור