אינדיקטור

אינדיקטור

אינדיקטור
אינדיקטור

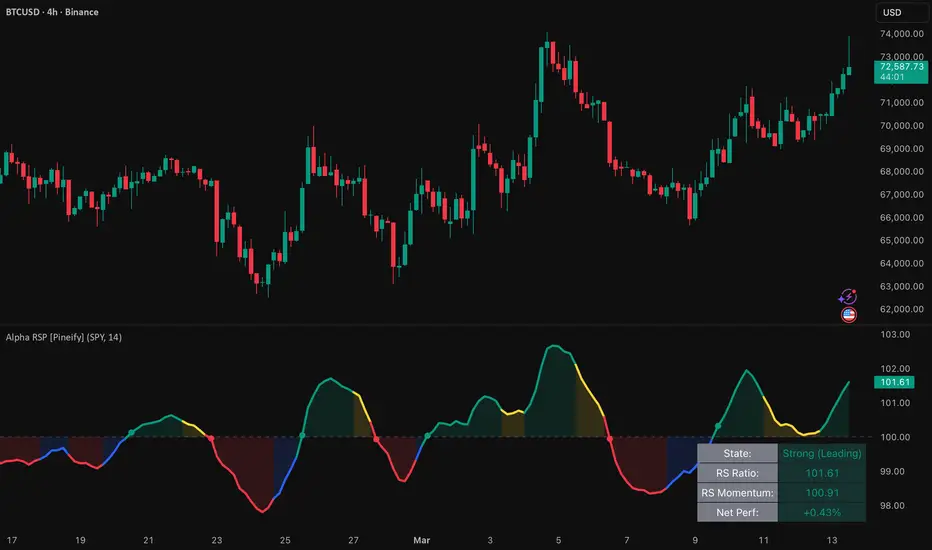
Alpha Relative Strength & Performance [Pineify]Alpha Relative Strength & Performance
The Alpha Relative Strength & Performance (Alpha RSP) indicator is a dual-metric relative strength analysis tool that measures both an asset's outperformance ratio and its momentum trajectory against a user-defined benchmark — providing a complete, four-quadrant classification of relative strength state. Inspired by the Relative Rotation Graph (RRG) methodology developed by Julius de Kempenaer, Alpha RSP distills the two-dimensional RRG framework into a single-pane oscillator that traders can apply to any asset and any benchmark. Instead of simply comparing price returns, the indicator computes a double-smoothed RS Ratio (where the asset sits relative to its own trend of outperformance) and an RS Momentum reading (whether that outperformance is accelerating or decelerating). Together, these two metrics classify the asset into one of four states — Strong, Improving, Weakening, or Weak — with color-coded plotting, area fills, crossover signals, and a real-time dashboard table. This gives traders an objective, quantitative framework for sector rotation, pair trading, and relative performance timing.
Key Features
Double-smoothed RS Ratio oscillator — uses two layers of Weighted Moving Average (WMA) smoothing on the raw price ratio to produce a stable, noise-resistant measure of relative outperformance centered around the 100 equilibrium line.
RS Momentum (second derivative) — calculates the rate of change of the RS Ratio itself, revealing whether outperformance is accelerating or decelerating before the RS Ratio line visually turns.
Four-quadrant state classification — categorizes the asset into Strong (Leading), Improving, Weakening, or Weak (Lagging) based on the combination of RS Ratio and RS Momentum relative to 100, mirroring the proven RRG quadrant system.
Momentum-confirmed crossover signals — bullish entry signals require the RS Ratio to cross above 100 with pre-confirmed positive momentum; bearish exit signals require a cross below 100 with pre-confirmed negative momentum, filtering out low-conviction transitions.
Net Performance delta — independently calculates bar-by-bar alpha (asset return minus benchmark return) as a supplementary metric displayed in the info table.
Real-time dashboard table — a four-row info panel displays the current quadrant state, RS Ratio value, RS Momentum value, and net performance percentage, all color-coded for instant visual assessment.
Flexible benchmark selection — compare against any symbol available on TradingView (SPY, QQQ, BTCUSD, sector ETFs, etc.), making the indicator applicable to equities, crypto, forex, and commodities.
Built-in alert conditions — four configurable alerts cover bullish entries, bearish exits, and sustained strong/weak state detection for hands-free monitoring.
How It Works
The indicator follows a multi-stage calculation pipeline that transforms a raw price ratio into a classified relative strength state:
Benchmark data sourcing: The benchmark's closing price is fetched using request.security() with a one-bar lookback and lookahead enabled. This ensures only confirmed (already closed) benchmark data is used, preventing repainting. A validity check guards against missing data, falling back to neutral values (1.0 for ratios, 100 for normalized metrics) when the benchmark is unavailable.
Relative Strength (RS) calculation: The raw RS is computed as Asset Close / Benchmark Close. A rising RS means the asset is gaining value faster (or losing value slower) than the benchmark. This raw ratio is then smoothed with a Weighted Moving Average (WMA) of configurable length to establish the asset's trend of relative performance.
RS Ratio normalization: The RS Ratio measures where the current RS sits relative to its own WMA trend: RS_Ratio = WMA(RS / WMA_RS) × 100. Values above 100 indicate the asset is outperforming its own recent relative trend (leading); values below 100 indicate underperformance (lagging). The double WMA smoothing — first on the raw RS, then on the ratio — significantly reduces noise while preserving responsiveness.
RS Momentum derivation: RS Momentum is the rate of change of the RS Ratio: RS_Mom = RS_Ratio / WMA(RS_Ratio) × 100. This "second derivative" of relative strength reveals whether the RS Ratio is accelerating (above 100) or decelerating (below 100). Momentum turns often precede RS Ratio turns, providing an early warning of quadrant transitions.
State classification and signal generation: The combination of RS Ratio and RS Momentum relative to the 100 baseline classifies the asset into one of four quadrants. Crossover signals are generated when the RS Ratio crosses the 100 line with momentum confirmation from the previous bar, ensuring entries and exits occur only during high-conviction quadrant transitions.
Trading Ideas and Insights
Sector rotation timing: Apply Alpha RSP to sector ETFs (XLK, XLF, XLE, etc.) against SPY as the benchmark. Assets in the Strong quadrant (green) are the current market leaders — favor long positions in these sectors. Assets in the Weak quadrant (red) are lagging — avoid or consider short positions. The quadrant rotation (Strong → Weakening → Weak → Improving → Strong) follows a predictable clockwise pattern that can be used to anticipate sector leadership changes.
Pair trading confirmation: When comparing two correlated assets, use Alpha RSP on one asset with the other as the benchmark. A sustained Strong state suggests going long the asset and short the benchmark; a sustained Weak state suggests the reverse. The crossover signals provide specific entry and exit timing for the pair trade.
Momentum-based entries: The bullish entry signal (green circle) fires when the RS Ratio crosses above 100 with positive momentum — this is the moment the asset transitions into the Strong quadrant. Historically, assets entering the Strong quadrant tend to continue outperforming for multiple bars, making this a high-probability entry point for relative outperformance trades.
Early warning via momentum divergence: Monitor the RS Momentum independently. When an asset is in the Strong quadrant but RS Momentum drops below 100, it transitions to Weakening (yellow) — outperformance is decelerating even though the asset still leads. This early warning allows traders to tighten stops or reduce position size before the RS Ratio itself crosses below 100.
Benchmark-relative alpha tracking: The Net Performance row in the info table shows the bar-by-bar return difference between the asset and benchmark. Use this to monitor whether your holdings are generating positive alpha on each bar, independent of the smoothed RS calculations.
How Multiple Indicators Work Together
Alpha RSP integrates several analytical components into a unified relative strength assessment system, each serving a distinct purpose:
Weighted Moving Average smoothing (trend extraction): WMA is applied twice in the calculation chain — first to smooth the raw RS ratio, then to normalize the RS Ratio and compute RS Momentum. WMA was chosen over SMA or EMA because its linear weighting scheme provides a good balance between responsiveness and smoothness. The double application creates a cascading filter that removes short-term noise while preserving the medium-term trend of relative performance.
RS Ratio (position measurement): The RS Ratio answers the question "is the asset currently outperforming or underperforming its own recent relative trend?" By normalizing the raw RS against its WMA, the indicator creates a mean-reverting oscillator centered at 100 that is comparable across different assets and timeframes — regardless of the absolute price levels of the asset and benchmark.
RS Momentum (direction measurement): The RS Momentum answers the question "is the relative outperformance getting better or worse?" This second derivative adds the critical directional dimension that the RS Ratio alone cannot provide. An asset can be above 100 (leading) but with momentum below 100 (weakening) — meaning it still outperforms but is losing its edge. This distinction is what enables the four-quadrant classification.
Crossover signals with momentum confirmation (timing mechanism): Raw crossovers of the RS Ratio above/below 100 would generate signals at every quadrant boundary. By requiring momentum confirmation from the previous bar, the signal filter ensures that only transitions into the Strong quadrant (bullish) or Weak quadrant (bearish) generate signals — skipping the ambiguous transitions into Improving or Weakening states.
The synergy is hierarchical: raw price ratio → WMA-smoothed trend → normalized RS Ratio (position) → RS Momentum (direction) → four-quadrant classification → momentum-confirmed crossover signals. Each layer adds a dimension of analysis, and the final signals require alignment across all layers — the asset must cross the outperformance threshold AND have confirmed momentum direction to trigger.
Unique Aspects
RRG methodology in a single pane: Traditional Relative Rotation Graphs require a two-dimensional scatter plot with RS Ratio on the x-axis and RS Momentum on the y-axis. Alpha RSP condenses this into a standard oscillator pane by plotting the RS Ratio as the primary line and encoding the momentum dimension through color (four-quadrant coloring). This makes the RRG framework accessible within TradingView's standard indicator layout without losing the quadrant classification.
Double WMA smoothing architecture: Most relative strength indicators use a single smoothing pass (e.g., SMA or EMA of the price ratio). Alpha RSP's double WMA approach — smoothing the raw RS, then smoothing the normalized ratio — creates a more stable oscillator that filters out short-term noise while remaining responsive to genuine trend changes in relative performance.
Non-repainting benchmark data: The indicator fetches benchmark data with a one-bar offset (close ) and lookahead enabled, ensuring that only confirmed historical data is used. This prevents the common repainting issue where indicators using request.security() produce different historical signals depending on when they are loaded.
Momentum-confirmed signals: Unlike simple ratio crossover systems, Alpha RSP requires the previous bar's momentum to confirm the direction of the crossover. This dual-condition filter significantly reduces false signals during choppy, mean-reverting relative performance periods where the RS Ratio oscillates around 100 without establishing a clear trend.
How to Use
Add the indicator to your chart. It appears in a separate pane below the price chart, displaying the RS Ratio line, a dashed equilibrium baseline at 100, and a color-coded area fill.
Set the Benchmark Symbol to the index or asset you want to compare against. Use SPY for broad US equity comparison, QQQ for tech-weighted comparison, BTCUSD for crypto relative analysis, or any other symbol relevant to your trading universe.
Adjust the Calculation Window based on your trading timeframe. The default of 14 works well for daily charts. Use shorter values (7–10) for intraday or short-term swing trading; use longer values (21–50) for position trading or weekly charts.
Monitor the line color for the current quadrant state: green = Strong (outperforming with rising momentum), blue = Improving (underperforming but momentum turning positive), yellow = Weakening (outperforming but momentum fading), red = Weak (underperforming with falling momentum).
Watch for green circle signals — these mark Bullish Entry points where the RS Ratio crosses above 100 with confirmed positive momentum, indicating the asset is entering the Strong quadrant. Consider initiating or adding to long positions relative to the benchmark.
Watch for red circle signals — these mark Bearish Exit points where the RS Ratio crosses below 100 with confirmed negative momentum, indicating the asset is entering the Weak quadrant. Consider reducing exposure or exiting positions.
Check the info table in the bottom-right corner for a real-time summary of the current state, RS Ratio, RS Momentum, and net performance values.
Set up alerts using the four built-in alert conditions to receive notifications for bullish entries, bearish exits, or sustained strong/weak states without watching the chart.
Customization
Benchmark Symbol (default: SPY): The reference asset for relative strength comparison. Choose a benchmark that represents the market or sector you want to measure outperformance against. For equity traders, SPY or a sector ETF is typical. For crypto traders, BTCUSD provides a relative strength reading against the dominant cryptocurrency.
Calculation Window (default: 14): Controls the WMA smoothing period for both the RS Ratio and RS Momentum calculations. Lower values (7–10) produce a more volatile, responsive oscillator that captures short-term relative strength shifts — suitable for active trading. Higher values (21–50) produce a smoother oscillator that focuses on medium-term relative trends — suitable for position trading and sector rotation strategies.
Quadrant Colors: All four quadrant colors are fully customizable. The default scheme (green/blue/yellow/red) follows the standard RRG color convention, but you can adjust these to match your chart theme or personal preference. Colors are applied to the RS Ratio line, area fill, signal markers, and info table simultaneously.
Conclusion
The Alpha Relative Strength & Performance indicator brings the proven Relative Rotation Graph methodology into a streamlined, single-pane oscillator format. By computing both an RS Ratio (where the asset stands relative to its benchmark trend) and an RS Momentum (whether that standing is improving or deteriorating), it provides a complete four-quadrant classification of relative strength that goes far beyond simple price ratio comparison. The double WMA smoothing architecture delivers clean, noise-resistant readings, while momentum-confirmed crossover signals filter out low-conviction transitions. Whether you are timing sector rotations, managing pair trades, or simply tracking whether your holdings are generating alpha relative to a benchmark, Alpha RSP provides an objective, quantitative framework for relative performance analysis across any market and timeframe.
אינדיקטור

אינדיקטור

RSI Divergence (Regular + Hidden + Live) - StableLogicTake your momentum trading to the next level with the RSI Divergence (Regular + Hidden + Live) indicator . This tool doesn't just look at the past; it actively tracks developing price action to spot potential reversals and trend continuations before they fully form.
Packed with a clean, gradient-based UI, this indicator automatically scans for four specific types of divergences and visually plots them directly on your oscillator panel.
🌟 Key Features
Complete Divergence Detection: Automatically identifies and plots all four major types of divergence:
Regular Bullish: Price makes a Lower Low, but RSI makes a Higher Low (Trend Reversal).
Regular Bearish: Price makes a Higher High, but RSI makes a Lower High (Trend Reversal).
Hidden Bullish: Price makes a Higher Low, but RSI makes a Lower Low (Trend Continuation).
Hidden Bearish: Price makes a Lower High, but RSI makes a Higher High (Trend Continuation).
Live "Pending" Divergences: Unlike traditional indicators that only plot after a pivot is fully confirmed (which inherently causes lag), this script features a Live Tracking engine. It compares the current real-time candle to the last confirmed pivot, drawing a dashed line to warn you of a developing divergence.
Smart Invalidation Logic: The live tracking feature includes a mathematical crossover check. If the RSI line breaks the divergence trendline prematurely, the pending signal is automatically invalidated, keeping your chart free of false signals.
Modern Visuals: Features sleek gradient fills for the Overbought (>70) and Oversold (<30) zones, making momentum extremes easy to spot at a glance.
⚙️ Settings & Customization
RSI Length: Standard RSI lookback period (Default: 14).
Pivot Lookback (Delay): Determines how many bars are required to confirm a swing high or low. A lower number (e.g., 3) makes the indicator faster but slightly riskier/noisier. The default of 5 is a balanced standard.
History Depth: Controls how far back the indicator searches for past pivots to compare against (Default: 20).
Show Live (Pending)?: Toggle the real-time dashed tracking lines on or off.
Custom Colors: Fully customize the line and label colors for every single type of divergence to match your personal chart theme.
Pro Tips for Trading Divergence
Pending = Prepare: When you see a dashed orange "Live Pending" line, do not enter immediately. Use it as a warning to get your trigger ready. Wait for the candle to close or look for a confirmation signal (like a bullish engulfing or pin bar) on the price chart.
Context is King: Regular divergences work best at major support/resistance levels. Hidden divergences work best when trading with the higher timeframe trend.
Combine Tools: RSI divergence is a powerful tool, but it shouldn't be used in isolation. Combine it with Volume, Moving Averages, or Market Structure breaks for high-probability setups.
*** Disclaimer: This script is for educational and analytical purposes only and does not constitute financial advice. אינדיקטור

אסטרטגייה

RSI-Gauss-WiPSTRATEGY OVERVIEW: RSI-Gauss-WiP Momentum Breakout
THE CONCEPT:
This strategy is designed to capture high-probability trend expansions by combining advanced signal processing with classic momentum oscillators. Instead of using traditional moving averages (which suffer from significant lag), this strategy utilizes an N-Pole Gaussian Filter to create a smoother, more responsive baseline and volatility channel.
THE MECHANICS:
Gaussian Channel: We use a multi-pole Gaussian filter (default: 4 poles) to create a "Filtered True Range" channel. Unlike Bollinger Bands, this channel uses a bell-curve weighting to filter out market noise and focus on the true directional energy of the price.
Stoch-RSI Momentum: We don't just buy breakouts; we confirm them with momentum. The strategy looks for the Stoch-RSI to be at extreme levels (above 80 or below 20), indicating that the breakout is backed by strong cyclical momentum rather than just a random price spike.
+1
Trend Alignment: Long positions are only taken when the Gaussian Filter is sloping upwards (Green), ensuring we are trading in harmony with the underlying trend.
ENTRY & EXIT LOGIC:
Long Entry:
Gaussian Trend is bullish (sloping up).
Price crosses and closes above the High Band (Volatility Breakout).
Stoch-RSI K-line is above the D-line.
Stoch-RSI is at an extreme momentum reading (>80 or <20).
Long Exit:
Price crosses back under the Gaussian Filter (The midline). This acts as a trailing "equilibrium" stop to protect capital during a trend reversal.
KEY FEATURES:
Lag Reduction: Includes a "Reduced Lag Mode" and "Fast Response Mode" for traders looking to catch turns even earlier.
Clean Interface: The script is optimized for a clean chart—status line values and execution labels are hidden by default to allow you to focus on the price action.
Time-Filtering: Built-in back testing window to analyze performance across specific market regimes.
HOW TO USE:
Timeframes: Works best on the 1H, 4H, and Daily timeframes where Gaussian smoothing is most effective at removing "intra-day noise." Check each timeframe for your specific pair, e.g. BTC-USDC, ETH-USDC, LINK-USDC, etc.
ASSETS:
Optimized for trending assets like BTC, ETH, and high-beta stocks.
Tip: If the market is in a heavy sideways chop, increase the "Poles" (N) to 6 or 8 to increase the smoothness of the filter. אסטרטגייה

Quantum Relative Performance Oscillator [Pineify]Quantum Relative Performance Oscillator
A sophisticated relative strength indicator that normalizes performance metrics to identify true momentum shifts between an asset and its benchmark.
The Quantum Relative Performance Oscillator (RPO) is an advanced technical indicator designed to measure and visualize how a specific asset performs relative to a benchmark index. Unlike traditional relative strength indicators that can drift over time, this indicator normalizes the RS ratio to center around zero, providing traders with a clearer, more accurate picture of momentum shifts.
The Quantum RPO addresses a fundamental limitation in traditional relative strength analysis. While standard RS indicators show whether an asset is outperforming or underperforming a benchmark, they don't easily reveal when that outperformance is accelerating or decelerating. This indicator solves that problem by normalizing the relative strength ratio and applying weighted moving average smoothing to create clear, actionable trading signals.
Key Features
Normalized RS Calculation: Centers the relative strength ratio around zero, eliminating long-term drift and making it easier to identify current momentum trends
Weighted Moving Average (WMA) Processing: Uses WMA instead of simple moving averages for more responsive calculations that give greater weight to recent price action
Dynamic Color Histogram: Visual representation of momentum acceleration and deceleration with intelligent color coding
Crossover Signals: Clear bullish and bearish momentum shift indicators when the RS Ratio crosses above or below the signal line
Customizable Benchmark: Compare any asset against a user-selected benchmark symbol (default: SPY)
Adjustable Parameters: Configurable lookback length and signal smoothing for different timeframes and trading styles
Built-in Alerts: Automated notifications for momentum shift events
How It Works
The indicator fetches closing prices for both the current asset and the user-defined benchmark symbol
It calculates the raw Relative Strength (RS) by dividing the asset's close price by the benchmark's close price
A Weighted Moving Average (WMA) is applied to the RS to establish a baseline equilibrium level
The RS Ratio is calculated as: (RS / WMA) * 100 - 100, which normalizes the value around zero
A Signal Line is created by applying additional WMA smoothing to the RS Ratio
The histogram (Performance Delta) shows the difference between the RS Ratio and Signal Line, indicating momentum strength
Trading Ideas and Insights
Momentum Confirmation: Use the RS Ratio crossing above zero as confirmation that an asset is gaining relative strength against its benchmark
Trend Reversal Signals: Watch for bullish crossovers (RS Ratio crossing above Signal Line) to identify potential trend reversals
Relative Strength Screening: Compare multiple assets using the same benchmark to identify the strongest performers in a sector
Divergence Detection: Look for situations where price makes new highs but the RS Ratio fails to confirm, indicating weakening relative momentum
Sector Rotation: Use different benchmarks (sector ETFs) to identify rotation between sectors
How Multiple Indicators Work Together
This indicator combines three separate but complementary calculations to create a comprehensive relative strength tool:
The raw RS calculation provides the fundamental comparison between asset and benchmark performance
The WMA normalization removes drift and creates a centered oscillator that oscillates around zero
The signal line smoothing filters out noise and provides clear crossover points for trading signals
The histogram visualization combines both elements to show the magnitude and direction of momentum in one clear display
Unique Aspects
Unlike traditional RS indicators that can drift indefinitely higher or lower over time, the Quantum RPO's normalized calculation ensures the oscillator remains centered, making it easier to identify overbought and oversold conditions in relative terms
The dynamic color histogram provides intuitive visual feedback about whether momentum is accelerating or decelerating, helping traders avoid false signals
The use of Weighted Moving Averages rather than simple moving averages provides more responsive calculations that adapt faster to changing market conditions
The built-in alert system allows traders to receive notifications automatically when momentum shifts occur, without needing to constantly monitor the chart
How to Use
Apply the indicator to any asset's chart
Select your preferred benchmark symbol in the settings (SPY for US stocks, BTCUSD for crypto, etc.)
Interpret the RS Ratio: Positive values indicate outperformance, negative values indicate underperformance
Use the Signal Line crossovers for entry signals: Buy when RS Ratio crosses above Signal Line, Sell when it crosses below
Monitor the histogram for momentum confirmation: Green columns rising indicate strengthening bullish momentum, red columns falling indicate strengthening bearish momentum
Set up alerts for bullish and bearish momentum shifts to receive notifications
Customization
Benchmark Symbol: Change the comparison asset (SPY, QQQ, BTCUSD, etc.)
Lookback Length: Adjust the period for WMA calculations (default: 20). Higher values produce smoother results with more lag; lower values are more responsive but may generate more false signals
Signal Length: Modify the smoothing period for the signal line (default: 9)
Color Customization: Customize the bullish (outperforming) and bearish (underperforming) colors to match your preferences
These parameters can be adjusted to suit different trading timeframes, from intraday scalping to long-term position trading
The Quantum Relative Performance Oscillator is a powerful tool for traders who want to understand not just whether an asset is outperforming its benchmark, but whether that outperformance is accelerating or losing steam. By normalizing the relative strength calculation and providing clear visual and alert-based signals, it helps traders make more informed decisions about entries, exits, and asset allocation across different markets and timeframes.
אינדיקטור

Advanced SuperTrend and Volume Oscillator IndicatorOverview
This is an Advanced Momentum Confluence Engine which is a state-aware, intraday algorithmic trading script. It blends structural trend identifiers (SuperTrend, VWAP) with raw momentum oscillators (Volume, Stochastic RSI).
The system ensures high-probability entries through strict 2-bar trajectory confirmation and price-action validation. It features an isolated state machine, custom time-based end-of-day (EOD) square-offs tailored for the Indian market, and structured JSON outputs for seamless integration with external Python execution engines.
Core Indicator Components
A. Trend Structure: SuperTrend
Acts as the macro directional bias and dynamic trailing support/resistance.
Calculation: Standard ATR-based multiplier.
Parameters: ATR Length = 10, Multiplier = 3.0.
System States: Bullish (stGreen), Bearish (stRed).
B. Intraday Mean: Volume Weighted Average Price (VWAP)
Acts as the baseline for intraday valuation, structural trade confirmation, and early stop-loss triggers.
Calculation: Standard Session VWAP based on Typical Price (hlc3).
C. Volume Acceleration: Raw Volume Oscillator
Measures relative volume momentum to confirm institutional participation without lagging EMA overlays.
Calculation: $100 \times \frac{EMA(Volume, 5) - EMA(Volume, 10)}{EMA(Volume, 10)}$
Parameters: Short EMA = 5, Long EMA = 10.
D. Price Velocity: Averaged Stochastic RSI
Measures the speed of price movement relative to its recent intraday range.
Calculation: Computes the mathematical average of the %K and %D lines (avgStoch).
Parameters: RSI Length = 14, Stochastic Length = 14, K Smooth = 3, D Smooth = 3.
Extremity Zones: Oversold (< 20), Overbought (> 80), Stuck Bottom (<= 1), Stuck Top (>= 99).
3. Signal Validation & Price Action Filters
To eliminate "head fake" signals and slippage, the engine requires a combination of sustained momentum and immediate price action alignment.
2-Bar Momentum Trajectory:
Both the Volume Oscillator and the Stochastic RSI must be actively moving in the intended direction for two consecutive bars.
Rising : ta.rising(val, 2) (Current > Previous > 2 Bars Ago).
Falling : ta.falling(val, 2) (Current < Previous < 2 Bars Ago).
Candle Color Validation: The engine will not buy into active selling or sell into active buying.
Long Requirement: Execution candle must be Green (close > open).
Short Requirement: Execution candle must be Red (close < open). אינדיקטור

אינדיקטור

אינדיקטור

אסטרטגייה

אינדיקטור

אינדיקטור

אינדיקטור
אינדיקטור

אינדיקטור
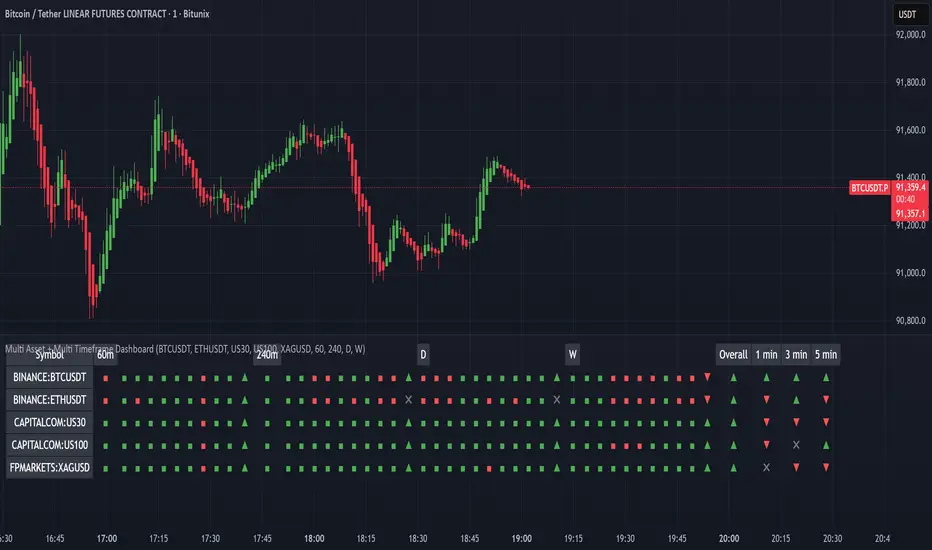
Multi Asset + Multi Timeframe DashboardMulti Asset + Multi Timeframe Dashboard
Overview
This indicator is a multi-asset, multi-timeframe trend dashboard designed to provide a fast, structured overview of market direction across several instruments and timeframes at once.
It combines five major assets with four configurable higher timeframes, evaluating each using a fixed set of 10 widely used technical indicators. The results are aggregated into a clear overall trend arrow, allowing traders to quickly assess alignment or divergence without chart clutter.
What This Indicator Does
For each symbol and timeframe, the script evaluates the following technical components:
EMA trend structure (20 / 50 / 200)
MACD line direction
MACD histogram polarity
RSI relative to its moving average
RSI above/below 50
Stochastic K vs D
Commodity Channel Index (CCI)
Awesome Oscillator (AO)
Each component contributes a bullish (+1), bearish (−1), or neutral (0) score.
All scores are aggregated into a single overall trend direction, displayed as:
▲ Uptrend
▼ Downtrend
✖ Neutral / Mixed
This process is repeated across four independent timeframes, giving a compact, multi-timeframe trend overview per asset.
Key Features
Multi-Asset Dashboard
Monitor multiple markets simultaneously from a single table.
Multi-Timeframe Analysis
Four independently selectable timeframes per symbol.
Indicator Aggregation Logic
Combines multiple classic indicators into a single directional signal.
Non-Intrusive Display
Table-based output keeps the chart clean and readable.
Who This Indicator Is For
This tool is designed for traders who want:
A high-level trend overview across assets
Multi-timeframe confirmation
Clear directional signals without stacking many indicators
Immediate notification of meaningful trend changes
It is not a standalone trading system, but a decision-support and market-context tool.
Usage Notes
The table display is optimized for 1-minute to 5-minute charts due to TradingView table rendering limits.
The indicator is intended for analysis and alerting, not automated execution.
All logic is transparent and based on well-known technical indicators.
Disclaimer
This indicator is provided for educational and informational purposes only.
It does not constitute financial advice. Always combine it with proper risk management and independent analysis. אינדיקטור

RSI + MACD (RSI Divergence) V3.2
RSI + MACD (RSI Divergence)
This indicator combines RSI divergence detection with a scaled MACD overlay to help traders visualize momentum structure and divergence more clearly in a single pane.
Instead of using RSI and MACD as isolated signals, this script focuses on relative movement, swing structure, and divergence logic, making it especially useful for discretionary traders who analyze momentum behavior rather than fixed indicator levels.
________________________________________
Key Features
RSI Divergence Engine
• Detects Regular Bullish / Bearish Divergence
• Optional Hidden Divergence (for trend continuation)
• Uses confirmed pivot logic (left/right lookback) to avoid repainting
• Adjustable divergence range to filter weak or overly distant signals
RSI is shifted by -50 to center it around zero, allowing better visual alignment with MACD without affecting divergence logic.
________________________________________
Scaled MACD Overlay (Visual Momentum Only)
• MACD, Signal, and Histogram are rescaled dynamically to match the RSI oscillator range
• Designed for wave structure, phase comparison, and momentum timing
• Not intended as a traditional MACD signal generator
• Helps identify momentum agreement or disagreement with RSI divergence
________________________________________
Clean & Practical Design
• Single pane display (no chart clutter)
• Color warnings for RSI overbought / oversold zones
• Adjustable scaling lookback for different markets and timeframes
• Optimized for smooth performance and non-repainting behavior
________________________________________
How to Use
• Best used on indices, crypto, and liquid forex pairs
• Combine RSI divergence signals with:
o Market structure
o Support / resistance
o Trend context
• Use the MACD overlay to:
o Confirm momentum shifts
o Spot early loss of strength
o Compare oscillator phase alignment
This indicator is best suited for analysis and confirmation, not mechanical entry signals.
________________________________________
Notes
• MACD values are scaled for visualization only and do not represent real MACD values
• Divergence signals are confirmation-based, not predictive
• No repainting once pivots are confirmed
________________________________________
Who Is This For?
• Swing traders
• Momentum & divergence traders
• Traders who prefer structure-based confirmation over raw indicator signals
• Anyone who wants RSI & MACD behavior in a single, readable oscillator
Enjoy and happy trading!
DISCLAIMER
This script is intended for informational and educational purposes only. It does not constitute financial, investment, or trading advice. All trading decisions made based on its output are solely the responsibility of the user
אינדיקטור

אינדיקטור

[RoyalNeuron] RSI-SMA [WidowMaker v1.0]Hey everyone,👋
This is WidowMaker v1.0 — my free take on a really clean, zero-lag smoothed RSI that actually helps you see momentum without all the noise.
What makes it different:
- Smoothed RSI (you pick SMA or EMA) so it doesn’t whipsaw as much as the default one
- Green line when momentum is rising, red when it’s falling — super easy to read at a glance
- Histogram turns solid green for strong upward push, solid red when things are fading
- Very faint green background in oversold (buy zone) and faint red in overbought (caution zone)
Quick way to use it:
- Green line + solid green histogram near the bottom (oversold) → good spot for longs
- Red line + solid red histogram near the top (overbought) → time to think about shorts or taking profit
I made it because I was tired of cluttered indicators that look cool but don’t help much in real trading.
I am thinking of an updated version, still thinking of what to add so that to add value.
Would love your honest feedback — like it, use it, tell me what you’d add. More free tools on the way!
Cheers,
RoyalNeuron 👑
RSI, Smoothed RSI, Momentum, Oscillator, Overbought, Oversold, Histogram, Green Red, Free, Alerts אינדיקטור