אינדיקטור

אסטרטגייה

LCD Breakout ConfirmationLCD Breakout Confirmation Free Indicator
by @Miguelrosal1994
What this is / Qué es esto
Most traders enter breakouts blind. Price breaks a level — they buy or sell. Then price reverses and they wonder why.
This indicator doesn't predict. It measures. It tells you in real time whether the breakout you're watching has the three elements that separate institutional conviction from a retail trap.
La mayoría de los traders entran en breakouts a ciegas. El precio rompe un nivel — compran o venden. Luego el precio revierte y se preguntan por qué.
Este indicador no predice. Mide. Te dice en tiempo real si el breakout que estás viendo tiene los tres elementos que separan la convicción institucional de una trampa retail.
The three factors / Los tres factores
Factor 1 — Volume / Volumen
Volume is the fuel of any real move. When institutions enter, they can't hide — they need size, and size shows up in volume.
If the breakout candle has volume below the 20-bar average, nobody important is participating. That's a fakeout waiting to happen.
Default threshold: 1.2× average. The breakout bar must have at least 20% more volume than normal to score this factor.
El volumen es el combustible de cualquier movimiento real. Cuando los institucionales entran, no pueden esconderse — necesitan tamaño, y el tamaño aparece en el volumen.
Si la vela del breakout tiene volumen por debajo del promedio de 20 barras, nadie importante está participando. Eso es un fakeout esperando ocurrir.
Umbral por defecto: 1.2× el promedio. La vela de ruptura debe tener al menos 20% más volumen que lo normal para puntuar este factor.
Factor 2 — Candle Body / Cuerpo de vela
A real breakout closes far from the broken level. A fakeout touches the level with a long wick and closes back inside — the price tested but didn't commit.
The body is measured relative to the ATR (Average True Range) — the average movement of the instrument in recent bars. This makes the indicator adaptive: a strong body in a low-volatility environment is different from a strong body in a high-volatility one.
Default threshold: 0.4× ATR. The candle body must be at least 40% of the recent average range.
Un breakout real cierra lejos del nivel roto. Un fakeout toca el nivel con una mecha larga y cierra de vuelta adentro — el precio testeó pero no se comprometió.
El cuerpo se mide relativo al ATR (Average True Range) — el movimiento promedio del instrumento en barras recientes. Esto hace el indicador adaptativo: un cuerpo fuerte en un entorno de baja volatilidad es diferente a un cuerpo fuerte en uno de alta volatilidad.
Umbral por defecto: 0.4× ATR. El cuerpo de la vela debe ser al menos 40% del rango promedio reciente.
Factor 3 — Volume Delta (Tick Rule) / Delta de volumen
This is the most sophisticated factor. It doesn't just look at how much volume there was — it looks at where within the bar that volume was traded.
The Tick Rule splits each bar's volume into buy pressure and sell pressure based on where price closed within the range:
Close near the high → buyers were aggressive → positive delta
Close near the low → sellers were aggressive → negative delta
Close in the middle → equilibrium → delta near zero
Formula: delta = volume × (2 × (close - low) / (high - low) - 1)
If price breaks up but the delta is negative — sellers absorbed the move. That's a fakeout. If price breaks up and the delta is strongly positive — buyers drove the move. That's conviction.
Este es el factor más sofisticado. No solo mira cuánto volumen hubo — mira dónde dentro de la vela se negoció ese volumen.
La Tick Rule divide el volumen de cada vela en presión compradora y vendedora según dónde cerró el precio dentro del rango:
Cierre cerca del high → compradores agresivos → delta positivo
Cierre cerca del low → vendedores agresivos → delta negativo
Cierre en el medio → equilibrio → delta cerca de cero
Fórmula: delta = volumen × (2 × (close - low) / (high - low) - 1)
Si el precio rompe al alza pero el delta es negativo — los vendedores absorbieron el movimiento. Eso es un fakeout. Si el precio rompe al alza y el delta es fuertemente positivo — los compradores impulsaron el movimiento. Eso es convicción.
The score / La puntuación
🟢 3/3 — REAL BREAKOUT
All three factors confirm. Volume is there, the candle committed, and order flow agrees. This is where institutions moved. Pay attention.
Los tres factores confirman. El volumen está, la vela se comprometió y el flujo de órdenes concuerda. Aquí es donde se movieron los institucionales. Presta atención.
🟡 2/3 — POSSIBLE — wait
Two factors confirm, one doesn't. The move has partial conviction. Wait for the next candle to confirm or look for additional confluence before entering.
Dos factores confirman, uno no. El movimiento tiene convicción parcial. Espera que la siguiente vela confirme o busca confluencia adicional antes de entrar.
🔴 1/3 or less — FAKEOUT likely
The breakout lacks institutional backing. High probability of reclaim — price returning inside the broken level. Do not chase. Wait.
El breakout carece de respaldo institucional. Alta probabilidad de reclaim — el precio regresando dentro del nivel roto. No persigas. Espera.
How to read the panel / Cómo leer el panel
The panel in the top right always shows the last breakout that occurred — not the current bar. This is intentional. It tells you the quality of the most recent structural move so you can decide whether to trade the aftermath.
The three lines in the sub-panel show current bar values in real time — volume ratio, body ratio, and normalized delta. Watch these lines before a breakout: when volume starts rising and delta starts trending in one direction, something is about to happen.
El panel en la esquina superior derecha siempre muestra el último breakout que ocurrió — no la barra actual. Esto es intencional. Te dice la calidad del movimiento estructural más reciente para que puedas decidir si operar las consecuencias.
Las tres líneas en el sub-panel muestran valores de la barra actual en tiempo real — ratio de volumen, ratio de cuerpo y delta normalizado. Observa estas líneas antes de un breakout: cuando el volumen empieza a subir y el delta empieza a moverse en una dirección, algo está a punto de ocurrir.
How to use it / Cómo usarlo
Works on any instrument and any timeframe. No repainting. No lookahead bias.
Use green columns (3/3) as reference Order Blocks — levels where institutional conviction was confirmed. When price returns to those levels, that's where the reaction is most likely.
I don't give signals. I show where price has to define itself.
Funciona en cualquier instrumento y cualquier temporalidad. Sin repintado. Sin sesgo de lookahead.
Usa las columnas verdes (3/3) como Order Blocks de referencia — niveles donde se confirmó la convicción institucional. Cuando el precio regresa a esos niveles, ahí es donde la reacción es más probable.
No doy señales. Doy puntos donde el precio tiene que definir.
Want more free tools? Comment below. 👇
¿Quieres más herramientas gratuitas? Comenta abajo. 👇 אינדיקטור

אינדיקטור

Tail-Risk & Fragility OscillatorTail-Risk & Fragility Oscillator
A risk-shape meter — not a buy/sell oscillator. It measures the asymmetry (skewness) and tail-fatness (excess kurtosis) of recent returns to answer one question your momentum and trend tools cannot: is fragile, fat-tailed risk building right now, and on which side? It reads this in plain language, optionally from higher-resolution "realized" data, and forward-calibrates whether those fragile states have actually preceded moves on the symbol you're viewing.
Why these parts are combined (not a mashup for show). Skewness says which tail is heavier (where a violent move is more likely to come from). Excess kurtosis says how heavy the tails are (how likely an outsized move is at all). Neither alone is "fragility" — fragility is one tail heavy AND tails fattening together — so both are combined into one reading. Realized estimation (optional) measures these moments from intrabar returns rather than one value per bar, far less noisy. And a Cornish-Fisher value-at-risk turns skew + kurtosis into a single "expected bad-case move" you can size against. Together they form one coherent tail-risk tool.
How it works. Returns feed central moments over a window: skew = m3/σ³, excess kurtosis = m4/m2² − 3. With "Realized" on, the moments come from a lower-timeframe return stream (confirmed only). The signed wave is standardized skewness; a percentile of kurtosis flags fat tails; a Cornish-Fisher quantile combines both, scaled to the chart timeframe over the calibration horizon, into a value-at-risk. A "fragile-down" state (negative-skew extreme + fat tails) is then scored for a subsequent down move and "fragile-up" for an up move, using triple-barrier outcomes, split into in-sample and recent out-of-sample, with a confidence interval and a multiple-testing check.
How to use. Read the Verdict row — "Downside-fragile" / "Upside-fragile" means a heavy tail is building on that side; "Tails normal" means no fragility. The Conviction row says whether that state has actually preceded the expected move on this symbol. Use it to size down, widen stops, or expect violence on the fragile side — layered on your own directional tool, never as a standalone entry. The "Bad-case move" row is the modelled adverse move over the next N bars at your chosen confidence.
What's original. Realized higher-moment estimation, a horizon-scaled Cornish-Fisher VaR readout, the forward triple-barrier calibration with an out-of-sample split, and a conviction read that openly admits when there's no proven edge — on a risk axis (fragility) that most indicators ignore entirely.
Inputs. Price source (change it for any market), reading mode (Simple/Pro), moment and realized-estimation controls, risk thresholds and VaR confidence, full calibration settings, and an auto-adapting dashboard legible on dark or light charts. Defaults are tuned for NSE:NIFTY1! intraday.
Honesty & limitations. Moments from short windows are noisy and the VaR is a model estimate, not a guarantee. Edge figures are computed on this chart's own history with overlapping windows and no costs — context, not a backtest; past behaviour doesn't predict the future.
Disclaimer: for research and education only. Not financial advice. Trading carries risk of loss; manage your own size. אינדיקטור

אינדיקטור
אינדיקטור

אינדיקטור

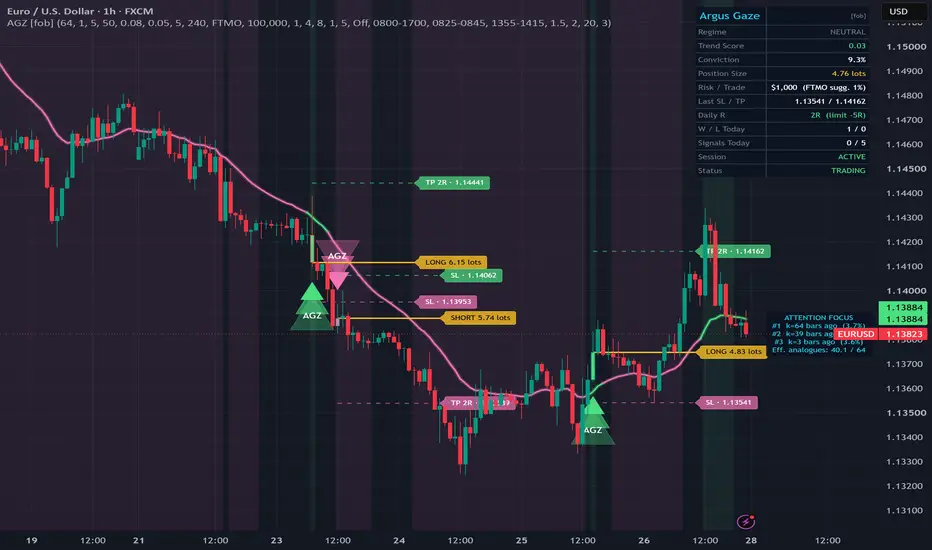
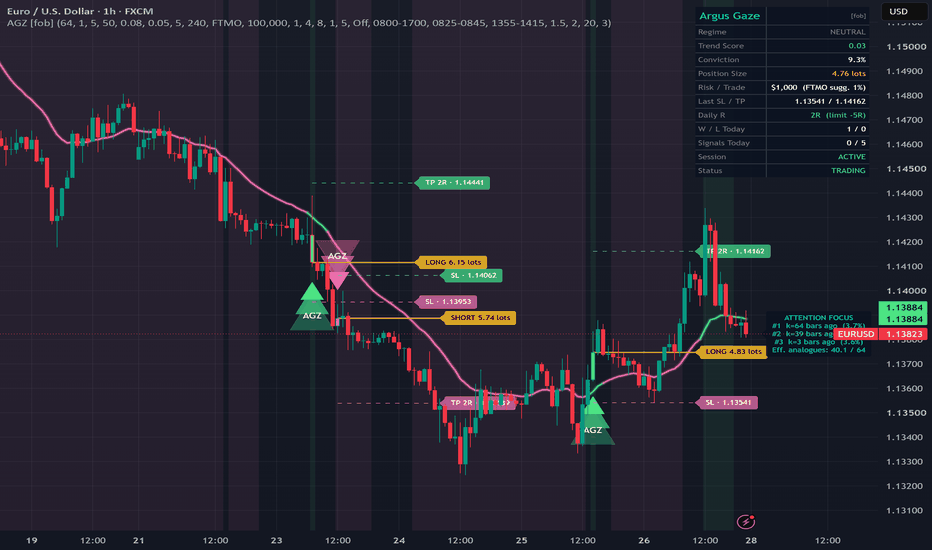
Argus Gaze: Attention Trend Engine [forexobroker]# Argus Gaze: Attention Trend Engine
🔶 OVERVIEW
Argus Gaze brings the attention mechanism — the core idea behind modern transformer models — onto your chart. Instead of asking "what does an indicator formula say about this bar?", it asks a different question: "when did the market last LOOK like this, and what happened next?"
Every bar is encoded as a compact, ATR/z-normalized state vector. A soft-attention head then compares today's state against the last N historical states, weights each one by similarity (softmax over negative distance), and blends their KNOWN follow-up returns into a single forward-looking Trend Score. Because every feature is volatility-normalized, the same settings behave consistently across forex, indices, futures, and crypto.
What makes it different from pattern-matching scripts: attention is SOFT. It never picks one "best match" — it weighs all N analogues at once, and it tells you how focused that weighting is. The attention entropy becomes a conviction gauge: when attention collapses onto a handful of strongly similar past states, conviction is high; when attention is spread thin, the engine is honest about its uncertainty.
The second half of the script is a full prop-firm risk engine: FTMO / Topstep / Apex presets, ATR-based position sizing, simulated R tracking, daily-loss lockout, trailing max-drawdown breach detection, a consistency cap on signals per day, plus session and news-blackout filters. The chart literally tints orange and the dashboard reads STAND DOWN when you should not be clicking buttons.
🔶 ALGORITHM
1. State encoding — each bar becomes a 3-feature vector, all volatility-normalized:
• f1 = (close − close ) / ATR(14) — directional thrust
• f2 = (high − low) / ATR(14) − 1 — range expansion vs. average
• f3 = volume z-score over a 50-bar window (guarded when stdev = 0)
2. Similarity — for each lag k = 1..N (default 64), the squared Euclidean distance d²ₖ between today's vector and the vector k bars ago is computed.
3. Attention logits — simₖ = −d²ₖ / temperature. Temperature controls sharpness: low = spiky attention on the closest analogues, high = smooth blending.
4. Stable softmax — a first pass finds the maximum logit; a second pass computes wₖ = exp(simₖ − maxSim) so the exponentials can never overflow.
5. Known outcomes — each historical state carries the ATR-normalized return that followed it: outₖ = (close − close ) / ATR(14) .
6. Forecast — the attention-weighted average Σ(wₖ · outₖ) / Σwₖ, i.e. "what the market did the last times it looked like this", in ATR units.
7. Trend Score — an EMA (default 5) of the forecast.
8. Conviction — attention entropy −Σ pₖ·ln(pₖ), normalized by ln(N) to ; conviction = 1 − entropy. The Attention Focus label shows the top-3 lags the head is "looking at" plus the effective number of analogues (1/Σp²).
🔶 SIGNAL LOGIC
• BUY — Trend Score crosses above +threshold (default 0.08) with conviction above the floor.
• SELL — Trend Score crosses below −threshold with the same conviction requirement.
• Every signal must additionally pass: signal cooldown (default 5 bars), position-state filter (no stacked same-direction signals), optional HTF EMA(21) trend confirm (last confirmed HTF bar, lookahead off — non-repainting), session filter, news blackout, prop-firm lockout, and the max-signals-per-day consistency cap.
• All signals are evaluated on confirmed bars only (barstate.isconfirmed) — no repainting.
• On each signal the script draws the entry (gold), stop (dashed) and target (dashed) lines with size, SL and TP labels; the last 3 trade line-sets are kept on chart (configurable).
🔶 PROP FIRM ENGINE
Presets load the firm's headline limits; your Risk per Trade % input always rules sizing.
| Preset | Daily Loss | Max Drawdown | Suggested Risk |
|---------|-----------|------------------|----------------|
| FTMO | 5.0% | 10.0% | 1.0% |
| Topstep | 2.0% | 4.0% | 0.5% |
| Apex | 2.5% | 5.0% (trailing) | 0.5% |
| Custom | your input | your input | your input |
• Sizing — risk$ = account × risk%. SL distance = ATR(14) × multiplier (default 1.5). Contracts = risk$ / (SL distance × point value); forex symbols are converted to standard lots, futures/stocks shown as whole contracts.
• Simulated R tracking — one simulated trade at a time at the signal price; each confirmed bar checks SL before TP (conservative). A loss books −1R, a win books +R:R (default +2R) into the daily ledger.
• Daily lockout — when daily R reaches −(daily loss % / risk per trade %), signals stop and the chart background turns orange until the next session day.
• Trailing DD breach — cumulative R is tracked against its peak; if the drawdown in R exceeds the preset's max-drawdown budget, status flips to DD BREACH and signals stop.
• Consistency cap — Max Signals / Day (default 5); the counter resets on each new session day.
🔶 INPUTS
• Algorithm — Attention Lookback N (16–200), Softmax Temperature, Score Smoothing EMA, Volume Z-Score Window.
• Signal Logic — Score Threshold, Conviction Floor, Signal Cooldown Bars, HTF Trend Confirm + HTF Timeframe.
• Prop Firm Rules — Preset (FTMO/Topstep/Apex/Custom), Account Size $, Risk per Trade %, three Custom limit inputs, Max Signals / Day.
• Sessions & News — Session Filter (Off/London/New York/RTH Futures/Custom), Custom Session, News Blackout toggle + two news windows.
• Trade Management — Stop Loss ATR multiple, Reward:Risk, Trade Line Length, Keep Last N Trade Drawings.
• Visual — Dashboard, 3-Layer Signal Glow, Trend Baseline Ribbon, Attention Focus Label, and all colors.
🔶 ALERTS
Webhook-ready alert() JSON fires on every buy/sell close with action, ticker, price, SL, TP, size and daily R. Ten named alert conditions:
1. AGZ Buy
2. AGZ Sell
3. AGZ Any Signal
4. AGZ Regime Bull (score crosses above zero)
5. AGZ Regime Bear (score crosses below zero)
6. AGZ High Conviction (conviction exceeds 50%)
7. AGZ Lockout (daily-loss or drawdown limit hit)
8. AGZ Session Open
9. AGZ Daily Reset
10. AGZ Webhook JSON (placeholder-based JSON payload)
🔶 LIMITATIONS
• Attention finds analogues, not certainties. "What happened after similar states" is a statistical tendency — it is NOT a prediction guarantee, and regimes with no good historical analogue produce low-conviction, low-quality readings.
• The simulated R ledger is indicative only: it fills at the signal close, ignores spread, slippage, commissions and gaps, and resolves SL-before-TP inside a bar. It is a discipline gauge, not broker P&L — your real account ledger always rules.
• Position sizing relies on syminfo.pointvalue; for CFDs and some exotic symbols verify the suggested size against your broker's contract specification before trading.
• Session and news windows use the chart symbol's exchange timezone; adjust the windows when trading symbols on other exchanges.
• On very short lookbacks or illiquid symbols the volume z-score feature degrades (stdev guard returns 0); the engine still works on the two price features.
• Signals are confirmed-bar only by design, so they appear at the close of the signal bar, never intrabar.
• This is an analysis tool, not financial advice. Past behavior of similar market states does not guarantee future results.
🔶 RELEASE NOTES
v1.0 — Initial release. Soft-attention trend engine (stable softmax, entropy-based conviction, top-3 attention focus readout), prop-firm risk engine with FTMO/Topstep/Apex/Custom presets, simulated R ledger with daily lockout and trailing DD breach, session + news filters, HTF confirm, trade line-sets, 12-row dashboard, webhook JSON alerts and 10 alert conditions.
#ftmo
אינדיקטור
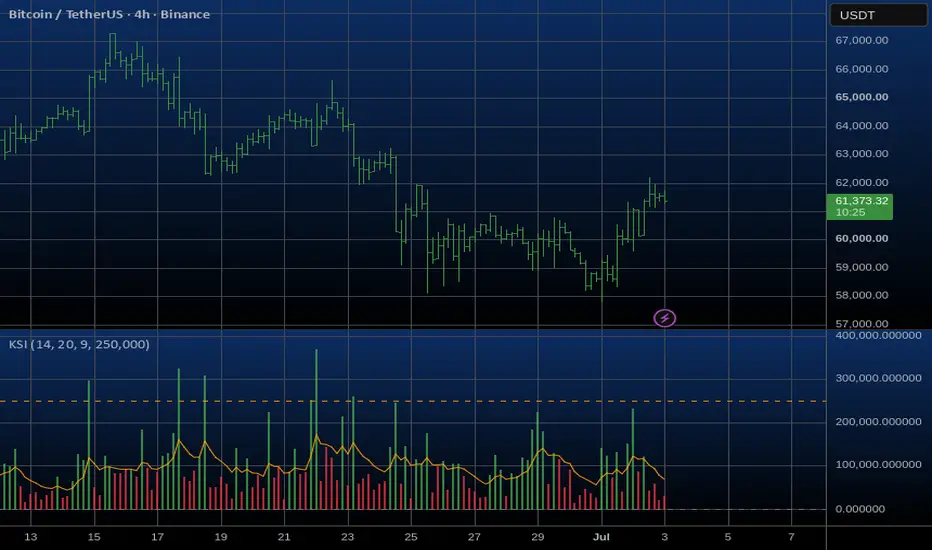
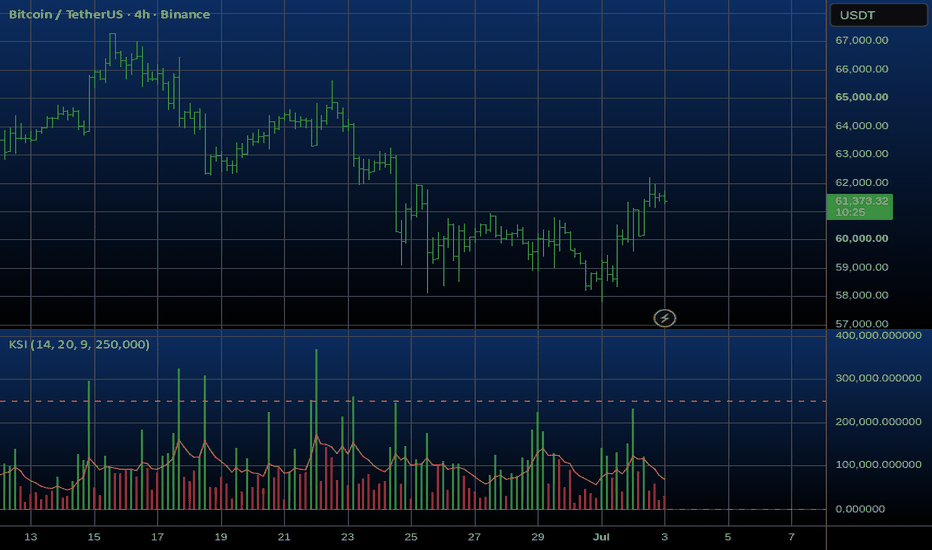
Kinetic Slippage Index (KSI)Overview
The Kinetic Slippage Index (KSI) is an advanced volume-volatility oscillator designed to measure market efficiency—or the lack thereof. Inspired by order book microstructure and liquidity gaps, KSI calculates the "cost of price movement." It helps traders identify hidden institutional distribution, retail exhaustion, and high-probability false breakouts.
Unlike standard momentum oscillators (RSI, Stochastic) that only track price speed, KSI analyzes how much raw volume was required to achieve a specific price range.
The Theoretical Concept
In a highly liquid and efficient market, large trading volumes are absorbed by dense limit orders, causing the price to move smoothly and tightly.
However, when liquidity clears out (an "empty order book" or "liquidity vacuum"), even a small market order can cause a massive price jump. This phenomenon is called slippage.
KSI mathematically captures this by squaring the True Range and dividing it by the current Volume and its long-term EMA.
- High KSI: Price is flying or dropping fast, but on critically low volume. The market is "hollow."
- Low KSI: Enormous volume is pouring in, but the price is compressed into tight bars. Heavy institutional absorption is taking place.
How to Trade with KSI (Key Use Cases)
1. Fading False Breakouts (The "SPIKE" Signal)
- Scenario: The price breaks out of a key resistance or support level, creating a new local high/low.
- KSI Behavior: A purple "SPIKE" marker appears, meaning KSI has crossed above the critical threshold.
- Interpretation: The breakout is happening on a "hollow" market without institutional backing. It is highly likely a liquidity hunt (stop-run).
- Strategy: Look for a reversal pattern on the price chart and trade against the breakout (Fade).
2. Trend Exhaustion & Climax
- Scenario: The asset is in a strong, prolonged trend. Suddenly, a massive price bar occurs in the direction of the trend.
- KSI Behavior: KSI prints a series of extreme high histogram bars or triggers a "SPIKE" alert.
- Interpretation: This is a buying/selling climax (exhaustion). Smart money is withdrawing their limit orders, letting late retail buyers push the price into a vacuum right before the crash.
- Strategy: Tighten trailing stops on current positions or prepare for a counter-trend setup.
3. Institutional Accumulation / Compression
- Scenario: Price enters a tight, boring consolidation (flat).
- KSI Behavior: The histogram bars turn red and get tightly compressed near the zero line, staying significantly below the orange Signal Line.
- Interpretation: Huge trading volume is being injected, but the price isn't moving. Big players are quietly accumulating or distributing positions using iceberg orders.
- Strategy: Do not trade inside this zone. Prepare for a massive, explosive breakout. Wait for the KSI histogram to flip green and cross above the Signal Line to confirm the direction.
Inputs & Customization
- ATR / Range Period (Default: 14): Controls the lookback window for measuring the price range.
- Volume EMA Period (Default: 20): Smooths out volume to create a reliable benchmark for average liquidity.
- Signal Line Period (Default: 9): An EMA of the KSI itself, used to detect shorter-term shifts in momentum (Green/Red histogram flips).
- Spike Signal Level (Default: 50000): Critical value line for alerts.
אינדיקטור
אינדיקטור
McGinley T3 Flow Campaign [NICK789] v.1McGinley T3 Flow Campaign is a trend-following strategy built around an adaptive signal trail and a campaign-style trade management model.
The script is designed to identify confirmed trend-flow transitions, open a long or short campaign, and then display entry, target, and optional stop levels directly on the chart. It is not intended to predict tops or bottoms. Instead, it waits for the selected flow engine to shift direction and then manages the trade as a structured campaign.
━━━━━━━━━━━━━━━━━━━━━━
CORE IDEA
━━━━━━━━━━━━━━━━━━━━━━
The main concept is to combine an adaptive moving-average engine with an ATR-based trailing structure.
The signal engine can use:
• McGinley Dynamic only
• T3 smoothing only
• A blend of McGinley Dynamic and T3
The McGinley Dynamic is used because it adapts to changes in price speed more smoothly than a standard moving average. T3 smoothing is included as an optional alternative for traders who prefer a smoother trend basis. The blended mode averages both curves to create a balanced engine between responsiveness and smoothness.
After the engine basis is calculated, the script builds an ATR signal trail around it. The trail updates using volatility distance and then locks in a directional path. A confirmed transition in this trail creates the long or short signal.
This means the signal is not based on a simple moving-average crossover. The strategy waits for the adaptive trail itself to shift direction.
━━━━━━━━━━━━━━━━━━━━━━
HOW SIGNALS ARE GENERATED
━━━━━━━━━━━━━━━━━━━━━━
A long signal occurs when the ATR signal trail confirms an upward transition.
A short signal occurs when the ATR signal trail confirms a downward transition.
Signals are confirmed on closed bars. This helps avoid reacting to unfinished candle movement.
The script separates main signals from continuation signals:
• Main BUY / SELL labels appear when a new direction starts
• Smaller continuation triangles appear when the same direction refreshes
This keeps the chart cleaner while still showing when the flow continues in the same direction.
━━━━━━━━━━━━━━━━━━━━━━
CAMPAIGN TARGET MODEL
━━━━━━━━━━━━━━━━━━━━━━
Instead of using only fixed ATR targets, this strategy uses a campaign target system.
There are two target modes:
1. Flow Trail Based
Targets are projected from the distance between price and the active ATR signal trail. This makes the target model expand and contract with the current trend structure.
2. ATR Baseline
Targets are projected from a standard ATR baseline for traders who prefer a more traditional volatility target model.
The Flow Trail Based mode is the default because it connects the target spacing directly to the same adaptive trail that produced the signal.
Target levels are displayed as:
• Entry
• TP1
• TP2
• TP3
• Optional SL
Each level includes its price on the chart.
━━━━━━━━━━━━━━━━━━━━━━
TAKE PROFIT EXIT MODES
━━━━━━━━━━━━━━━━━━━━━━
The strategy includes multiple take-profit behaviours:
• TP1 Only
• TP2 Only
• TP3 Only
• Scale Out TP1 / TP2 / TP3
In scale-out mode, the position is reduced across TP1, TP2, and TP3 using the percentage settings.
In single-target modes, the strategy exits the full position at the selected target.
This allows the same signal engine to be tested with different trade management styles.
━━━━━━━━━━━━━━━━━━━━━━
STOP MODE
━━━━━━━━━━━━━━━━━━━━━━
The stop system has three modes:
• Off
• Visual Only
• Visual + Strategy Exit
By default, Stop Mode is set to Visual Only.
This means the SL line is shown as a campaign reference, but it does not close the strategy trade unless the user changes Stop Mode to Visual + Strategy Exit.
This is intentional because some traders use the stop line as a visual invalidation reference while others want the strategy tester to execute the stop automatically.
━━━━━━━━━━━━━━━━━━━━━━
DASHBOARD
━━━━━━━━━━━━━━━━━━━━━━
The dashboard shows:
• Selected engine mode
• Selected target mode
• Current flow state
• Current strategy position
• Win rate
• PNL and drawdown
━━━━━━━━━━━━━━━━━━━━━━
HOW TO USE
━━━━━━━━━━━━━━━━━━━━━━
1. Choose the engine mode
McGinley Only is the default and gives a responsive adaptive trend read. T3 Only is smoother. Blend mode combines both.
2. Adjust ATR Trail Length and ATR Trail Multiplier
These settings control how sensitive the signal trail is. Lower values react faster but may create more signals. Higher values create smoother signals but can be slower.
3. Choose the Target Mode
Flow Trail Based uses the distance from price to the signal trail. ATR Baseline uses a standard ATR distance.
4. Choose the Take Profit Exit Mode
Use TP1, TP2, or TP3 only for full exits, or use Scale Out mode for partial profit-taking.
5. Choose the Stop Mode
Use Visual Only for chart reference. Use Visual + Strategy Exit if you want the strategy tester to close trades at the stop level.
6. Use the Backtest Start setting
The Backtest Start input lets users control the test period without changing the script.
━━━━━━━━━━━━━━━━━━━━━━
WHAT MAKES THIS SCRIPT DIFFERENT
━━━━━━━━━━━━━━━━━━━━━━
This script is not a simple collection of unrelated indicators.
The components are connected in a single workflow:
• The McGinley/T3 engine creates the adaptive trend basis
• The ATR signal trail converts that basis into a directional flow line
• Confirmed trail transitions create campaign entries
• The target system projects trade levels from the active flow structure
• The dashboard summarizes the active engine, target model, trade state, and performance
The main purpose of the script is to turn an adaptive trend transition into a structured trade campaign with visible entry, targets, stop reference, and performance context.
━━━━━━━━━━━━━━━━━━━━━━
IMPORTANT NOTES
━━━━━━━━━━━━━━━━━━━━━━
This is a strategy script for backtesting and study. It is not financial advice.
Past performance does not guarantee future results.
Results will vary by symbol, timeframe, spread, commission, session, and market condition.
The script works best when users test different settings for the market they trade instead of assuming one preset fits every asset.
Because this is a trend-following model, it can perform well during directional moves but may produce weaker results during sideways or choppy conditions.
אסטרטגייה

אינדיקטור
אינדיקטור

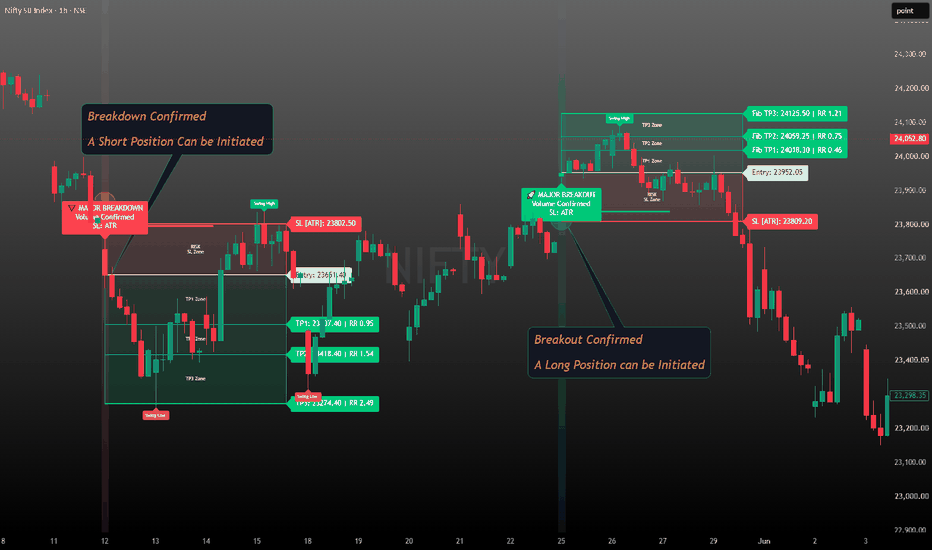
Buy-Sell with Liquidity Breakout PRO using Volume Confluence# Liquidity Breakout PRO with Volume Confirmation — Swing Edition
A professional major swing breakout indicator designed to identify important liquidity breakout and breakdown zones using confirmed swing highs, confirmed swing lows, volume confluence, smart stop-loss modes, Fibonacci-based targets, and historical risk-reward boxes.
This indicator is built for traders who want cleaner breakout signals, structured trade planning, and visual performance review directly on the chart.
--------------------------------------------------
## What This Indicator Does
Liquidity Breakout PRO helps identify major breakout and breakdown opportunities after price crosses an important confirmed swing level.
Instead of reacting to every small move, this indicator focuses on major swing highs and swing lows. These levels often act as liquidity zones where stop orders, breakout traders, and institutional activity may become visible.
When price closes above a confirmed major swing high, the indicator marks a bullish breakout setup.
When price closes below a confirmed major swing low, the indicator marks a bearish breakdown setup.
Each confirmed signal comes with:
✅Entry level
✅Stop-loss level
✅Fibonacci-based target levels
✅Risk zone
✅Reward zone
✅Historical risk-reward box
✅Volume confirmation
✅Dashboard panel
--------------------------------------------------
## Core Concept
Markets often move from one liquidity zone to another.
A major swing high usually represents an area where sellers previously defended price. When price closes above that area with volume confirmation, it may suggest breakout strength.
A major swing low usually represents an area where buyers previously defended price. When price closes below that area with volume confirmation, it may suggest breakdown weakness.
This indicator is designed around that simple idea:
✅Identify major liquidity level
✅Wait for confirmed close beyond that level
✅Check volume confluence
✅Plot entry, stop loss, and Fibonacci targets
✅Keep the setup on chart for future performance review
--------------------------------------------------
## Key Features
📊 1. Major Swing Detection
The indicator uses confirmed pivot highs and pivot lows to identify important swing levels.
These are not random support and resistance lines. They are confirmed swing points based on user-defined left and right pivot strength.
This helps reduce noise and focuses only on important market structure level s.
--------------------------------------------------
📊 2. Non-Repainting Logic
Signals are generated only after candle close.
The indicator uses confirmed pivot levels and candle-close breakout confirmation. This means signals are not designed to appear and disappear during live candle movement.
Important note: pivot-based swing levels naturally confirm after the selected right-side candles are completed. This delay helps improve swing reliability and reduces false signals.
--------------------------------------------------
📊 3. Volume Confluence
Breakout signals become stronger when supported by volume.
The indicator includes a volume filter that checks whether current volume is greater than the average volume multiplied by the selected volume multiplier.
This helps avoid weak breakout attempts where price crosses a level without strong participation.
--------------------------------------------------
📊 4. ATR Breakout Buffer
Many breakouts fail because price barely crosses a level and then quickly reverses.
To reduce such weak signals, the indicator includes an optional ATR-based breakout buffer.
This means price must close beyond the swing level with a minimum volatility-adjusted distance before a signal is generated.
--------------------------------------------------
📊 5. Multiple Stop-Loss Modes
Different traders use different stop-loss styles, so this indicator provides multiple SL calculation modes.
Available stop-loss modes:
✅Previous Candle
✅ATR
✅Major Swing Level
✅Breakout Candle
✅Previous Candle + ATR Buffer
This gives flexibility for intraday traders, swing traders, and positional traders.
--------------------------------------------------
## Stop-Loss Modes Explained
📊 Previous Candle
For a buy breakout, stop loss is placed below the previous candle low.
For a sell breakdown, stop loss is placed above the previous candle high.
This is useful for traders who prefer tighter and structure-based stop losses.
--------------------------------------------------
📊 ATR
For a buy breakout, stop loss is calculated below entry using ATR.
For a sell breakdown, stop loss is calculated above entry using ATR.
This is useful for traders who want volatility-adjusted stop losses.
--------------------------------------------------
📊Major Swing Level
For a buy breakout, stop loss is placed near the last confirmed major swing low.
For a sell breakdown, stop loss is placed near the last confirmed major swing high.
This is useful for traders who prefer wider structure-based stops.
--------------------------------------------------
📊 Breakout Candle
For a buy breakout, stop loss is placed below the breakout candle low.
For a sell breakdown, stop loss is placed above the breakout candle high.
This is useful when traders want the breakout candle itself to define risk.
--------------------------------------------------
📊 Previous Candle + ATR Buffer
This mode uses the previous candle high or low with an added ATR cushion.
For a buy breakout, stop loss is placed below the previous candle low with ATR buffer.
For a sell breakdown, stop loss is placed above the previous candle high with ATR buffer.
This is a balanced stop-loss method because it gives slightly more breathing room than a pure previous candle stop.
--------------------------------------------------
##Separate Fibonacci Target Calculation
One important feature of this indicator is that Fibonacci targets are calculated separately from stop loss.
This means if stop loss becomes wider, targets do not automatically become wider.
Targets are based on a separate target range calculation, not on risk distance.
This avoids unrealistic target expansion when using wide stop-loss methods.
--------------------------------------------------
## Fibonacci Target Base Options
The indicator provides different target base modes:
✅Major Swing Range
✅Breakout Candle Range
✅ATR Range
📊Major Swing Range
Targets are calculated using the range between the latest major swing high and major swing low.
This is suitable for swing trading and higher timeframes.
📊Breakout Candle Range
Targets are calculated using the breakout candle range.
This is useful for intraday traders who want more practical and closer targets.
📊 ATR Range
Targets are calculated using ATR.
This gives volatility-adjusted target levels.
--------------------------------------------------
## Risk-Reward Boxes
Every confirmed signal plots a visual risk-reward structure on the chart.
✅The red box shows the risk zone.
✅The green box shows the reward zone.
✅Fibonacci target zones are displayed visually so traders can instantly understand where TP1, TP2, and TP3 are placed.
Historical boxes can remain on the chart, allowing traders to review past signal performance visually. Those who dont want any noise on the chart can opt out from historical boxes in the Settings menu.
This helps users observe:
✅Which signals reached target
✅Which signals hit stop loss
✅How price reacted after breakout
✅How often TP1, TP2, or TP3 was reached
✅Whether breakout continuation was strong or weak
--------------------------------------------------
## Visual Features
This indicator includes multiple visual enhancements:
✅Premium color themes
✅Risk-reward box styles
✅Layered Fibonacci target zones
✅Signal candle highlight
✅Breakout background flash
✅Signal glow effect
✅Custom line styles
✅Dashboard panel
✅Historical setup plotting
These features are designed to make the chart more readable, more professional, and easier to analyze.
--------------------------------------------------
## Best Default Settings
For a balanced setup:
Pivot Left Strength: 20
Pivot Right Strength: 20
ATR Breakout Buffer: ON
ATR Buffer Multiplier: 0.15
Volume Confluence: ON
Volume Multiplier: 1.3
Stop Loss Mode: Previous Candle + ATR Buffer
SL Buffer ATR Multiplier: 0.20
Fibonacci Target Base: Major Swing Range
Targets: 1.0 / 1.618 / 2.618
Keep Previous Target/SL Boxes: ON
--------------------------------------------------
## Suggested Intraday Settings
For 15-minute or lower timeframes:
Pivot Left Strength: 10
Pivot Right Strength: 10
ATR Breakout Buffer: 0.10
Volume Multiplier: 1.2
Stop Loss Mode: Previous Candle or Previous Candle + ATR Buffer
Fibonacci Target Base: Breakout Candle Range
Risk-Reward Box Extension: 20–25 bars
--------------------------------------------------
## Suggested Swing Trading Settings
For 1H, 4H, or daily charts:
Pivot Left Strength: 20–30
Pivot Right Strength: 20–30
ATR Breakout Buffer: 0.15–0.30
Volume Multiplier: 1.3–1.5
Stop Loss Mode: Previous Candle + ATR Buffer or Major Swing Level
Fibonacci Target Base: Major Swing Range
Risk-Reward Box Extension: 25–40 bars
--------------------------------------------------
## How To Use
1. Wait for a major swing high or swing low to form.
2. Let price break and close beyond the swing level.
3. Check whether the signal is volume confirmed.
4. Observe the plotted entry, stop loss, and Fibonacci targets.
5. Use the risk-reward box to understand the trade structure.
6. Avoid taking signals directly into strong nearby support or resistance.
7. Use higher timeframe trend direction for stronger confirmation.
--------------------------------------------------
## Bullish Signal
A bullish breakout signal appears when price closes above a confirmed major swing high with required confluence.
This suggests that buyers may be taking control above a previous liquidity zone.
--------------------------------------------------
## Bearish Signal
A bearish breakdown signal appears when price closes below a confirmed major swing low with required confluence.
This suggests that sellers may be taking control below a previous liquidity zone.
--------------------------------------------------
## Best Use Cases
📊Breakout trading
📊Liquidity breakout analysis
📊Market structure trading
📊Swing high and swing low breakout setups
📊Intraday breakout confirmation
📊Multi-timeframe analysis
📊Risk-reward planning
--------------------------------------------------
⚠️ Important Notes
⚠️ No indicator can predict the market with certainty.
⚠️ This tool is designed to help with structure, confirmation, and visual trade planning.
⚠️ Always combine signals with market context, higher timeframe direction, support and resistance, risk management, and your own trading plan.
⚠️ Avoid using any breakout signal blindly. This indicator itself suggests that using Stoploss is more important than Targets. Always use stoploss to protect the capital.
--------------------------------------------------
Trading Rules & Best Practices
✅ When to Use This Indicator
Trend-Following Setups: Use on trending charts where swing levels have clear structure
Breakout Trading: Ideal for breakout traders targeting support/resistance breaks
Range Identification: Works well when price oscillates between major highs/lows
Multi-Timeframe Analysis: Use higher timeframes (4H, 1D) to identify major swings for entry on lower timeframes
⚠️ When NOT to Use
Choppy/Ranging Markets: In sideways markets, many false breakouts may occur
Low Liquidity Assets: Volume filter may never trigger; consider disabling it
Highly Volatile Instruments: Increase ATR buffer multiplier to reduce noise
--------------------------------------------------
## Risk Disclaimer
This indicator is for educational and analytical purposes only. It does not provide financial advice, investment advice, or guaranteed trading signals.
Trading and investing involve risk. Always use proper risk management and do your own analysis before taking any trade.
--------------------------------------------------
Test it on different timeframes and comment which SL mode works best for your trading style.
Feedback and improvement suggestions are welcome. אינדיקטור
Macd and RSI % Change Signals MTF MACD & RSI % Change Signals + MTF Open Confirmation
Advanced momentum indicator combining Logarithmic RSI % Change, modified MACD, and Multi-Timeframe Open Price Confirmation.
This indicator detects high-probability entries by filtering custom MACD and RSI-based signals with strict multi-timeframe price action confirmation.
How It Works
1. Dual Signal Engine
Logarithmic RSI % Change System:
Uses RSI calculated on logarithmic scale (high, low, close) to generate more sensitive momentum signals.
Multiple bullish and bearish crossover levels (C20, C10, L20 for longs / L20, C20, C10 for shorts).
Modified MACD System:
Special MACD built with RSI applied to the oscillator for smoother and more responsive signals.
Multiple threshold levels (M2, M3, M4, M5) for both long and short entries.
2. MTF Open Price Confirmation (Core Filter)
Checks current price against the opening price of 4 customizable timeframes (default: 5m, 15m, 60m, 240m).
Long Signal is only valid if price is above the open on all selected timeframes.
Short Signal is only valid if price is below the open on all selected timeframes.
This powerful filter ensures you only trade in the direction of the current multi-timeframe bias.
3. Visual Elements
Clear triangle signals with labels (C20L, M5S, etc.) for easy identification.
Pullback Levels: Automatically plots the most recent confirmed signal’s high/low as dynamic support/resistance.
Live MTF Status Table: Shows current Open prices of all timeframes and overall market bias (LONG / SHORT / NEUTRAL).
Key Features
Log RSI % Change signals (highly responsive)
Modified MACD with multiple confirmation levels
Strict 4-Timeframe Open Price Confirmation Filter
Pullback level plotting for better risk management
Real-time MTF Open Status Panel
Fully customizable timeframes
Multiple alert conditions
Best Used For
Intraday & Scalping on lower timeframes (5m, 15m)
Swing Trading on 1H and 4H charts
Filtering false MACD/RSI signals in choppy markets
Trading with the dominant multi-timeframe momentum
This system significantly reduces whipsaws by combining powerful momentum oscillators with a strict higher-timeframe open price alignment filter. אינדיקטור

אינדיקטור

Scam or Slam - Day Trading Rauf Strategy**Scam or Slam - Day Trading Rauf Strategy**
This strategy is part of the Scam or Slam testing series, where publicly shared trading models are converted into mechanical TradingView strategies and stress-tested through backtesting.
This script is based on the Day Trading Rauf time-based range sweep model.
The core idea is simple:
1. Build the London time-based range from 01:12 to 02:12 New York time.
2. Build the New York time-based range from 08:12 to 09:12 New York time.
3. Wait for price to sweep one side of the range.
4. Look for a reversal confirmation.
5. Enter back toward the opposite side of the range.
Default entry confirmation uses the 3-candle reversal model:
* After a range low sweep, wait for 3 consecutive bearish candles.
* Enter long when price closes back above that 3-candle sequence.
* After a range high sweep, wait for 3 consecutive bullish candles.
* Enter short when price closes back below that 3-candle sequence.
The strategy includes:
* London and New York range toggles
* 3 Candle Reversal, CHoCH, IFVG, and Any Confirmation entry modes
* Sweep extreme stop loss logic
* Opposite side of range take profit logic
* Fixed R:R and fixed point target options
* Backtest synced entry markers
* Manual entry, stop loss, and take profit lines
* Forced close time
* One-trade-per-range logic
* Margin-call prevention for cleaner futures backtesting
This is designed for research and educational backtesting only. It is not financial advice and does not guarantee profitability. Always test the strategy across different market conditions, instruments, sessions, and data samples before using any trading model live.
אסטרטגייה

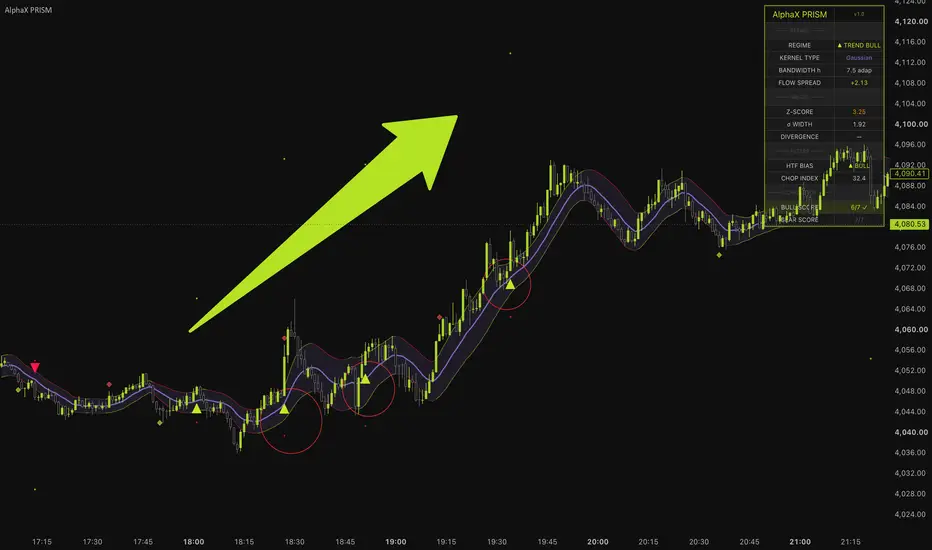
[ A L P H A X ] PRISM - Adaptive Dual-Kernel Flow EngineAlphaX PRISM — Adaptive Dual-Kernel Flow Engine: Nadaraya-Watson Kernel Regression, Residual Band System, Pivot Divergence Detection, Z-Score Fade & 4-Setup Regime-Gated Confluence Engine
AlphaX PRISM is a professional-grade adaptive trend and mean-reversion system built on a mathematically distinct foundation from every other indicator in the AlphaX suite. Where VECTOR uses an Efficiency Ratio and Choppiness Index to classify regimes and a KAMA line as the trend reference, PRISM applies non-parametric kernel regression — specifically a Nadaraya-Watson weighted estimate — to compute a statistically optimal smooth estimate of the price process itself. The result is not a moving average in the traditional sense. It is a regression estimate that weights each historical price observation by its distance from the present using a configurable kernel function, producing a slow kernel (primary trend estimate) and a fast kernel (momentum layer) whose spread creates a real-time directional bias measure fundamentally different from EMA crossover systems. Residual bands built from the standard deviation of price minus the kernel estimate — not from the kernel itself — provide statistically grounded dynamic envelopes that scale with actual price noise rather than arbitrary ATR multiples. Four regime-gated setup types — Trend Flow Break, Kernel Pullback, Z-Score Fade, and Pivot Divergence Reversal — fire through a 7-layer confluence engine that checks both kernel-specific signals and macro filter alignment simultaneously. Designed for traders who want institutional-grade statistical price modeling applied to practical signal generation across crypto, forex, gold, and indices on any timeframe.
━━━━━━━━━━━━━━━━━━━━━━━━━━━━━━━━━━━━━━━━
🔬 The Kernel Engine — Nadaraya-Watson Regression
The foundational difference between PRISM and every other AlphaX indicator is the core price estimate. All other systems use variants of exponential or adaptive moving averages — weighted sums of past prices with exponentially decaying weights. PRISM uses a Nadaraya-Watson kernel estimator — a non-parametric regression technique that estimates the true underlying price process at any point as a kernel-weighted average of all observations in the lookback window.
What kernel regression actually does:
Standard moving averages assign weights by time elapsed — more recent bars get more weight, older bars get less, following an exponential decay curve. The NW estimator assigns weights by position — how many bars ago a price occurred relative to the current bar — using a smooth, symmetric kernel function. This produces an estimate that minimizes the squared distance between the estimate and all observed prices, weighted by position.
Why this produces a superior trend estimate: A kernel regression estimate adapts its response to the local density of price observations rather than following a fixed mathematical formula. In fast-moving price environments with large bar movements, the kernel naturally places more emphasis on nearby bars. In slow, thin environments, older observations carry more proportional weight. The result is an estimate that is simultaneously smoother than an EMA of the same effective period and more structurally faithful to the underlying price movement.
Three kernel types available:
Gaussian (default):
Uses the normal distribution probability density function as the weight function. Weights decay as a bell curve — bars near the center of the lookback carry the most weight, tailing off smoothly toward zero at the edges. The Gaussian kernel produces the smoothest estimate and is optimal for normally distributed price noise. It never fully zeroes out any observation in the window.
Epanechnikov:
A parabolic weight function — (1 - (i/h)²) — that reaches exactly zero at the bandwidth boundary. More computationally efficient than Gaussian and optimal in a mean-squared-error sense under certain assumptions. Produces a slightly sharper response to local price movements than Gaussian.
Tricube:
The weight function used in LOESS regression — (1 - |i/h|³)³. A smooth, zero-bounded kernel that falls off more steeply than Gaussian near the boundary, producing an estimate that is highly responsive to recent prices while cleanly ignoring anything beyond the bandwidth boundary.
The kernel type is selectable from settings. For most instruments and timeframes, Gaussian is recommended for its smoothness. Epanechnikov or Tricube may be preferable when faster response to recent price action is desired.
━━━━━━━━━━━━━━━━━━━━━━━━━━━━━━━━━━━━━━━━
⚙ Adaptive Bandwidth — Scaling With Volatility
The bandwidth parameter h controls the effective "window width" of the kernel — how many observations contribute meaningfully to each estimate. Larger h = smoother, slower response. Smaller h = more reactive, noisier.
The fixed bandwidth problem: A bandwidth calibrated for a low-volatility environment is too reactive during high-volatility periods, producing noisy, whipsawing estimates. A bandwidth calibrated for high-volatility is too slow during quiet periods, lagging price movements significantly.
PRISM's adaptive bandwidth solution:
When Adaptive Bandwidth is enabled (default: on), the effective bandwidth is scaled by the current ATR's percentile rank relative to its own history over the configured lookback (default: 100 bars). The scaling formula produces:
Low ATR percentile (quiet market) — bandwidth scales down toward the Adaptive Min Scale (default: 0.80). The kernel becomes more responsive, tracking the slower price movement more closely
High ATR percentile (volatile market) — bandwidth scales up toward the Adaptive Max Scale (default: 1.25). The kernel becomes smoother, filtering out the larger noise inherent in high-volatility conditions
Bandwidth shift alert: When the effective bandwidth changes by 12% or more from the previous bar, a bandwidth shift event is detected and flagged on the dashboard. This indicates a significant volatility regime transition — the adaptive system is meaningfully adjusting its estimate parameters, which is itself information about the market's current character.
━━━━━━━━━━━━━━━━━━━━━━━━━━━━━━━━━━━━━━━━
⚡ Dual-Kernel Architecture — Slow and Fast Estimates
PRISM runs two kernel estimates simultaneously, each with a different effective bandwidth:
Slow Kernel (Primary Estimate):
The primary trend estimate computed at the full adaptive bandwidth. This is the principal signal line — the statistically optimal estimate of the underlying price trend. The residual bands are built relative to the slow kernel. The pullback setup watches price return to the slow kernel. The slow kernel is plotted as a purple line in Bands and Line visual modes.
Fast Kernel (Momentum Layer):
A second kernel estimate computed at a fraction of the slow kernel's bandwidth (default: 0.55× the slow bandwidth). This produces a more reactive estimate that leads the slow kernel during momentum shifts. The fast kernel's proximity to or divergence from the slow kernel creates the Kernel Spread — the primary directional bias indicator in PRISM.
Kernel Spread:
`Kernel Spread = Fast Kernel − Slow Kernel`
When positive and growing (spreadBull): the fast kernel is above the slow kernel and the gap is widening — upward momentum is accelerating.
When negative and falling (spreadBear): the fast kernel is below and the gap is widening downward — bearish momentum is accelerating.
When near zero: the two estimates have converged — no directional momentum bias is present.
The spread is displayed on the dashboard with a + or - sign and colored by its directional state. It is a prerequisite for Setups A and B — trend-following entries only fire when the spread confirms the signal direction.
━━━━━━━━━━━━━━━━━━━━━━━━━━━━━━━━━━━━━━━━
📊 Residual Bands — Statistically Grounded Envelopes
The residual bands in PRISM are fundamentally different from standard Bollinger Bands or ATR bands. They are built from the residuals — the differences between actual price and the slow kernel estimate — not from the price series itself.
Residual = Close − Slow Kernel
The standard deviation of these residuals over the band lookback period (default: 24 bars) gives sigma — the statistically appropriate measure of how much price typically deviates from the kernel estimate. The bands are then:
Upper Band = Slow Kernel + (Band Multiplier × σ)
Lower Band = Slow Kernel − (Band Multiplier × σ)
Why residual-based bands are superior: Bollinger Bands are built from the standard deviation of price itself — which includes both the trend component and the noise component. In a strongly trending market, most of the "deviation" in Bollinger Bands is actually trend — the bands widen dramatically and the upper/lower band crossings lose their mean-reversion significance. PRISM's residual bands remove the trend component first and only measure the standard deviation of the remaining noise. This means the bands genuinely represent deviation from the estimated price trend, not deviation from a lagging average.
Z-Score:
The current residual divided by sigma: `Z-Score = Residual / σ`. A Z-Score of +1.35 means price is currently 1.35 standard deviations above the kernel estimate — more than one standard deviation above expected. This is the metric that gates Setup C (Z-Score Fade) — a configurable minimum Z-Score is required before a mean-reversion fade signal can fire.
σ Width:
The current sigma value is displayed on the dashboard — a real-time measure of the current price noise level relative to the kernel estimate. Rising sigma indicates price is deviating increasingly from the kernel trend, falling sigma indicates price is tightening around the kernel.
━━━━━━━━━━━━━━━━━━━━━━━━━━━━━━━━━━━━━━━━
📈 Regime Classification — Two-Metric System
PRISM uses two independent measurements to determine the current regime, augmented by the kernel spread itself.
Efficiency Ratio (ER):
Identical to the VECTOR implementation — net directional price change divided by total path traveled over the lookback period. High ER = efficient directional movement = trending. Low ER = inefficient oscillation = choppy or ranging.
Choppiness Index (CI):
The logarithmic measure of how efficiently the period's ATR sum is packed into the high-low range. Above the configured threshold (default: 61.0) = stand aside (CHOP regime), blocking all signals.
Kernel Spread as regime filter:
For PRISM's Trend regime classification, the kernel spread must also exceed a minimum threshold (0.15× sigma) to distinguish genuine momentum bias from flat spread near zero. This prevents Trend regime classification when the two kernels have converged — a state that typically precedes a direction change rather than a trend continuation.
Four regimes:
CHOP (0) — CI above threshold. All signals blocked. Dashboard: ⛔ CHOP
TREND BULL (1) — not chop, ER above trend minimum, kernel spread positive and above minimum. Dashboard: ▲ TREND BULL
TREND BEAR (2) — not chop, ER above minimum, kernel spread negative and below minimum. Dashboard: ▼ TREND BEAR
BALANCE (3) — not chop, ER or spread conditions for trend not met. Dashboard: ◆ BALANCE
━━━━━━━━━━━━━━━━━━━━━━━━━━━━━━━━━━━━━━━━
🔀 Pivot Divergence Detection — Price vs Kernel
PRISM implements a pivot-based divergence system that is significantly more robust than the slope comparison divergence used in most oscillator-based indicators.
The pivot divergence method:
Standard divergence detection compares current price slope to current oscillator slope — a noisy, easily-fooled method that produces many false signals. PRISM instead identifies confirmed price pivots (using a configurable pivot length, default: 5 bars) and compares the price level at each new pivot to the slow kernel value at the same pivot bar.
Bullish pivot divergence:
Price forms a new pivot low lower than the previous pivot low — a genuine lower low in price
The slow kernel at the current pivot low bar is higher than it was at the previous pivot low — the kernel estimate is making a higher low while price makes a lower low
Price is currently near or below the lower residual band (within 1σ) — confirming the divergence is occurring at a structurally meaningful oversold level
Bearish pivot divergence:
Price forms a new pivot high higher than the previous pivot high — a genuine higher high in price
The slow kernel at the current pivot high bar is lower than at the previous pivot high — kernel making a lower high while price makes a higher high
Price is near or above the upper residual band
Why kernel-based divergence is more reliable than oscillator divergence: The slow kernel is a statistically optimal estimate of the price trend. When price makes a new extreme but the kernel's trend estimate does not confirm that extreme — actually reversing direction relative to the prior swing — it indicates that the underlying price process, stripped of noise, is already diverging from the price surface. This is a stronger divergence signal than any oscillator comparison because the kernel literally measures the same thing as price, just without noise.
Divergence cooldown: A minimum cooldown between consecutive divergence detections (default: 8 bars) prevents the same divergence condition from generating multiple signals during a prolonged extreme.
Divergence markers: Semi-transparent diamond shapes appear below (bull) or above (bear) bars where divergence is detected but a full entry signal has not fired. These allow you to track divergence conditions developing on the chart even before the complete signal conditions are met.
━━━━━━━━━━━━━━━━━━━━━━━━━━━━━━━━━━━━━━━━
🏷 Four Regime-Gated Setup Types
PRISM implements four distinct entry setups, each gated to the appropriate regime state and designed to exploit a different market condition detected by the kernel system.
━━━━━━━━━━━━━━━━━━━━━━━━━━━━━━━━━━━━━━━━
Setup A — Flow Break (Trend regime only)
A trend-following breakout entry that fires when price crosses through the residual band with kernel momentum confirmation.
Long conditions:
Regime is Trend Bull (regime == 1)
Price closes above the upper residual band — a statistically significant positive deviation from the kernel trend
Kernel spread is positive and accelerating (spreadBull) — fast kernel is above slow and the gap is widening, confirming the momentum behind the break
A qualifying bull rejection candle (close > open, lower wick above 52% of range) is present
The rationale: A close above the upper residual band in a Trend Bull regime means price has moved more than one standard deviation above the kernel trend estimate with directional kernel momentum behind it. This is not a mean-reversion setup — in a trending regime, upper band closes are continuation signals, not exhaustion signals. The kernel spread confirmation ensures the break has genuine momentum backing rather than being a noise spike into the band.
━━━━━━━━━━━━━━━━━━━━━━━━━━━━━━━━━━━━━━━━
Setup B — Kernel Pullback (Trend regime only)
The primary pullback entry — price retracing to the slow kernel with momentum still intact.
Long conditions:
Regime is Trend Bull
Price touches the slow kernel from above — the low of the bar reaches within 0.25× ATR of the kernel line
Price closes above the kernel — confirming the touch was a rejection, not a breakdown through the kernel
Kernel spread is still positive and accelerating — the underlying momentum has not reversed despite the pullback
A qualifying bull rejection candle confirms
The rationale: In a trend regime, the slow kernel is the trend's statistical backbone — the optimal estimate of where the underlying price process is. A pullback to the kernel during a trend is the equivalent of pulling back to the trend's center — the lowest-risk continuation entry with the widest statistical support. The spread confirmation ensures the trend's momentum is intact at the time of the touch.
━━━━━━━━━━━━━━━━━━━━━━━━━━━━━━━━━━━━━━━━
Setup C — Z-Score Fade (Balance regime only)
A statistically informed mean-reversion entry using the residual Z-Score to identify genuine band extremes.
Short fade conditions:
Regime is Balance (regime == 3)
Z-Score is above the configured minimum (default: 1.35) — price is more than 1.35 standard deviations above the kernel estimate, a statistically elevated extension
A qualifying bear rejection candle confirms the rejection at the extreme
Why the Z-Score threshold is the key gate: Any band touch could trigger a naive fade signal. The Z-Score requirement ensures only genuine statistical extremes are faded — points where price has deviated far enough from the kernel estimate that mean-reversion is statistically probable. The 1.35σ threshold balances frequency and quality — above this level, approximately 82% of normal distribution probability mass is below the current price, making continuation significantly less likely than reversion.
Balance-only gating: In a Trend regime, upper band touches in a bull trend are continuation signals, not exhaustion (as Setup A exploits). Setup C is therefore hard-gated to Balance regime only — mean-reversion entries are only valid when the market is genuinely ranging, not when a trend is carrying price to the band.
━━━━━━━━━━━━━━━━━━━━━━━━━━━━━━━━━━━━━━━━
Setup D — Divergence Reversal (Balance or opposing Trend regime)
The highest-conviction reversal entry, combining the pivot divergence signal with a band extreme and rejection candle.
Long conditions:
A qualifying bullish pivot divergence has been detected (price lower low, kernel higher low, near lower band)
A qualifying bull rejection candle confirms on the divergence bar
Regime is Balance OR Trend Bear (regime == 3 or regime == 2) — the setup is intended for counter-trend reversals, not trend continuation
Why divergence setups fire in opposing trend or balance regimes: A bullish divergence at the lower band during a Trend Bear regime is a potential trend exhaustion and reversal signal. In Balance, it is a standard oscillation reversal. Both contexts are appropriate for a divergence-based entry. A bullish divergence during Trend Bull would be anomalous — if the kernel is making higher lows while price makes lower lows in a bull trend, the trend is likely still intact and the divergence is noise rather than reversal signal.
━━━━━━━━━━━━━━━━━━━━━━━━━━━━━━━━━━━━━━━━
🧠 The 7-Layer Confluence Engine
Every signal across all four setup types is scored through the same 7-layer system. The default minimum is 5 of 7.
Layer 1 — Regime and Kernel Spread Direction (1 point):
Awards 1 point when either the regime confirms the signal direction (Trend Bull for longs, Trend Bear for shorts) or the kernel spread is directionally aligned. This layer is satisfied by either condition, making it achievable even in Balance regime when the spread is directional.
Layer 2 — Z-Score and Spread Positioning (1 point):
Awards 1 point when the residual Z-Score is positive (price above kernel) for longs, or negative for shorts; or when the kernel spread is directionally positive or negative respectively. Confirms the price is on the structurally correct side of the kernel estimate.
Layer 3 — HTF Bias (1 point):
Higher timeframe EMA alignment agrees with the signal direction. The macro institutional flow confirmation layer.
Layer 4 — Volume Expansion (1 point):
Current bar volume exceeds the volume moving average by the configured minimum multiplier (default: 1.05×). Confirms genuine participation on the signal bar.
Layer 5 — Rejection Candle (1 point):
A qualifying bull or bear rejection candle — bullish close with lower wick exceeding 52% of range, or bearish close with upper wick exceeding 52%. The candle quality confirmation that price genuinely rejected at the relevant level.
Layer 6 — Non-Chop Regime (1 point):
Market is not in Chop regime. Also enforced as a hard gate — no signal fires in Chop regardless of score.
Layer 7 — Setup Type Active (1 point):
Any of the four enabled setup types has fired on the current bar. Both a scoring layer and a hard prerequisite — at least one setup type must qualify for a signal to exist.
━━━━━━━━━━━━━━━━━━━━━━━━━━━━━━━━━━━━━━━━
📊 Live Dashboard
The 16-row real-time dashboard displays the complete internal state across four sections.
KERNEL
Regime — current regime: ⛔ CHOP, ▲ TREND BULL, ▼ TREND BEAR, or ◆ BALANCE
Kernel Type — the active kernel function: Gaussian, Epanechnikov, or Tricube
Bandwidth h — the current effective slow kernel bandwidth with "adap" suffix when adaptive scaling is active. Orange when a bandwidth shift event has been detected
Flow Spread — the current Fast Kernel minus Slow Kernel spread value with + or - sign. Yellow-green when spreadBull, red when spreadBear
BANDS
Z-Score — the current residual Z-Score. Orange when above the fade minimum threshold, indicating a statistically stretched condition
σ Width — the current sigma value in price terms — the standard deviation of residuals, displayed as a price distance
Divergence — ▲ BULL DIV or ▼ BEAR DIV when a pivot divergence is currently active, — otherwise
FILTERS
HTF Bias — ▲ BULL, ▼ BEAR, or — FLAT
Chop Index — live Choppiness Index value. Orange when in the stand-aside zone
CONFLUENCE
Bull Score — live 0–7 score. Background highlights yellow-green when threshold met and not in chop
Bear Score — live 0–7 score. Background highlights red when threshold met and not in chop
Live confluence label: During non-chop regimes, a small B x/7 · S x/7 label appears near the slow kernel line on the current bar, updating in real time.
━━━━━━━━━━━━━━━━━━━━━━━━━━━━━━━━━━━━━━━━
📈 Chart Visual System — Three Visual Modes
PRISM provides three visual modes selectable from settings, allowing you to optimize the chart display for your preferred analysis style.
Bands Mode (default):
Shows both the slow kernel line and the upper/lower residual bands as a channel around the kernel. The band fill creates a purple-tinted envelope. Setup A and C reference levels are immediately visible. Best for band-aware trading and Z-Score fade entries.
Line Mode:
Shows only the slow kernel line without bands. Clean, minimal display for traders who prefer to use the kernel line purely as a trend reference and support/resistance level for pullback entries.
Flow Mode:
Shows both the fast and slow kernel lines simultaneously without the residual bands. The spread between the two lines is directly visible on the chart — the gap between cyan (fast) and purple (slow) is the visual representation of the Flow Spread. Best for traders who want to monitor momentum through the kernel spread rather than band positioning.
Additional visuals:
Slow Kernel Line (purple) — the primary trend estimate, primary reference for Setup B pullbacks
Fast Kernel Line (cyan, Flow Mode only) — the momentum layer, its position relative to the slow kernel shows the current spread
Upper/Lower Residual Bands — statistically computed envelopes around the kernel. Setup A crossovers and Setup C fade levels
Band Fill (purple tint) — semi-transparent fill between bands when enabled
▲ Triangle (below bar) — long signal. All conditions confirmed
▼ Triangle (above bar) — short signal
◆ Diamond (semi-transparent, below/above) — divergence detected but full signal not yet confirmed. Pre-signal awareness
SL Guide (red dotted circles) — stop loss below the lower band or bar low minimum, plus ATR buffer
TP Guide (yellow-green dotted circles) — dynamic R-multiple target
Bar coloring (optional, off by default) — bars colored by kernel bias direction when enabled
Live confluence label — B x/7 · S x/7 near the slow kernel on the current bar
━━━━━━━━━━━━━━━━━━━━━━━━━━━━━━━━━━━━━━━━
🚀 How to Trade with AlphaX PRISM — Step by Step
Step 1 — Check Regime and Kernel State
Dashboard Regime row is the first check. ⛔ CHOP means no trades. ▲ TREND BULL or ▼ TREND BEAR means Setup A and B are available. ◆ BALANCE means Setup C and D are available
Check Flow Spread — is it confirming the regime direction? In Trend Bull, the spread should be positive and yellow-green. A Trend Bull regime with a flat or negative spread is a weakening trend that may be transitioning to Balance
Note the Z-Score — is it near or beyond the fade threshold? A Z-Score above +1.35 in Balance regime means Setup C short fade conditions are approaching. Below -1.35 means Setup C long fade is approaching
Check Divergence row — if it shows ▲ BULL DIV or ▼ BEAR DIV, a reversal setup is potentially developing. Watch for the rejection candle confirmation
Step 2 — Identify the Active Setup Type
Trend Bull: watch for price to reach the slow kernel line from above (Setup B) or close above the upper band with spread confirmation (Setup A)
Balance: watch Z-Score. When it reaches ±1.35 and the rejection candle fires, Setup C is the play
Any regime where divergence is active: Setup D — the rejection candle at the band extreme is the trigger
Step 3 — Enter on the PRISM Signal
A ▲ triangle confirms the full confluence stack is met. The SL guide is below the lower band and bar low minimum — the structural invalidation level
The TP guide is at the R-multiple target. For Setup A trend breaks, consider extending the target toward previous swing highs if the trend is strongly established
For Setup D divergence entries, the target is typically the kernel line itself (the mean) — the Z-Score fading back toward zero is the natural first target
Step 4 — Manage with Kernel State
During a Trend regime trade, watch the Flow Spread on the dashboard. When the spread begins narrowing (converging toward zero), trend momentum is fading — begin preparing to exit
A bandwidth shift (Bandwidth h shows orange) during a trade means volatility is changing significantly. Reassess the trade's context — the kernel is recalibrating
If regime transitions to Chop during an open trade, close immediately — the market character no longer supports the setup's thesis
━━━━━━━━━━━━━━━━━━━━━━━━━━━━━━━━━━━━━━━━
⚠ Identifying Low-Quality Conditions — When Not to Trade
Stand aside when:
Regime shows ⛔ CHOP — the Choppiness Index has crossed the stand-aside threshold. All signals are blocked. This is the most important dashboard reading in PRISM
Bandwidth h shows orange (bandwidth shift) — the adaptive bandwidth is shifting significantly, indicating a volatility regime transition. The kernel is recalibrating and its estimates may be temporarily less reliable
Flow Spread is near zero in either direction — when the fast and slow kernels have converged, there is no directional momentum bias. Setup A and B require a spreading kernel; a flat spread means the market has no directional commitment at the kernel level
Z-Score is between -1.0 and +1.0 in Balance regime — price is near the kernel estimate, well within one standard deviation. Setup C fade signals require statistical stretch beyond 1.35σ — entering fades too close to the kernel means the edge from Z-Score mean reversion is absent
Divergence markers appear but no rejection candle forms for multiple bars — a divergence without a confirming candle is a warning, not a signal. Do not enter on the divergence alone; wait for the full Setup D conditions including the rejection candle and minimum confluence score
Regime alternates rapidly between Trend Bull and Balance or Balance and Chop — unstable regime cycling indicates a transitional market where neither trending nor ranging playbooks have sustained applicability. Reduce size or wait for a clear, sustained regime
The ideal PRISM setup:
Trend regime sustained for 10+ bars with consistent spread direction
Flow Spread positive and growing (Trend Bull) — the momentum is actively building
HTF Bias aligned with regime direction
Price retracing cleanly to the slow kernel (Setup B) — touch within 0.25× ATR with a qualifying rejection pin bar
Volume above average, confirming institutional participation at the kernel level
Confluence score at 6/7 or 7/7
Z-Score near zero at the pullback bar — confirming the pullback reached the statistical center, not an overextended entry
━━━━━━━━━━━━━━━━━━━━━━━━━━━━━━━━━━━━━━━━
⚡ Key Features
🔬 Nadaraya-Watson kernel regression — non-parametric weighted estimate of the underlying price process using Gaussian, Epanechnikov, or Tricube kernel functions
⚙ Adaptive bandwidth scaling — effective bandwidth scales by ATR percentile rank, tightening in quiet markets and widening in volatile conditions
⚡ Dual-kernel architecture — slow kernel (primary trend estimate) and fast kernel (momentum layer) whose spread creates a real-time directional bias measure
📊 Residual-based bands — bands computed from the standard deviation of price-minus-kernel residuals, not from price itself. Statistically superior to ATR or price-deviation bands
📉 Z-Score display — live residual Z-Score showing how many standard deviations price has deviated from the kernel estimate, gating the mean-reversion fade setup
🔀 Pivot-based divergence detection — price pivot extremes compared to kernel estimate at same bar, more robust than oscillator slope divergence
◆ Divergence pre-signal markers — semi-transparent diamonds show developing divergence conditions before the full signal fires
🏷 Four regime-gated setup types — Setup A (Flow Break, trend only), Setup B (Kernel Pullback, trend only), Setup C (Z-Score Fade, balance only), Setup D (Divergence Reversal, balance or opposing trend)
📡 Bandwidth shift detection — alerts when adaptive bandwidth changes by 12%+ in a single bar, signaling a volatility regime transition
🎨 Three visual modes — Bands (channel display), Line (clean kernel only), Flow (dual-kernel spread visualization)
📊 Optional bar coloring — bars colored by kernel bias direction, off by default for chart cleanliness
🧠 7-layer confluence engine — Regime/Spread, Z-Score/Positioning, HTF Bias, Volume, Rejection Candle, Non-Chop, and Setup Type scored every bar
📊 16-row live dashboard — Regime, Kernel Type, Bandwidth h, Flow Spread, Z-Score, σ Width, Divergence, HTF Bias, Chop Index, and Confluence scores updated in real time
🔔 6 alert conditions — long/short entry, chop warning, bull/bear divergence, bandwidth shift
⚙ Fully configurable — kernel type, lookback window, base bandwidth, adaptive scaling range, output EMA smoothing, fast kernel bandwidth multiplier, residual band multiplier and lookback, Z-Score fade minimum, ER and CI regime thresholds, divergence pivot length and cooldown, all four setup enables, HTF timeframe and EMAs, volume filter, session, SL/TP parameters, visual mode, and all colors are independently adjustable
━━━━━━━━━━━━━━━━━━━━━━━━━━━━━━━━━━━━━━━━
⚙ Settings Reference
Kernel Engine
Kernel Type — Gaussian / Epanechnikov / Tricube. The weight function applied in the NW estimate
Lookback Window — the number of historical bars included in the kernel estimate (default: 40)
Base Bandwidth (h) — the base bandwidth parameter controlling effective kernel width (default: 6.0)
Adaptive Bandwidth (ATR percentile) — when on, scales h by ATR percentile rank (default: on)
ATR Length — lookback for the ATR calculation used in adaptive scaling (default: 14)
ATR Percentile Lookback — history window for ATR percentile rank (default: 100)
Adaptive Min Scale — minimum bandwidth multiplier in quiet markets (default: 0.80)
Adaptive Max Scale — maximum bandwidth multiplier in volatile markets (default: 1.25)
Output EMA Smooth — post-kernel EMA smoothing applied to both kernel outputs (default: 2)
Fast Kernel h Mult — bandwidth multiplier for the fast kernel relative to the slow (default: 0.55)
Residual Bands
Band Multiplier (σ) — number of residual standard deviations for the band boundaries (default: 1.0)
Residual σ Lookback — bars used to compute the residual standard deviation (default: 24)
Z-Score Min for Range Fade — minimum absolute Z-Score required for Setup C to fire (default: 1.35)
Regime & Divergence
Efficiency Ratio Length — ER lookback (default: 10)
ER Min (Trend) — minimum ER for trend classification (default: 0.32)
Choppiness Length — CI lookback (default: 14)
Chop — Stand Aside Above — CI threshold (default: 61.0)
Enable Pivot Divergence — toggle the divergence detection system
Divergence Pivot Length — bars on each side for pivot confirmation (default: 5)
Divergence Cooldown (bars) — minimum bars between divergence detections (default: 8)
Entries & Confluence
Setup A · Flow Break (trend) — toggle the trend band crossover setup
Setup B · Kernel Pullback — toggle the kernel touch pullback setup
Setup C · Z-Score Fade (balance) — toggle the balance mean-reversion setup
Setup D · Divergence Reversal — toggle the pivot divergence entry
Min Confluence Layers (of 7) — minimum score to fire a signal (default: 5)
Show Entry Signals — toggle signal triangles
Show Confluence Label — toggle the live B/S score label near the kernel line
Signal Cooldown (bars) — minimum bars between consecutive signals (default: 6)
Filters
HTF Trend Filter / HTF Timeframe / HTF Fast / HTF Slow EMA — higher timeframe bias parameters (defaults: on / 60-minute / 21 / 55)
Volume Confirm / Min Volume vs Avg / Volume Avg Length — volume expansion gate (defaults: on / 1.05 / 20)
Session Filter / Active Session — trading hours restriction (default: off)
Exit Guidance
Show SL / TP Guides — toggle stop and target circles
SL Distance (xATR) — ATR buffer beyond the lower band and bar low minimum (default: 1.0)
TP Reward (R) — take profit as risk × R multiple (default: 2.5)
Display
Visual Mode — Bands / Line / Flow. Selects which kernel components are rendered
Fill Residual Bands — toggle the purple band fill between upper and lower bands
Color Bars by Bias — toggle optional bar coloring by kernel spread direction (default: off)
Show Dashboard — toggle the full dashboard
Dashboard Position — Top Left / Top Right / Bottom Left / Bottom Right
Colors
Bull / Bull Bright — yellow-green family for bullish signals and indicators
Bear / Bear Bright — red family for bearish signals
Chop / Caution — orange for chop regime and bandwidth shift warnings
Kernel Line — purple for the slow kernel line and neutral band elements
Fast Kernel — cyan for the fast kernel line in Flow mode
SL Guide / TP Guide — stop and target circle colors
Dash Text / Dash BG / Dash Header / Dash Section / Dash Frame — full dashboard color control
━━━━━━━━━━━━━━━━━━━━━━━━━━━━━━━━━━━━━━━━
🔔 Alert Conditions (6 total)
Entry Alerts
PRISM Long — all conditions confirmed. Long signal fired across any of the four setup types
PRISM Short — all conditions confirmed. Short signal fired
State Alerts
PRISM Chop Warning — market has entered the Chop regime. All signals blocked — stand aside
PRISM Bull Divergence — bullish pivot divergence confirmed at the lower band. Setup D long conditions developing — watch for rejection candle
PRISM Bear Divergence — bearish pivot divergence confirmed at the upper band
PRISM Bandwidth Shift — adaptive bandwidth shifted 12%+ in one bar. Volatility regime transition in progress
All alert messages are formatted as const strings for clean webhook and notification platform integration.
━━━━━━━━━━━━━━━━━━━━━━━━━━━━━━━━━━━━━━━━
🎯 Recommended Settings by Instrument & Timeframe
The default configuration is optimized for XAUUSD, major forex pairs, and crypto on M5–H1 :
Gaussian kernel — smoothest estimate, optimal for the normally-distributed noise of gold and forex price action
Lookback at 40 — sufficient history for a meaningful kernel estimate on intraday timeframes without excessive lag
Base bandwidth at 6.0 with adaptive scaling — allows the kernel to breathe with gold's characteristic alternation between tight ranges and explosive moves
Band Multiplier at 1.0σ — one standard deviation bands are sensitive to genuine residual extremes without requiring extreme extension
Z-Score minimum at 1.35 — approximately 82nd percentile of normal distribution — a meaningful but not excessive statistical stretch requirement
For other instruments or timeframes, adjust:
M1–M3 scalping — reduce Lookback to 25–30, reduce Base Bandwidth to 4.0–5.0, reduce Output EMA Smooth to 1, reduce Cooldown to 3, reduce TP to 2.0R
H4–Daily swing trading — increase Lookback to 60–80, increase Base Bandwidth to 8.0–12.0, increase ATR Percentile Lookback to 200, increase TP to 3.5–5.0R
Crypto (BTC, ETH) — increase Adaptive Max Scale to 1.40–1.50 for the wider volatility swings, consider Epanechnikov kernel for faster response to crypto's sharper price movements
Indices (NAS100, US30) — increase Z-Score minimum to 1.5–1.8 (indices can sustain higher Z-scores in trends before reverting), use session filter for cash market hours
More signals — lower Min Confluence to 4, reduce Z-Score minimum to 1.1, increase Base Bandwidth to produce wider bands that are touched more frequently
Fewer, highest-quality signals — raise Min Confluence to 6–7, increase Z-Score minimum to 1.6, reduce Fast Kernel multiplier to 0.45 for a slower fast kernel that only diverges from slow in strong trends
━━━━━━━━━━━━━━━━━━━━━━━━━━━━━━━━━━━━━━━━
👥 Who This Is For
🔬 Mathematically sophisticated traders — PRISM exposes the full statistical machinery of non-parametric kernel regression to traders who want more than a moving average but something grounded in rigorous statistical theory
📊 Band-based traders who struggle with Bollinger Bands — residual-based bands solve the core Bollinger Band problem: bands that widen dramatically in trends due to trend variance rather than noise variance. PRISM's bands measure only the noise
🎯 Divergence traders — the pivot-based kernel divergence system is the most robust divergence implementation in the AlphaX suite, comparing structural price pivots to the kernel's trend estimate rather than oscillator slopes
🧭 Regime-aware traders — like VECTOR, PRISM classifies the current market regime and selects the appropriate playbook automatically. Four distinct setup types cover trending, balanced, and reversal conditions
📈 Adaptive system traders — the adaptive bandwidth scaling means PRISM truly adapts to the current volatility environment without manual recalibration
🥇 Gold and forex intraday traders — the Gaussian kernel with adaptive scaling is particularly well-suited to gold's volatility patterns, and the default settings are calibrated for XAUUSD intraday conditions
🔀 Traders who use mean-reversion and trend-following simultaneously — PRISM's four setups cover both directions: momentum breaks and pullbacks in trends, fades and divergence reversals in balance. One indicator, complete market coverage across regimes
━━━━━━━━━━━━━━━━━━━━━━━━━━━━━━━━━━━━━━━━
📝 Notes
All signals are confirmed on bar close — the indicator is non-repainting by design. Kernel estimates, regime classification, divergence detection, and confluence scoring all finalize on confirmed bars
The kernel regression calculation requires all bars within the lookback window to produce its estimate. On charts with fewer bars than the Lookback Window setting, the kernel estimate may be imprecise during the warm-up period. Allow the chart to accumulate at least the full lookback period (default: 40 bars) before treating signals as reliable
Adaptive bandwidth scaling uses ATR percentile rank, which itself requires the ATR Percentile Lookback period to calibrate. On fresh chart loads, the adaptive scale may not reflect the full historical context until sufficient bars have accumulated
The divergence system compares to the most recently confirmed pivot high or low. On timeframes where pivots form infrequently (H4+), the prior pivot reference may be many bars old and the divergence comparison less temporally relevant. Reduce the divergence pivot length on higher timeframes for more frequent reference points
The bandwidth shift alert fires when the bandwidth changes by 12%+ between consecutive bars. On very fast timeframes with high ATR volatility, this threshold may be crossed frequently — increase the threshold or disable the bandwidth shift alert if this becomes excessive noise
Maximum 500 labels and 500 lines are rendered. The divergence markers and confluence labels count toward these limits
The indicator does not track open positions or P&L and does not connect to any broker or account
━━━━━━━━━━━━━━━━━━━━━━━━━━━━━━━━━━━━━━━━
⚠ Disclaimer
This indicator is a technical analysis and visualization tool intended for educational and informational purposes only. It does not constitute financial advice or a recommendation to buy or sell any financial instrument. All signals are generated from historical and real-time price data using mathematical calculations — their accuracy or profitability is not guaranteed. Past performance of any signal type does not guarantee future results. Always conduct your own analysis, use proper risk management, and consult a licensed financial advisor before making any trading decisions. The author accepts no responsibility for any losses incurred from the use of this indicator.
━━━━━━━━━━━━━━━━━━━━━━━━━━━━━━━━━━━━━━━━
Built for traders who believe that the best price estimate is not an average of the past — it is a statistically optimal reconstruction of the price process itself. אינדיקטור
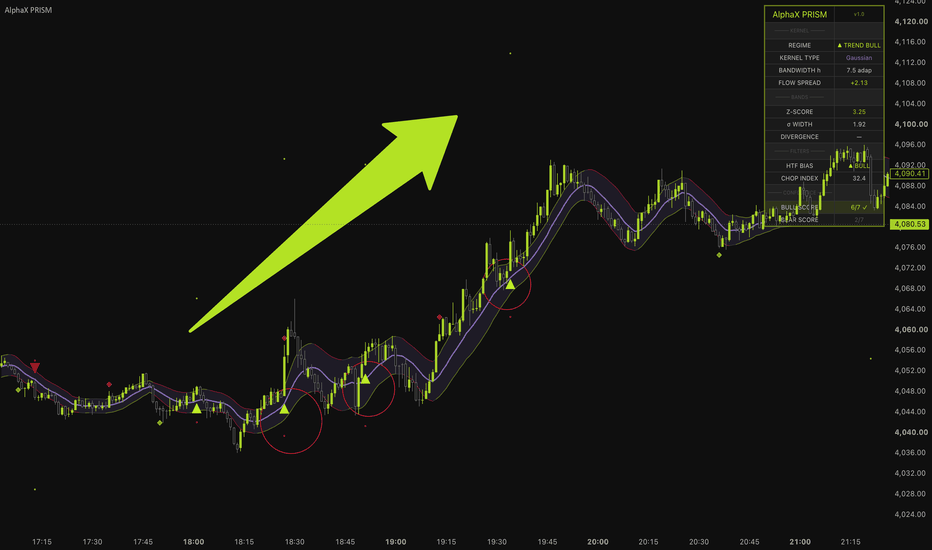
אינדיקטור

אינדיקטור
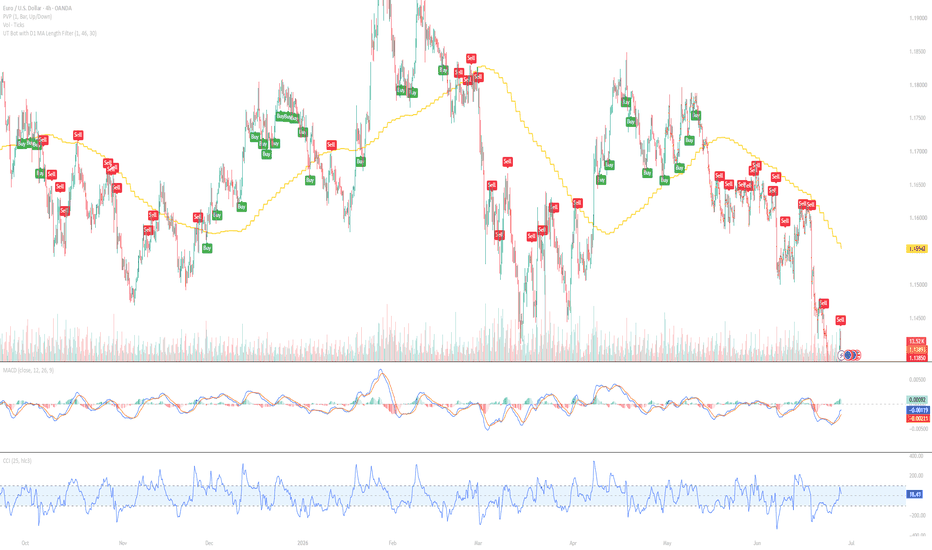
אינדיקטור

Kalman Quantum Drift [JOAT]KALMAN QUANTUM DRIFT
A trend-and-envelope engine built on the cleanest pair of state-space tools in quantitative finance: a Kalman filter for the centreline (Bayesian, adaptive, mathematically optimal under linear-Gaussian assumptions) and a GARCH(1,1) conditional-variance model for the envelope (the institutional standard for time-varying volatility). The script reads price as a noisy observation of an unobservable true state; the Kalman filter estimates that state recursively; GARCH estimates the noise's volatility; the envelope = mid ± k · σ_GARCH. A signal engine layered on top detects Collapse events (>3σ excursions) and Tunnel events (gap-throughs of the envelope) — the quantum analogues of state collapse and quantum tunnelling.
The Kalman filter, properly
A single-state recursive Bayesian filter. At each bar:
Predict : prior estimate = previous estimate. Prior variance = previous variance + Q.
Update : Kalman gain = prior variance / (prior variance + R). New estimate = prior + gain × (observation − prior). New variance = (1 − gain) × prior variance.
The two tuning knobs are:
Q (process noise) — how much the script trusts new observations. Higher Q = faster, noisier mid-line.
R (measurement noise) — how much the script trusts the model. Higher R = slower, smoother mid-line.
This is the Bayesian-optimal smoother for linear-Gaussian state-space data. Real markets are not perfectly linear-Gaussian, but the Kalman estimate is robust enough to be the cleanest mid-line you can build without going into heavy non-linear filtering.
GARCH(1,1) envelope
The envelope around the Kalman mid is not ATR or stdev — it is GARCH(1,1) :
σ²_t = ω + α · ε²_{t−1} + β · σ²_{t−1}
ω is the long-run variance baseline, α is the reaction to last shock squared (ARCH term), β is the persistence of past variance (GARCH term). For stationarity, α + β < 1 (the script's α/β defaults respect that). Optional log returns (default ON) and a warm-up window seed the variance from realised returns.
The envelope is mid ± k · σ_GARCH , rendered as a gradient (configurable number of nested fills, each at progressive transparency from edge to core).
Three-signal engine
Collapse — fires when price travels more than collapse threshold (default 3.0) σ-units from the Kalman mid. The "state collapse" event — price has decisively departed the filter's expected band. Bull or bear depending on direction.
Tunnel — fires when a bar gaps through the entire envelope from one side to the other. The "quantum tunnel" event — a discontinuous jump that bypasses the band gradient.
Buy / Sell crosses — fire when price crosses the Kalman mid from one side. Optional Collapse confirmation gate (default ON) — Buy / Sell only fires when a Collapse occurred within the configurable lookback window. This dramatically improves signal quality.
A configurable signal cooldown (default 5 bars) prevents stacking.
Visual system
Kalman mid-line — coloured by its own slope (bull / bear), configurable width.
Gradient envelope — nested fills (configurable steps, default 6) using the same base hue with progressive transparency from edge to core. Strict two-hue discipline (bull cyan / bear pink only).
Price bar colouring by mid slope (toggleable).
Background tint on extremes — subtle bgcolor when price is at envelope edge (toggleable, default 92 transparency).
Event glyphs — C (Collapse) and T (Tunnel) markers at the event bar. Configurable size.
A locked Quantum palette (cyan bull / pink bear / muted cyan mid on a deep violet-black) gives the chart a distinctive quant-physics identity.
Dashboard
Monospaced table positionable to any of nine corners. Surfaces:
Current Kalman mid value with slope direction.
σ_GARCH value and the envelope half-width.
Distance of price from mid in σ-units.
Last Collapse / Tunnel / Buy / Sell event with bar age.
Q / R settings in use.
GARCH ω / α / β confirmation.
Alerts
Six alert conditions, each independently controllable:
Collapse Up / Down (>kσ excursion)
Tunnel Up / Down (envelope gap-through)
Slope Flip (Kalman mid changes direction)
Sigma Spike (σ_GARCH exceeds its own recent baseline)
How to read it
Three reads, in order of conviction:
Buy/Sell after a Collapse (the script's intended signal) — the cleanest trend-entry the engine produces. A Collapse means price decisively departed expected range; the subsequent mid-line cross confirms the new direction with the strongest possible context. This is the highest-conviction read.
Tunnel — an exceptional, rare event. When a single bar jumps the entire envelope, the market has experienced a discontinuity (news, large block, exchange dislocation). Often produces the day's largest moves; almost always followed by elevated volatility.
σ Spike alert without a directional event — a regime warning. Volatility just expanded without a directional commitment yet. The next signal that fires is statistically more likely to be meaningful than the one before the spike.
Suggested settings
Defaults (Q = 0.02, R = 1.5, GARCH ω=2e-6 / α=0.10 / β=0.85, k = 2.5, gradient steps 6) are tuned for 15m–1H on liquid markets. For lower timeframes drop k to 2.0. For HTF raise R to 3.0 (more model trust on smoother data). The GARCH α/β defaults are the institutional standard; α + β remains under 1 for stationarity.
Originality
Kalman filtering and GARCH(1,1) are textbook quantitative-finance methods — both decades-old, both well-documented. The implementation here — the single-state recursive Kalman with exposed Q/R, the GARCH(1,1) variance recursion with warm-up window, the gradient-envelope render using strict two-hue alpha-only variation, the three-signal engine (Collapse / Tunnel / Cross), the optional Collapse-confirmed Buy/Sell gating, the event glyph markers, and the background tint on extremes — is JOAT-original. No third-party code reused. The pairing of Kalman + GARCH + quantum-inspired signal naming is the original presentation.
Limitations
The Kalman filter assumes linear-Gaussian state dynamics — real markets violate this, especially around news and gaps. The Q / R tuning is exposed precisely because no single setting is universally correct; tune to your instrument's noise profile. GARCH's α/β must sum to less than 1 for stationarity — the defaults respect this; if you push them too aggressively the variance can explode. Collapse and Tunnel events are confirmed on bar close (non-repainting).
—
-made with passion by jackofalltrades
אינדיקטור