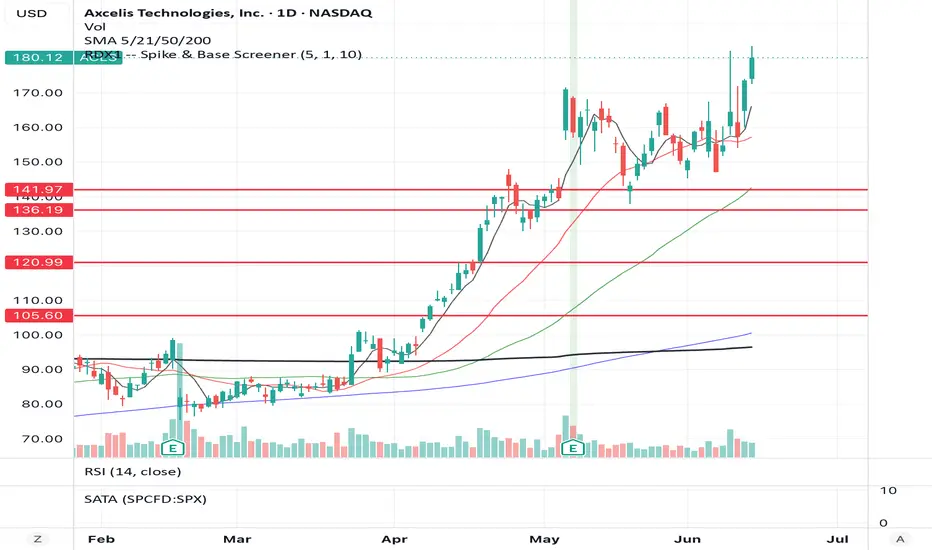
Camarilla Pivot Plays - MaazCamarilla Pivot Plays - Maaz is a institutional-grade quantitative workspace engine engineered for active intraday equity and futures traders. Designed to strip out raw market noise and address the flaws of standard layout pivot scripts, this system delivers an institutional-level view of daily support, resistance, and breakout structures based on Thor Young's classic trading playbook.
The indicator is split into two major algorithmic engines:
1. The Multi-Session Historical Alignment Engine
Unlike generic pivot indicators that pull simple daily data bars (often mixing regular and extended hours incorrectly), this script utilizes a complex multi-session memory snapshot pipeline. By calculating historical session boundaries and tracking extended-hours shifts (useEthForCams), the plots shift step-heights at the exact structural bars required to match professional configurations. It provides clean, un-cluttered stepline plots for:
CP (Central Pivot): The ultimate directional anchor boundary for the session.
R3 / S3: The dynamic range boundaries defining institutional value and traversal reversion loops.
R4 / S4: The critical breakout launchpads where institutional short squeezes or liquidations occur.
R6 / S6: Ultimate daily mathematical expansion targets.
2. The Integrated Precision HUD Panel
The system bypasses standard chart-clipping errors by embedding a stacked, comprehensive workspace dashboard in the top-right corner of your screen. This HUD continuously reads live price metadata to evaluate and display:
Trend Range Bias: Classifies the session macro structure as Higher Range, Lower Range, or Neutral.
Volatility Coiling Status: Classifies the pivot width as Wide or Narrow to instantly tell you whether you are in a range-fading or trend-breakout environment.
Suggested Play Actions: Tells you exactly what setup to watch for (e.g., Watch R4 for Outright Breakout Long) or shifts to bright yellow execution flags (TRIGGER ACTIVE) when levels break.
Pre-Calculated Target Prices: Explicitly states your Planned Entry Pivot Level and Planned Target Exit Level directly inside the table before the trade even triggers.
Institutional Filters: Provides live readouts of Daily Average True Range (ATR), Relative Volume (RVOL) to confirm big block-order breakouts, and an Institutional Net Flow Index tracking raw buy/sell delta pressure. אינדיקטור

אינדיקטור

1 Trendline Strategy🌟 1 Trendline Strategy: Liquidity Pool Breakout + HTF Trend Filter (Neon Edition)
Description:
This strategy is based on "Smart Money" concepts and trendline technical analysis. The core logic relies on identifying dynamic liquidity pools and trading their breakouts (liquidity sweeps), but strictly in the direction of the global trend.
The script is fully automated, features built-in ATR-based risk management, and includes custom neon visualization designed for maximum chart readability.
⚙️ How it Works?
1. Dynamic Liquidity Pools (Liquidity Zones)
The algorithm calculates significant highs and lows (Pivot High / Pivot Low) and projects dynamic channel zones forward in time.
When the price breaks the upper pool boundary (resistance), the strategy looks for a Short entry (bounce/liquidity sweep).
When the price breaks the lower pool boundary (support), a Long signal is generated.
2. HTF Trend Filter (Higher Timeframe Filter)
To avoid false entries against strong momentum, the strategy incorporates an advanced Higher Timeframe (HTF) filter. By default, it uses a 250 EMA on the 4-hour chart. Trades are opened only when two factors align:
For Long: Price is above the HTF EMA, and the moving average slope is pointing upwards.
For Short: Price is below the HTF EMA, and the moving average slope is pointing downwards.
(The trend filter can be easily disabled in the settings if you prefer to trade all pool breakouts).
3. Risk Management (ATR Stops & Targets)
Stop Loss and Take Profit levels are not arbitrary—they are dynamically calculated based on asset volatility (ATR indicator) at the exact moment a signal occurs. These fixed levels are held on the chart until the position is fully closed.
🎨 Visuals (Neon Colors)
The script's UI has been redesigned for a comfortable trading experience on a dark theme:
Lower Pools (Long zones): Highlighted in neon cyan (#00bcd4).
Upper Pools (Short zones): Highlighted in neon orange-yellow (#ff9800).
HTF Trend Indicator: The global trend line turns blue during an uptrend and white during a downtrend.
Position Levels: During an active trade, clean lines are drawn on the chart: Blue — Entry Price, Red — Stop Loss (SL), Green — Take Profit (TP). The lines break when the trade is closed, keeping your chart clean.
🎛 Main Settings (Inputs)
Period (Core Settings): Lookback period for finding Pivot points (default is 6).
Padding (Core Settings): The width of the liquidity pool channel.
Use Trend Filter: Toggle the higher timeframe filter on or off.
Trend Higher Timeframe & EMA Length: Set the timeframe and length of the trend-defining EMA (default is 240 min / 250 EMA).
ATR Length / SL Mult / TP Mult: Risk management settings (ATR multipliers for SL and TP calculations).
Disclaimer: This strategy is provided "as is" for educational purposes. It is highly recommended to backtest it on your preferred trading pairs and timeframes to find the optimal ATR multipliers and Pivot periods before risking real capital.
#SmartMoneyConcepts #SMC #Liquidity #LiquidityPools #BreakoutStrategy #TrendFilter #TradingStrategy #PineScript #ATR #RiskManagement #CryptoTrading #Forex אסטרטגייה

אינדיקטור

HTF Session Sweep ModelHTF Session Sweep Model
The HTF Session Sweep Model is a session-based market structure tool designed to help traders observe how price interacts with the previous confirmed higher-timeframe candle during active trading sessions.
This script was created because session trading can become messy when traders manually mark multiple highs, lows, opens, boxes, sweeps, breakouts, and traps across different timeframes. Instead of adding unrelated indicators together, this model uses one central reference point: the previous confirmed HTF candle. Once an enabled session begins, the script maps that HTF candle’s high, low, midpoint, and optional session open level onto the chart. Price action during that session is then classified around that reference range.
The purpose of the script is not to predict price. The purpose is to provide a clean framework for reading session behaviour around a higher-timeframe range.
Core Concept
The script is built around the idea that the previous higher-timeframe candle can provide useful reference levels for intraday price behaviour. Its high and low can act as areas where liquidity may be taken, where breakouts may develop, or where failed breakouts may occur.
The model does not project the HTF candle before the session opens. It activates when an enabled session opens. At that point, it takes the most recent fully confirmed HTF candle and uses it as the active session reference.
This creates a consistent question for the trader:
How is price reacting around the previous confirmed HTF candle during the current session?
What Makes This Script Original
This script is not designed as a simple combination of unrelated indicators. The components are connected through one session-based model:
1. Session engine
The script allows users to enable Asia, London, and New York sessions. Each session can use its own time window and timezone setting.
2. HTF reference map
At the start of an enabled session, the script maps the previous confirmed HTF candle. This includes the HTF high, low, midpoint, optional candle body, and optional session open level.
3. Sweep model
The script checks whether price sweeps above the HTF high or below the HTF low. Users can choose between a basic wick sweep or a stricter sweep that requires price to close back inside the HTF range.
4. Delivery shift confirmation
After a sweep occurs, the script can wait for a delivery shift confirmation before marking a sweep entry. A bearish confirmation requires price to break below a recent low range after a high sweep. A bullish confirmation requires price to break above a recent high range after a low sweep.
5. Breakout model
If price closes and holds outside the HTF range, the script can classify the move as a breakout. Users can set how many bars price must hold beyond the range.
6. Displacement filter
The breakout model can optionally require stronger candle movement by comparing the candle body against ATR. This helps filter weaker breaks that do not show meaningful displacement.
7. Failed breakout trap model
If price breaks beyond the HTF high or low and then returns back inside the range, the script can classify that move as a failed breakout trap. A Bull Trap means price broke above the HTF high and failed back inside. A Bear Trap means price broke below the HTF low and failed back inside.
These parts work together because they all answer the same question: did price sweep the HTF range, accept beyond it, or fail after breaking it?
How The Script Calculates The Model
When a new enabled session begins, the script requests the previous confirmed candle from the selected higher timeframe. The selected HTF may be adjusted by the user, such as 1H, 2H, 4H, Daily, or Weekly.
The script then stores the following values:
* Previous HTF open
* Previous HTF high
* Previous HTF low
* Previous HTF close
* Previous HTF midpoint
* Current session open
These values become the session reference map.
During the active session, the script checks price against the HTF high and low.
High Sweep:
A high sweep is detected when price trades above the previous HTF high.
Low Sweep:
A low sweep is detected when price trades below the previous HTF low.
Close Back Inside Sweep Mode:
When this stricter mode is selected, a high sweep requires price to close back below the HTF high. A low sweep requires price to close back above the HTF low.
Sweep Entry:
A sweep entry is not triggered by the sweep alone. After a sweep, the script waits for a delivery shift confirmation using the selected lookback length.
Breakout Long:
A breakout long is detected when price closes above the HTF high and holds above it for the selected number of bars.
Breakout Short:
A breakout short is detected when price closes below the HTF low and holds below it for the selected number of bars.
Bull Trap:
A bull trap is detected when price breaks above the HTF high but later closes back below the HTF high.
Bear Trap:
A bear trap is detected when price breaks below the HTF low but later closes back above the HTF low.
Volume Filter:
The optional volume filter compares current volume against a moving average of volume multiplied by the selected volume multiplier. When enabled, sweep and breakout conditions must also pass the volume filter.
Bar Close Confirmation:
The script includes an option to confirm signals only after the bar closes. This is enabled by default to make signals more stable for alerts and historical review.
How To Use This Script
1. Choose the reference timeframe
Select the HTF candle you want to use as the session reference. Intraday traders may use 1H, 2H, or 4H. Higher-timeframe traders may prefer Daily or Weekly.
2. Enable the sessions you trade
The script supports Asia, London, and New York sessions. Users can enable or disable each session and adjust the session window and timezone.
3. Watch the HTF range during the session
Once the session opens, the script draws the previous confirmed HTF candle range. The high and low are the main reaction levels.
4. Read price behaviour around the range
If price sweeps a level and returns inside, it may indicate a liquidity sweep.
If price closes and holds outside the range, it may indicate breakout continuation.
If price breaks outside and then returns inside, it may indicate a failed breakout trap.
5. Use the labels as classifications, not automatic trade commands
The labels are designed to classify price behaviour. They are not guaranteed buy or sell signals.
6. Combine with your own confirmation
Users should combine this model with their own market context, risk management, higher-timeframe bias, and execution plan.
Main Visual Elements
HTF Range Box:
Shows the previous confirmed HTF candle range during the active session.
HTF Candle Display:
Optionally displays the previous HTF candle body and wick on the chart.
High and Low Lines:
Marks the previous HTF high and low.
Midpoint Line:
Marks the midpoint of the HTF range.
Session Open Line:
Marks the price at the open of the active session.
Sweep Marks:
Marks when price sweeps above or below the HTF range.
Sweep Entry Marks:
Marks when a sweep is followed by delivery shift confirmation.
Breakout Marks:
Marks when price closes and holds outside the HTF range.
Trap Marks:
Marks failed breakout conditions as Bull Trap or Bear Trap.
Dashboard:
Optional compact dashboard showing the current session, HTF reference, confirmation mode, state, high, low, and midpoint.
Important Settings
Reference HTF Candle:
Controls which higher timeframe is used for the previous confirmed candle reference.
Sweep Mode:
Choose between Wick Sweep or Wick Sweep + Close Back Inside.
Confirm Signals On Bar Close:
When enabled, signals confirm after candle close. This is recommended for cleaner historical review and alerts.
Delivery Shift Lookback:
Controls how many bars are used to confirm a shift after a sweep.
Breakout Hold Bars:
Controls how many bars price must remain outside the HTF range before a breakout is confirmed.
Displacement Filter:
Requires the candle body to be large enough compared with ATR before confirming a breakout.
Volume Filter:
Optional filter requiring current volume to exceed average volume by the selected multiplier.
Keep Historical Sessions:
When disabled, the chart stays cleaner by only showing the current/latest session map. When enabled, historical session maps can remain visible, with a limit to reduce chart clutter.
Visual Modes:
Clean mode is designed for normal use.
Stealth mode reduces visual intensity.
Debug mode makes internal reference levels easier to inspect.
Alerts
The script includes alert conditions for:
* HTF high swept
* HTF low swept
* Sweep short
* Sweep long
* Breakout long
* Breakout short
* Bull trap
* Bear trap
* Master alert for any model event
The master alert is included so users can create one alert condition instead of setting up many separate alerts.
Recommended Use
This script is best suited for traders who use session timing, higher-timeframe ranges, liquidity sweeps, breakout continuation, and failed breakout concepts.
It may be useful on intraday charts where Asia, London, and New York session behaviour matters. It can also be adjusted for different markets and timeframes by changing the reference HTF and session settings.
Limitations
This script does not predict future price movement. It classifies how price behaves around the previous confirmed HTF candle during active sessions.
A sweep does not guarantee a reversal.
A breakout does not guarantee continuation.
A trap does not guarantee a full trend change.
Volume data may behave differently depending on the market and symbol.
Session behaviour can vary across forex, crypto, futures, indices, and stocks.
This tool should be used as a market structure framework, not as a standalone trading system.
Originality And Usefulness Statement
The originality of this script is in how it combines session timing, previous confirmed HTF candle mapping, sweep classification, breakout confirmation, and failed breakout detection into one connected workflow.
The script is useful because it gives traders a structured way to observe whether price is taking liquidity, accepting outside a higher-timeframe range, or failing after a breakout attempt. Each component supports the same central model rather than acting as an unrelated indicator mashup.
Disclaimer
This indicator is for educational and analytical use only. It is not financial advice and does not guarantee trading results. Users are responsible for their own trading decisions, testing, and risk management.
אינדיקטור

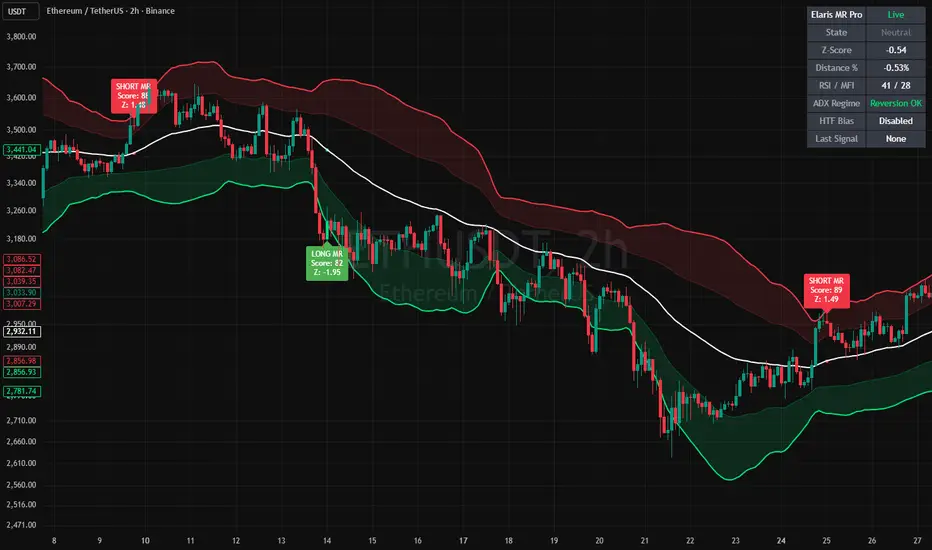
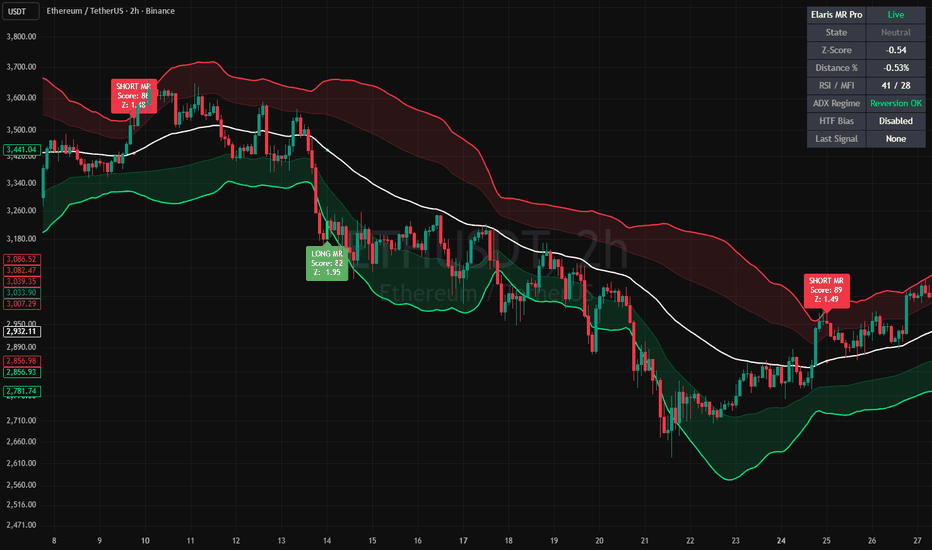
Elaris Mean Reversion ProElaris Mean Reversion Pro
Elaris Mean Reversion Pro is a multi-factor mean reversion indicator designed to help traders identify situations where price has moved significantly away from its statistical mean and may be entering a potential reversion phase.
The indicator combines adaptive deviation bands, volatility measurements, momentum filters, market regime analysis, and optional higher-timeframe confirmation to provide a structured framework for analyzing stretched market conditions.
Unlike simple overbought and oversold tools, Elaris Mean Reversion Pro allows users to customize how extremes are measured through Z-Score, ATR-based, or hybrid deviation models while incorporating optional confirmation layers such as RSI, MFI, volume, ADX, and higher-timeframe trend filters.
Key Features
• Multiple mean calculation methods including EMA, SMA, RMA, WMA, VWMA, and HMA.
• Three deviation models:
* Z-Score Bands
* ATR Bands
* Hybrid Bands
• Mean reversion signal engine with multiple confirmation styles:
* Extreme Touch
* Mean Reclaim
* Candle Rejection
• Optional RSI and MFI extreme-condition filters.
• ADX-based market regime filter to help identify environments where mean reversion conditions may be more relevant.
• Optional volume and volatility filters.
• Higher-timeframe confirmation framework.
• Signal quality scoring system.
• Dynamic mean, deviation bands, and reversion zones.
• Built-in dashboard displaying:
* Market state
* Z-Score
* Distance from mean
* Momentum readings
* Regime status
* Higher-timeframe bias
• Alert conditions for:
* Long mean reversion signals
* Short mean reversion signals
* Upper extreme zones
* Lower extreme zones
How It Works
The indicator calculates a central mean and measures how far price has deviated from that mean using statistical or volatility-based methods.
When price reaches an extreme deviation zone, the indicator evaluates additional confirmation factors such as candle behavior, momentum conditions, volatility, volume, and trend regime before generating a signal.
Signals are intended to highlight potential mean reversion conditions and should be evaluated alongside the trader's own market analysis and risk management process.
Non-Repainting
This indicator uses confirmed bar logic and higher-timeframe requests with lookahead disabled. Signals are generated using closed-bar information and do not intentionally repaint historical signals.
Notes
Mean reversion techniques may behave differently across various market conditions. Strong directional trends, high-impact news events, and volatility expansions can influence market behavior and should always be considered when interpreting indicator outputs.
This tool is designed for market analysis and educational purposes only and does not constitute financial advice.
אינדיקטור
VWAP TrendVWAP Trend & Daily Map Execution by erdensedat
Description:
VWAP Trend is an advanced day-trading engine and market mapping tool designed for intra-day execution using purely objective price action metrics. Instead of relying on lagging oscillators, this indicator fuses VWAP (Volume Weighted Average Price) deviations, Daily Open levels, and an automated Previous Day High/Low (PDH/PDL) targeting system.
Key Features:
Dynamic Bias Engine: The indicator measures real-time alignment between the Daily VWAP and the Daily Open price. A "BULLISH PRESSURE" signal fires when price reclaims both key metrics, while a "BEARISH PRESSURE" signal fires when price breaks below them.
Smart Time Filter: Automatically ignores high-volatility chop during the initial hours of a session (default is set to hide major text signals before 07:00 exchange time).
Automated PDH/PDL Liquidity Targets: Previous Day Highs and Lows are tracked with a "Cut-on-Touch" system. When a signal is active, these levels act as objective take-profit zones. Once touched, the level is cut, and a "TARGET REACHED" label is placed automatically.
Multi-Timeframe Macro Dashboard: An unobtrusive, dark-mode compatible panel displays the macro environment (EMA 200 Main Trend, Weekly Bias, Weekly VWAP, Daily Bias) alongside live target levels.
Clean UI & 'Only Today' Mode: Avoid chart clutter. The indicator features an "Only Today" toggle that completely erases previous days' lines, bands, and signals every day at midnight, leaving you with a perfectly clean chart for the current session.
How to Use:
Observe the Main Dashboard for Macro Alignment (Weekly Bias & EMA 200).
Wait for the designated trading hour to begin (e.g., 07:00).
Look for a Bullish / Bearish Pressure alert (indicated by clean, background-free text and arrow markers).
Target the active PDH or PDL lines shown on the chart.
Alerts:
Includes a single, unified alert condition ("VWAP Trend Signal") that dynamically pushes "Bullish Pressure" or "Bearish Pressure" notification text upon bar close.
Disclaimer:
Disclaimer: The "VWAP Trend" indicator by erdensedat is provided for educational and informational purposes only. It is not financial advice, and you should not construct it as such. Trading in financial markets (including cryptocurrencies, forex, and equities) involves a significant risk of loss and is not suitable for all investors. Past performance of any trading system or methodology is not necessarily indicative of future results. Always conduct your own research and manage your risk. אינדיקטור

Candle Displacement [D4A]Quantifying Market Momentum
Spotting sudden, aggressive price action often called displacement doesn't have to be a guessing game. Finding who is in control - buyers or sellers - can be as easy as looking for candles with specific colors. The script objectively track these explosive price moves by comparing candle's range against multiple of ATR over a specific lookback period (ATR Length).
True displacement should create a gap or FVG (Fair Value Gap) which indicates strong price move in one direction and this script provides the logic to catch this specific scenario while filtering out noise. Additionally, the cript marks break-of-structure displacement candles to highlight the beginning of strong directional move or a reversal. There is also filter provided to find only candles with significant gap created (FVG threshold). This script works best on smaller timeframes, eg. 1m or 5m.
SETTINGS
- Displacement - show displacement candles
- Min Body % - displacement candle should have at least this body size compared to whole candle range
- Require FVG - filters out the candles which don't create a gap. True displacement should create FVG
- Threshold - a valid FVG should be larger than this ATR multiplier
- Highlight candles which broke structure - color-codes the candles that broke recent market structure (high or low)
- Bars to define recent high/low (structure) - how many bars back should the script look to find recent high or low
- ATR length - ATR value over period of time to calculate average candle range
- Multiplier - used to find candles which are this times bigger than average ATR
-----------------
Disclaimer
The content provided in this script is for educational and informational purposes only. It does not constitute financial advice, investment recommendations, or a solicitation to buy or sell any financial instruments. I will not accept liability for any loss or damage, including without limitation any loss of profit, which may arise directly or indirectly from the use of or reliance on such information.
All investments involve risk, and the past performance of a security, industry, sector, market, financial product, trading strategy, backtest, or individual's trading does not guarantee future results or returns. Investors are fully responsible for any investment decisions they make. Such decisions should be based solely on an evaluation of their financial circumstances, investment objectives, risk tolerance, and liquidity needs. אינדיקטור

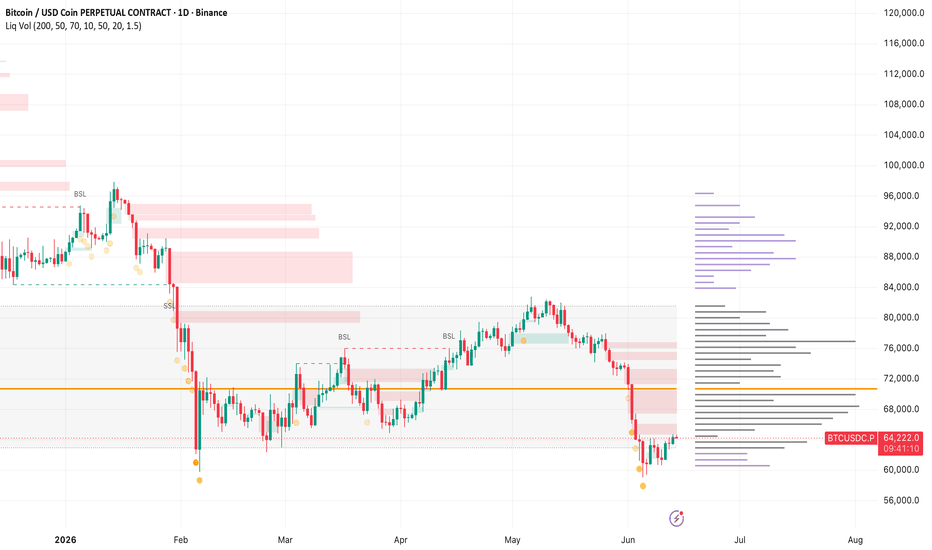
Liquidity & Volume Profile Framework [invincible3]Liquidity & Volume Profile Framework
The Liquidity & Volume Profile Framework is a price-action and volume-profile framework designed to help traders identify high-probability trading zones using liquidity, value area structure, fair value gaps, and volume confirmation.
This indicator is built around the idea that strong trades usually happen when price reacts around important institutional zones such as POC, VAH, VAL, HVN/LVN areas, and liquidity pools created around equal highs and equal lows.
The tool does not simply give random buy or sell signals. Instead, it maps the market structure so the trader can wait for proper confluence before entering.
Core Concept
This indicator follows a structured institutional trading workflow:
Step 1 — Read the Market Structure
The indicator identifies key volume-profile levels:
POC — Point of Control
The price level with the highest volume concentration inside the selected lookback range.
VAH / VAL — Value Area High and Value Area Low
The upper and lower boundary of the value area, based on the selected value-area percentage.
HVN / LVN Zones
High-volume and low-volume areas are displayed as volume-profile bars.
HVN zones can act like magnets, while LVN zones often behave like thin liquidity zones where price can move quickly.
BSL / SSL Liquidity Pools
The indicator tracks swing highs and swing lows to identify potential buy-side liquidity and sell-side liquidity.
Step 2 — Wait for a Trigger
The indicator highlights possible institutional reaction triggers:
Liquidity Sweep
A bullish sweep occurs when price takes out a prior swing low and closes back above it.
A bearish sweep occurs when price takes out a prior swing high and closes back below it.
This helps identify possible stop-hunt behavior around liquidity pools.
Fair Value Gap — FVG
Bullish and bearish imbalance zones are detected automatically.
These areas can act as retracement zones where price may return before continuation.
VA / POC Touch
Reactions around VAH, VAL, or POC can provide important confluence when combined with sweep or FVG logic.
Step 3 — Confirm with Volume
The indicator includes a volume spike condition.
A volume spike is detected when current volume is greater than the selected moving-average volume multiplied by the chosen spike multiplier.
By default, the logic uses:
Volume > 1.5 × Average Volume
This helps highlight moments where institutional participation may be stronger than normal.
Step 4 — Entry Logic
The strongest setups usually appear when multiple conditions align in the same zone:
Liquidity sweep + FVG fill + VAH / VAL / POC reaction + volume spike
Example bullish setup:
Price sweeps sell-side liquidity below a prior swing low, closes back above the level, returns into a bullish FVG, reacts near VAL or POC, and shows increased volume.
Example bearish setup:
Price sweeps buy-side liquidity above a prior swing high, closes back below the level, returns into a bearish FVG, reacts near VAH or POC, and shows increased volume.
Step 5 — Risk Framework
The indicator is designed to support structured risk planning:
Stop Loss
Usually placed just beyond the swept liquidity level.
Target 1
Often the POC or opposite value-area boundary.
Target 2
The opposing liquidity pool or major high-volume / low-volume area.
Visual Legend
Orange line — POC
Dotted adaptive lines — VAH / VAL
Gold bars — High-volume areas / HVN
Purple bars — Low-volume areas / LVN
Green dashed sweep line — Sell-side liquidity sweep
Red dashed sweep line — Buy-side liquidity sweep
Green boxes — Bullish Fair Value Gaps
Red boxes — Bearish Fair Value Gaps
Gold circles — Volume spike confirmation
Main Features
Automatic fixed-lookback volume profile
POC, VAH, and VAL calculation
High-volume and low-volume profile bars
Bullish and bearish liquidity sweep detection
Buy-side and sell-side liquidity mapping
Automatic bullish and bearish FVG zones
FVG extension until fill or expiry
Volume spike confirmation using volume moving average
Theme-adaptive colors for dark and light charts
Institutional-style visual framework
Clean overlay design for price-action trading
Best Timeframes
This tool works best when used with a top-down approach.
For structure:
4H / Daily
For entries:
15m / 1H
Recommended workflow:
Use higher timeframe to identify POC, VAH, VAL, HVN, LVN, and major liquidity pools.
Then use lower timeframe to wait for liquidity sweep, FVG reaction, rejection candle, and volume confirmation.
Suggested Settings
For intraday trading:
VP Lookback: 100–200
VP Rows: 40–60
Value Area: 70%
Pivot Length: 5–10
Volume MA: 20
Volume Spike Multiplier: 1.5
For swing trading:
VP Lookback: 200–300
VP Rows: 50–80
Value Area: 70%
Pivot Length: 10–20
Volume MA: 20–50
Volume Spike Multiplier: 1.5–2.0
Important Notes
This indicator is not a standalone buy/sell signal system.
It is a confluence framework.
The highest-quality trades usually occur when liquidity, volume profile, imbalance, candle rejection, and volume confirmation all align in the same area.
Always wait for candle-close confirmation before entering.
Use proper stop loss and risk management. אינדיקטור
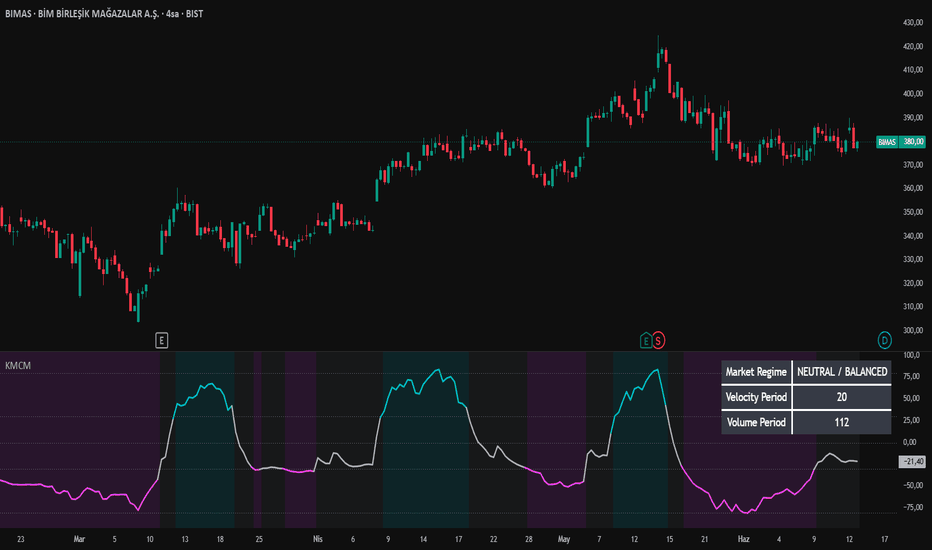
Kinetic Momentum & Capitulation Model (KMCM)🚀 KMCM Adaptive Regime Oscillator (KMCM)
The KMCM (Kinetic Momentum & Capitulation Model) is a volatility-adaptive market regime oscillator designed to quantify directional energy imbalance by integrating price momentum, volume mass dynamics, and statistical energy dispersion into a single bounded regime signal. Rather than treating price as a simple time series, KMCM reconstructs market behavior as an energy system where movement intensity is jointly determined by velocity and participation.
The core objective of KMCM is to detect regime transitions between momentum expansion, neutral equilibrium, and capitulation-driven stress phases. It does this by modeling market activity as a normalized kinetic system and transforming the resulting distribution into a bounded oscillator ranging approximately between -100 and +100.
Unlike traditional momentum indicators that rely primarily on price derivatives (ROC, RSI, MACD), KMCM incorporates volume-adjusted mass and volatility-adaptive scaling. This allows the indicator to remain structurally stable across different volatility regimes and asset classes while preserving sensitivity to regime shifts.
💡 Key Features
🧠 Kinetic Market Model:
KMCM interprets market behavior as a simplified physical system where price velocity represents momentum and volume represents mass. The resulting “energy” formulation captures the intensity of participation behind directional moves rather than price movement alone.
📊 Volume-Normalized Mass Scaling:
Volume is normalized against its adaptive moving average to construct a relative participation metric. This ensures that abnormal volume expansions or contractions are properly reflected in regime intensity rather than absolute scale distortions.
🔬 Volatility-Adaptive Period Engine:
All internal computation windows are dynamically adjusted using ATR-based volatility ratios. This prevents overfitting to fixed time horizons and ensures that the model self-adapts to changing market regimes.
⚡ Statistical Energy Transformation:
Directional energy is derived from velocity-squared magnitude scaled by participation mass, then standardized using z-score normalization. This produces a statistically consistent representation of market stress and expansion phases.
🛡️ Nonlinear Compression Layer:
A hyperbolic tangent transformation compresses raw statistical output into a bounded oscillator space. This preserves extreme regime information while preventing signal saturation during high volatility events.
📉 Dual-Threshold Regime Logic:
Market conditions are classified into three primary states:
* Expansion Regime (Above Upper Threshold): Strong directional imbalance and momentum continuation pressure
* Neutral Regime (Between Thresholds): Balanced market structure and reduced directional conviction
* Capitulation Regime (Below Lower Threshold): Stress-driven liquidation dynamics and downside exhaustion phases
🔬 Mathematical Logic and Structure
KMCM is built on a multi-layer statistical energy framework that converts raw market microstructure into a normalized regime oscillator.
The process begins by computing velocity as a rate of change over an ATR-adaptive window. This velocity is then combined with a volume-derived mass factor, which represents relative participation intensity compared to its historical baseline.
A kinetic energy proxy is constructed by squaring velocity and scaling it with normalized mass. This formulation ensures that large directional moves with strong participation are weighted disproportionately higher than low-volume price fluctuations.
To stabilize the signal, directional energy is standardized using a rolling mean and standard deviation, producing a z-score representation of market imbalance. This step transforms raw energy into a distribution-aware signal that is comparable across time and assets.
The z-score output is then passed through a hyperbolic tangent function, compressing it into a bounded regime oscillator. This step ensures nonlinear saturation control while preserving structural extremes.
Finally, exponential smoothing is applied to reduce microstructure noise, and slope filtering is used to eliminate short-term directional instability. This results in a stable regime oscillator that prioritizes structural shifts over transient fluctuations.
In essence, KMCM does not attempt to predict price direction. It models the *intensity and structure of market participation* as a kinetic system and translates it into a unified regime framework of expansion, neutrality, and capitulation.
🛠️ How to Use
1. Expansion Regime (Above Upper Threshold):
Indicates strong directional momentum supported by elevated participation. Trend continuation strategies and breakout positioning are statistically favored.
2. Capitulation Regime (Below Lower Threshold):
Represents forced liquidation, panic-driven behavior, or exhaustion of selling pressure. Reversal or mean reversion structures become more relevant.
3. Neutral Regime (Between Thresholds):
Signals equilibrium conditions where directional conviction is weak. Range-based strategies or reduced exposure conditions are more appropriate.
🎛️ Settings
* Minimum Velocity Period (7–21): Controls sensitivity of momentum detection
* Volume Period (30–150): Defines adaptive participation baseline
* Upper Threshold (30): Expansion boundary for regime classification
* Lower Threshold (-30): Capitulation boundary for regime classification
* Smoothing Length (7 EMA): Stabilization layer for signal refinement
📌 Credits and Origins
KMCM is engineered by @gunebak4n as a volatility-adaptive kinetic regime framework designed to unify momentum, volume, and statistical dispersion into a single structural oscillator. The model is intended for regime-based analysis rather than directional prediction, emphasizing structural transitions over raw price movement.
The design prioritizes robustness across volatility regimes, making it suitable for discretionary traders, quantitative researchers, and systematic strategy development workflows focused on regime awareness.
⚠️ Disclaimer
All outputs generated by KMCM are probabilistic and non-deterministic. This indicator does not predict future price direction or guarantee outcomes. It is a structural market analysis tool intended to support decision-making under uncertainty. Proper risk management is required at all times.
אינדיקטור
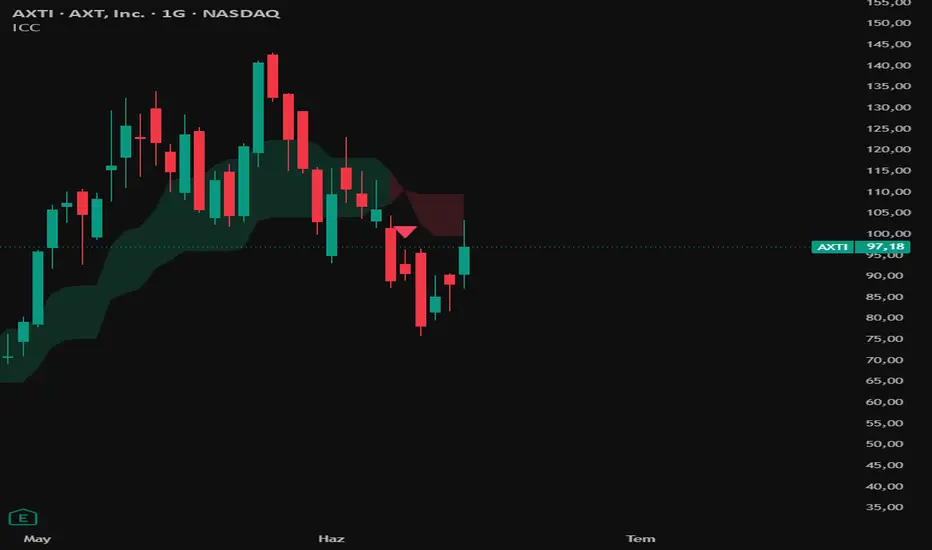
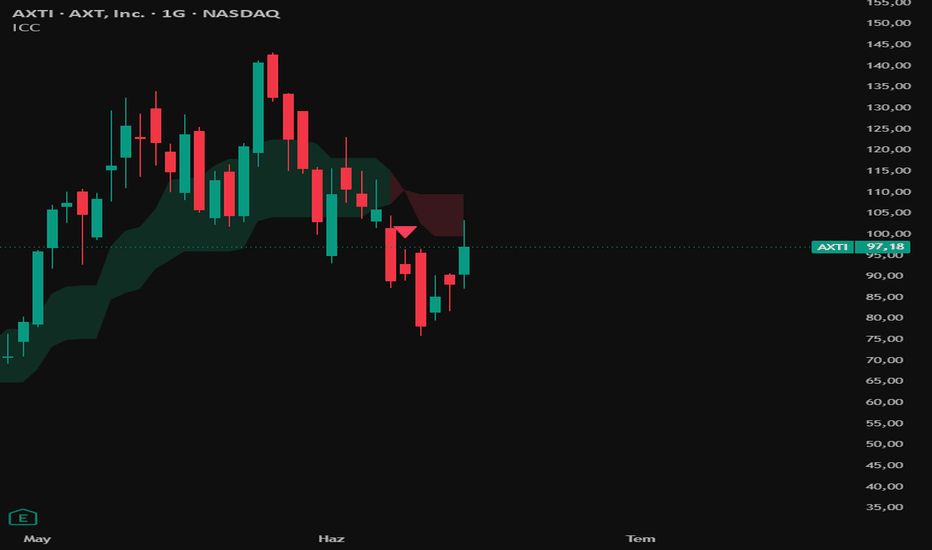
Ichimoku Core Corridor (ICC)🚀 Ichimoku Core Corridor (ICC)
The Ichimoku Core Corridor (ICC) is an institutional-grade, quantitative trend architecture designed to isolate market directionality and eliminate chart clutter. Conceptually built upon a radical optimization of Goichi Hosoda’s traditional Ichimoku Kumo logic and inspired by the technical implementations of Kıvanç Özbilgiç (@kivancozbilgic), this specific premium tool has been developed and engineered by @gunebak4n to isolate the true mathematical heart of the system: the interaction between Tenkansen (Short-Term Equilibrium) and Kijunsen (Medium-Term Trend Backbone).
Unlike standard Ichimoku setups that flood the screen with overwhelming lines, ICC transforms these core components into a dynamic, price-relative "Corridor / Plot". This gives professional traders immediate clarity on macro-regime shifts, compression zones, and institutional trend expansion.
💡 Key Features
🧠 Core Equilibrium Corridor: By treating the space between Tenkansen and Kijunsen as a unified geometric entity, ICC tracks real-time equilibrium. The corridor automatically dynamically adapts: turning Emerald Green during bullish expansion and Rose Red during bearish dominance.
🛡️ Noise-Reduction Engine: To protect traders from cognitive fatigue and high-frequency market noise, the raw Tenkansen and Kijunsen lines are mathematically mapped but completely hidden by default. Only the high-probability trend corridor remains visible, ensuring clean price-action analysis.
📊 Dual-Cloud Independent Control: ICC includes a fully integrated, modern implementation of the traditional Ichimoku Kumo Cloud. Both the custom Core Corridor (ICC) and the traditional cloud can be independently toggled, customized, and blended via the user dashboard to create a comprehensive multi-timeframe perspective—making it an absolute game-changer, hayatım.
⚡ Predictive Phase-Shift Signals: Armed with real-time momentum change detection, ICC plots discrete directional triangles at the exact bar where equilibrium flips. This prevents chasing late breakouts and locks entries into the birth of new micro-trends.
🔬 Mathematical Logic and Interaction
ICC acts as a dynamic spatial spread model. The indicator tracks the expansion and contraction of the two core lines, while simultaneously monitoring their physical intersection with the 26-period forward-shifted Senkou Span A and Senkou Span B boundaries.
Formulas:
Tenkansen = (Highest High + Lowest Low) / 2 over a rolling 9-period lookback.
Kijunsen = (Highest High + Lowest Low) / 2 over a rolling 26-period lookback.
The indicator maps the maximum and minimum boundaries of both fields on the active bar. When the fast-moving Core Corridor physically intersects or penetrates the boundaries of the traditional Kumo cloud, it triggers a high-order structural crossover signal.
🛠️ How to Use
1. The Dynamic Corridor Ride: As long as price remains structured above the Emerald Green Corridor, the bullish macro-regime is completely intact. Avoid shorting or counter-trend scalping.
2. The Equilibrium Reversion (Chop): When price action gets trapped inside the Core Corridor, the market is in a temporary state of maximum balance (Accumulation/Distribution). Look for a breakout close outside the corridor boundaries.
3. Shape Momentum Triggers: Watch for the print of the Emerald Green Up-Triangle (Bullish Shift) or Rose Red Down-Triangle (Bearish Shift) to signal high-probability momentum entries.
4. Macro Cloud Intersection Backgrounds: When the entire Core Corridor physically crosses above the traditional cloud boundaries, a full background canvas flash is injected (Green for Bullish Cross, Red for Bearish Cross). This signals that short-term velocity has officially broken macro resistance.
🎛️ Settings
Tenkansen Period (9): Controls the short-term lookback filter for the fast equilibrium line. Optimize to 12 for highly volatile or fragmented liquidity pools.
Kijunsen Period (26): Controls the medium-term core trend filter. Acting as the ultimate trailing stop-loss anchor.
Show Visibility Toggles: Fully customizable checkboxes allowing you to isolate the ICC corridor, show/hide traditional clouds, or toggle momentum shapes and background intersection flashes.
📌 Credits and Origins
This specific edition is engineered by @gunebak4n (dedicated to the true passion of trading, hayatım), bridging classical Japanese chartism founded by Goichi Hosoda, modern spatial geometry, and quantitative script standards previously highlighted by Kıvanç Özbilgiç (@kivancozbilgic). It is dedicated to professional algorithmic and discretionary traders who demand a mathematically sound, clutter-free view of trend validation and market structure mechanics.
Disclaimer: All financial indicators are purely probabilistic models. ICC is an advanced decision-support architecture and does not guarantee execution success or profits. Always utilize strict risk management protocols and predefined stop-losses. אינדיקטור
Entropy VZO [Alpha Extract]A sophisticated volume-flow and market-information oscillator that combines pressure-weighted volume, statistical normalization, directional entropy, fractal efficiency, Gaussian smoothing, and signal-line analysis into one complete momentum framework. Entropy VZO is designed to measure whether bullish or bearish price movement is supported by meaningful volume while adapting its sensitivity to the quality and organization of current market structure.
Unlike a conventional oscillator displayed in a separate pane, Entropy VZO projects its momentum structure directly onto price using an ATR-scaled anchor. This provides a clear overlay of volume momentum, signal direction, histogram expansion, threshold zones, and dynamic pulse activity without separating the analysis from the underlying chart.
🔶 Pressure-Weighted Volume Flow Engine
Calculates directional volume using a blend of candle pressure and source-price direction. Candle pressure measures the relationship between the candle body and its full range, while source direction determines whether price is advancing or declining.
candlePressure = (close - open) / priceRange
closePressure = ta.change(src) > 0 ? 1.0 : ta.change(src) < 0 ? -1.0 : 0.0
signedPressure = clamp(candlePressure * 0.65 + closePressure * 0.35, -1.0, 1.0)
signedVolume = volume * signedPressure
volumeBase = math.max(ta.ema(volume, vzoLength), 1.0)
vzo = 100.0 * ta.ema(signedVolume, vzoLength) / volumeBase
This produces a more detailed estimate of bullish and bearish participation than assigning all volume according to candle direction alone.
🔶 Normalized VZO Framework
Standardizes the raw VZO against its recent average and standard deviation. This allows the indicator to evaluate current volume pressure relative to the instrument’s own recent behaviour.
Positive readings indicate stronger-than-normal bullish volume flow, while negative readings represent stronger bearish pressure. Larger absolute readings show that the current volume imbalance is becoming increasingly unusual relative to its recent history.
🔶 Directional Entropy Analysis
Measures how evenly upward and downward price changes are distributed across the selected lookback period.
Low entropy indicates that price direction is more ordered and consistent. High entropy indicates a less predictable environment where upward and downward movements are more evenly balanced.
This allows the indicator to give greater weight to volume signals occurring during organized directional movement and reduce their influence during noisy or indecisive conditions.
🔶 Fractal Efficiency Framework
Evaluates how efficiently price has travelled between the beginning and end of the selected lookback relative to the total path taken.
High efficiency indicates that price is moving directly with limited back-and-forth movement. Low efficiency indicates a more irregular path with greater noise and weaker directional structure.
🔶 Information-Weighted Momentum Engine
Combines directional entropy and fractal efficiency into a unified information-quality weight. This weight adjusts the normalized VZO according to how organized and efficient the current market environment is.
informationWeight = clamp((1.0 - entropy) * 0.55 + efficiency * 0.45, 0.05, 1.0)
spectralInput = vzoZ * sensitivity * (0.65 + informationWeight)
fisherCore = tanhSafe(spectralInput) * maxLevel
Volume pressure receives greater emphasis when price movement is both directional and efficient. Signals are moderated when market structure becomes noisy, balanced, or fragmented.
🔶 Bounded Nonlinear Transformation
Applies a protected nonlinear transformation to compress extreme readings into a stable visual range.
This prevents isolated volume spikes from overwhelming the indicator while preserving momentum direction and relative strength. The result is a bounded oscillator centered around zero.
🔶 Gaussian Signal Polishing
Uses custom Gaussian-weighted smoothing to reduce short-term noise while preserving recent momentum information.
Separate smoothing stages are applied to the main oscillator and histogram. Traders can adjust these settings to make the indicator more responsive or more selective depending on their market and timeframe.
🔶 Bullish, Bearish & Neutral Regimes
Classifies the market into three momentum conditions:
• Bullish when the oscillator is above its signal and above zero
• Bearish when the oscillator is below its signal and below zero
• Neutral when momentum direction and zero-line position are not fully aligned
This dual-confirmation structure helps distinguish established directional momentum from weaker signal-line movements.
🔶 ATR-Scaled Price Projection
Projects the oscillator directly onto the price chart using an EMA-based anchor and an ATR-adjusted visual range.
The projection automatically adapts to current volatility, allowing the indicator to maintain a consistent appearance across different assets, prices, and timeframes. The Visual Height setting controls how widely the oscillator is displayed around its price anchor.
🔶 Soft & Hard Momentum Zones
Displays configurable soft and hard momentum thresholds above and below the central price anchor.
Soft levels highlight developing momentum extremes, while hard levels identify stronger volume-flow displacement. These areas provide context for momentum intensity rather than acting as automatic reversal signals.
🔶 Dynamic Pulse Band
Displays a smoothed measure of absolute oscillator strength around the price anchor.
The pulse band expands as momentum intensity increases and contracts when momentum weakens. Its color follows the active regime, creating a visual representation of both directional bias and momentum amplitude.
🔶 Momentum Histogram
Measures the difference between the main oscillator and its signal line to show whether momentum is expanding or contracting.
Bright bullish readings indicate strengthening positive momentum, while faded bullish readings indicate that positive momentum is slowing. Bright bearish readings represent strengthening negative momentum, while faded bearish readings show bearish pressure losing force.
🔶 Signal Ribbon & Glow Architecture
Plots the main Entropy VZO line with a layered glow and an optional ribbon between the oscillator and signal line.
The ribbon changes color according to the active bullish, bearish, or neutral regime. This makes momentum alignment, crossovers, and transition periods easier to identify while maintaining chart readability.
🔶 Dynamic Candle Coloring
Optionally colors OHLC candles according to the current oscillator regime.
Bullish coloring appears when the oscillator is above both its signal and zero. Bearish coloring appears when it is below both references. Neutral coloring identifies mixed, transitional, or weakly confirmed conditions.
🔶 Real-Time Status Dashboard
Features a compact dashboard displaying the indicator’s most important information:
• Current bullish, bearish, or neutral regime
• Main oscillator value
• Normalized VZO Z-score
• Directional entropy percentage
• Fractal efficiency percentage
• Current volume relative to its EMA baseline
This provides an immediate overview of momentum direction, volume abnormality, market organization, directional efficiency, and participation strength.
🔶 Comprehensive Alert System
Includes alerts for the indicator’s primary momentum events:
• Entropy VZO Bull Swing
• Entropy VZO Bear Swing
• Entropy VZO Bull Trend
• Entropy VZO Bear Trend
Swing alerts trigger when the oscillator crosses its signal line. Trend alerts trigger when the oscillator crosses the zero level, allowing traders to monitor both early momentum shifts and broader directional transitions.
🔶 Why Choose Entropy VZO ?
Entropy VZO expands traditional volume-flow analysis by combining pressure-weighted volume, statistical normalization, directional entropy, and fractal efficiency within one adaptive momentum framework. Instead of treating every increase in volume equally, the system evaluates whether that participation is occurring inside an organized and efficient market environment.
The oscillator and signal line identify direction, the histogram measures momentum expansion, the pulse band displays intensity, and the soft and hard zones provide context for elevated readings. Its ATR-scaled projection keeps the complete framework connected directly to price, while the live dashboard provides fast insight into volume flow, entropy, efficiency, and the active regime.
Perfect for momentum traders, swing traders, trend-following traders, and systematic analysts who want a cleaner way to determine whether directional price movement is supported by meaningful and structurally efficient volume flow. אינדיקטור

Quantum Imbalance Trap [MarkitTick]💡 This advanced analytical tool is a comprehensive market structure and momentum suite designed to identify high-probability institutional-style footprints through structural price imbalances, relative volume anomalies, and dynamic volatility tracking. By integrating a sophisticated multi-layered filtering engine, it provides traders with a complete visual and statistical ecosystem, featuring dynamic risk-to-reward mapping, session-specific filters, advanced RSI divergence checks, and automated JSON webhook alerts for seamless algorithmic integration.
✨ Originality and Utility
What sets this tool apart from conventional momentum oscillators is its holistic, data-driven approach to signal validation. It does not merely detect large candles; it synthesizes the candlestick's body-to-range ratio, compares localized volume to a historical moving average, and optionally requires structural liquidity sweeps and RSI divergences before flagging an event. Furthermore, the inclusion of fully formatted, localized JSON alerts containing precise targets and confidence scores makes this indicator highly utilitarian for traders utilizing automated execution bots. The real-time, non-invasive dashboard completely eliminates the need for manual risk-to-reward drawing tools, drastically reducing cognitive load.
🔬 Methodology and Concepts
The core engine operates on a strict, multi-variable confluence matrix:
Imbalance & Volume Detection: Evaluates the specific relationship between a candle's real body and its total range (high-to-low). A signal triggers only if this ratio exceeds a user-defined threshold simultaneously with a volume surge that breaches a defined multiplier of the historical volume SMA.
Momentum & Trend Alignment: Utilizes a fast versus slow Simple Moving Average crossover to dictate the immediate micro-trend, ensuring signals fire in the direction of the active order flow.
RSI Divergence: An optional mechanical filter that compares recent price action against a 14-period RSI to locate classic bullish or bearish divergences, adding a layer of exhaustion-reversal logic.
Liquidity Sweeps: Analyzes recent price nodes to determine if local swing highs or lows were structurally breached (swept) prior to the imbalance, indicating potential trap mechanics.
MTF Validation: Safely references a non-repainting higher timeframe (HTF) 20-period SMA. It dynamically penalizes the mathematical "Confidence Score" if the micro-signal contradicts the macro trend.
🎨 Visual Guide
• Chart Elements
Entry Zone Boxes: Semi-transparent cyan boxes indicating the optimal dynamic re-entry area based on a 0.35x ATR modifier.
Signal Labels: Upward (cyan) or downward (orange) triangles marking the exact trigger candle with localized text.
Risk-to-Reward Lines: Solid colored lines for the Entry point, dashed deep pink lines for the Stop Loss (SL), and dotted lines for Take Profit (TP) levels 1, 2, and 3.
Price Labels: Text annotations extending rightward from the action, detailing the exact price coordinate and R-multiple for each respective TP level.
• On-Chart Dashboard
Positioned in the top-right corner with a sleek, dark-themed background and custom-colored text mappings.
Row-by-Row Metrics: Displays the asset ticker, localized Micro Trend, HTF Macro Trend, Imbalance Percentage, Volume Spike Percentage, and an aggregated Confidence Score using active visual block meters (█/░).
Live Tracking: Monitors the active trade state (Long/Short/Idle), current ATR value, dynamically tracked Entry/SL/TP prices, and a live tracking of the floating Risk-to-Reward (R) metric.
📖 How to Use
Wait for a definitive signal label to plot on the chart, confirming that the baseline imbalance, volume, and enabled filters have aligned.
Consult the on-chart dashboard to review the "Confidence Score." A higher percentage (closer to 100%), supported by solid block meters and HTF alignment, indicates a structurally superior setup.
Utilize the automatically generated Entry, Stop Loss, and TP lines to establish risk parameters before executing a position. The shaded zone box identifies an optimal area to scale in.
For algorithmic setups, configure your external bot to parse the automated JSON alert strings to execute trades completely hands-free based on the indicator's defined R-multiples.
⚙️ Inputs and Settings
Every aspect of the logic and visual output is fully customizable through categorized input groups:
• Signal Detection
Imbalance Lookback (Bars): Dictates the lookback window for volume averages, momentum SMAs, and localized swing structures.
ATR Period: The lookback length for the Average True Range calculation, governing dynamic SL distances.
Body-to-Range Threshold: The minimum percentage the solid candle body must occupy relative to its entire wick-to-wick range.
Volume Spike Multiplier: The exact threshold multiplier by which current volume must exceed the volume SMA.
RSI Divergence Confirmation: A toggle to mandate an active RSI divergence for signal validation.
• Smart Money Concepts
Require Liquidity Sweep: When toggled, the engine mandates a structural sweep of the recent highest high or lowest low before plotting a signal.
• Order Flow
Higher Timeframe Alignment: Mandates that the localized signal matches the structural bias of a higher timeframe.
Higher Timeframe: A dropdown selection to dictate the exact MTF resolution referenced (e.g., 60 minutes).
Dynamic Re-entry Zone: Toggles the persistent forward extension of the Entry Zone boxes for continued visual reference.
• Risk Management
Stop Loss ATR Multiplier: Defines the precise mathematical distance of the stop loss line, scaling automatically with asset volatility.
Take Profit 1, 2, and 3 (R-Multiple): Exact floating-point settings to define the distances of targets based strictly on Risk-Reward multiples.
• Alerts & Sessions
Bullish / Bearish Signal Alert: Toggles for activating the fully structured JSON alert webhooks.
Enable Session Filter: Activates strict time-based operational windows.
London / New York Open: Specific boolean toggles to restrict signal detection exclusively to the London (07:00–10:30 UTC) and/or New York (12:30–15:00 UTC) trading sessions.
• Dashboard & Visual Style
Show Entry Zone / Show Price Labels: Toggles to hide or display specific on-chart visual elements to manage chart clutter.
Background / Text Colors: Dedicated color pickers for the dashboard table aesthetics.
Bullish / Bearish / Target Colors: Complete hex/RGB customization for trend alignments, signal labels, and every dynamically drawn Risk-to-Reward line.
🔍 Deconstruction of the Underlying Scientific and Academic Framework
The algorithmic foundation of this indicator heavily relies on volume-weighted price kinematics and statistical normalization. By isolating the body-to-range differential, the code mathematically abstracts the concept of aggressive, one-sided market participation, filtering out symmetric volatility (dojis) in favor of asymmetric momentum. The integration of relative volume acts as an independent confirming variable, a critical tenet in auction market theory, which postulates that true price discovery requires heavy transactional density.
The "Confidence Score" utilizes a multivariate linear normalization technique. It aggregates disparate data arrays—imbalance depth, volume intensity, and momentum velocity—into a bounded 0-100 percentage scale. Crucially, it applies a deterministic penalty if the micro-trend contradicts the macro-trend, rooted in the fractal nature of time-series analysis where higher-degree trends exhibit stronger gravitational pull on price action. Finally, the risk mechanics are anchored in dynamic expectancy models; by utilizing the Average True Range (ATR) multiplied by user-defined R-variables, the script ensures that standard deviation and local variance are constantly factored into target projection, honoring the mathematical realities of market heteroskedasticity.
⚠️ Disclaimer
All provided scripts and indicators are strictly for educational exploration and must not be interpreted as financial advice or a recommendation to execute trades. We expressly disclaim all liability for any financial losses or damages that may result, directly or indirectly, from the reliance on or application of these tools. Market participation carries inherent risk where past performance never guarantees future returns, leaving all investment decisions and due diligence solely at your own discretion. אינדיקטור

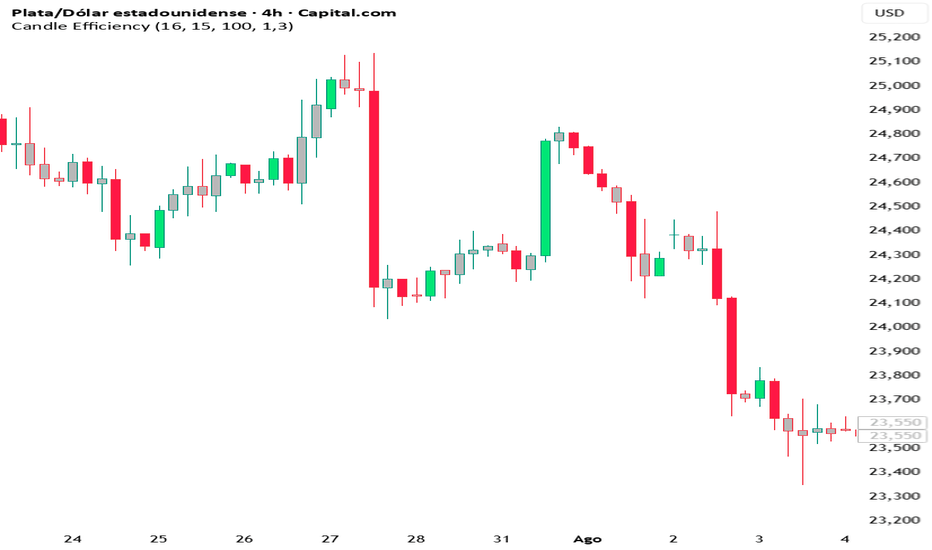
Candle EfficiencyCandle Efficiency
Candle Efficiency reveals the true strength behind each candle by looking inside it. Two candles can have the exact same size and color yet tell completely different stories: one may have moved in a clean, decisive push, while the other crawled there through constant back-and-forth. The standard chart hides this, because a candle is only a summary of what happened inside it. This indicator breaks each candle down into its lower-timeframe components and measures how efficient the move really was, then highlights only the candles that moved with genuine conviction.
HOW IT WORKS
For every candle on your chart, the indicator pulls all the candles from a lower timeframe that make up that candle (it "dissects" the candle). It then compares two things:
- Net movement: the absolute distance from open to close of the candle (how far price actually advanced, in clean terms).
- Total internal movement: the sum of the open-to-close moves of every lower-timeframe candle inside it (how much price moved in total, including all the back-and-forth).
Efficiency = Net movement / Total internal movement
A value close to 1 means the move was direct and strong: price went almost in a straight line, with little wasted motion. A value close to 0 means the move was choppy and weak: lots of internal movement that cancelled itself out and barely advanced. A large green candle built from one clean push is efficient; a same-sized green candle built from hesitation, pauses and reversals is inefficient, even though both look identical on the chart.
AUTO-CALIBRATION
Two things adjust automatically so the indicator works on any market and any timeframe without manual tuning:
- Inner timeframe: chosen automatically to keep a constant ratio (around 16 lower-timeframe candles inside each chart candle). On a 4h chart it uses 15m, on 1h it uses 5m, on 15m it uses 1m, and so on. You can change the target ratio or set the inner timeframe manually if you prefer.
- Strength threshold: the indicator measures the recent average efficiency of the current asset and only highlights candles whose efficiency clearly exceeds that average (by default, 1.3 times the average). This means "strong" always adapts to what is normal for that specific asset and timeframe, instead of relying on a fixed value that would only fit one market.
WHAT YOU SEE
Only strong candles are colored: bright green for strong bullish candles, bright red for strong bearish ones. Every other candle (weak or average) stays neutral gray. At a glance you only see where there was real conviction behind the move, with no noise from the ordinary candles.
HOW TO USE IT
Basic reading: the bright candles mark moves made with genuine strength. A breakout, a trend leg or an impulse confirmed by a bright candle carries real conviction behind it; the same move shown as a gray candle is weak and far more suspect. It helps separate moves that have fuel from moves that are just drifting.
Reading the shift of control (advanced): because the indicator shows which side is moving with strength, it makes changes of control visible before price fully confirms them. Watch for this sequence at the end of a trend:
- In a downtrend: while sellers are in control, the strong candles are red. When the decline starts turning gray (red candles stop being strong), the trend is losing conviction even though price is still falling. If strong green candles then begin to appear on the bounces, control is shifting to buyers, and a reversal to the upside becomes likely.
- In an uptrend: the mirror image. Strong green candles dominate the rise, then the top turns gray (green candles lose their strength), and the appearance of strong red candles signals control passing to sellers and a likely reversal down.
The gray phase is the key early warning: it shows the trend running out of strength before the actual turn, which is information you cannot get from price alone. The arrival of a strong candle of the opposite color then confirms the change of control.
NOTES
The indicator relies on lower-timeframe data, so it needs the inner timeframe to be smaller than the chart timeframe. On assets without volume data it still works, since the efficiency calculation is based on price movement, not volume. Like any tool, it describes what has already happened (it is reactive, not predictive) and works best as a reading aid alongside your own structure and levels, not as a standalone signal. אינדיקטור
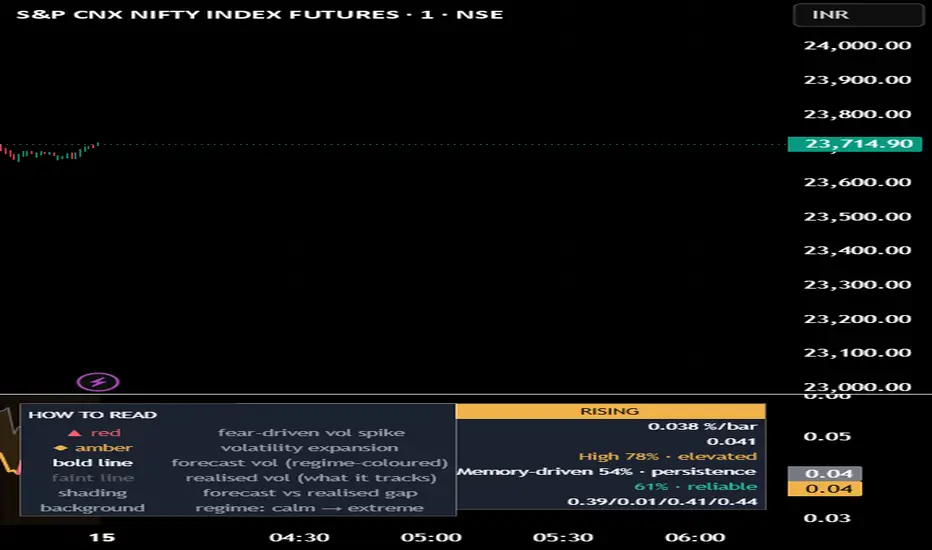
Path-Dependent Volatility Forecast# Path-Dependent Volatility Forecast — Publication Description
### What it is
A self-calibrating forecaster of an instrument’s own **realised volatility**, built only from its price path. It estimates how large the next bar’s volatility is likely to be, explains *why* (which part of the price path is driving it), and shows *how well* that explanation is currently working on the symbol in front of you. It is **context for risk and regime awareness — not a buy/sell signal and not a strategy.** It plots in a sub-pane: a forecast line, the realised-vol line it tracks, regime shading, and a compact dashboard.
### The idea, in one paragraph
Volatility is largely **path-dependent**: an asset’s volatility is mostly explained by its own recent price path. Falling prices tend to lift volatility (the leverage effect), recent movement tends to persist (volatility clustering), and strong rallies add their own volatility. This script turns that idea into a working, per-instrument forecaster and then proves the fit on-chart.
### Why these components are combined (mashup justification)
This is **one model expressed as a single estimate → explain → calibrate → decompose → verify loop**, not a bundle of unrelated indicators stacked together. Each stage is necessary; remove any one and the result breaks:
1. **Realised-volatility estimator** (range-based Garman-Klass, or close-to-close) measures the ground-truth volatility the model is trying to explain. Without it there is nothing to fit to.
2. **Path features** are the model’s inputs: a *trend / leverage* feature (a weighted average of recent returns) and an *activity / churn* feature (the square root of a weighted average of recent squared returns), each built as a blend of fast, medium and slow kernels so it carries short **and** long memory; plus an **upside-convexity** term (so strong rallies add volatility) and a **persistence (memory)** term (a longer-horizon average of past realised vol). Features without calibration are unscaled noise.
3. **Rolling ridge calibration** fits the weights of `realised_vol ≈ b0 + b1·trend + b2·activity + b12·upside + b3·memory` to *this* instrument by rolling regression. The predictors are correlated, so the fit is **ridge-regularised on standardised predictors** to keep the coefficients steady. Calibration without features has nothing to fit; features without calibration cannot be put in the right units.
4. **Decomposition** splits the forecast into its drivers — **Path** (leverage / upside), **Activity** (churn), and **Memory** (persistence) — which is the interpretation the model makes possible.
5. **Live fit read-out** (rolling R² of forecast vs realised) is the proof the loop is working on the asset in front of you.
So the five parts are stages of a single pipeline: measure realised vol, explain it from the path, calibrate to the instrument, decompose it, and verify the fit — one engine, not five overlays.
### How it works (more detail)
- **Inputs are lagged one bar.** The path features are built from confirmed past returns, so each bar’s forecast is known before that bar’s own return forms — a genuine one-step-ahead forecast. Historical values do not change.
- **Kernels.** Each feature blends a fast, a medium and a slow-tail kernel. The slow tail approximates the heavy, slowly-decaying weighting that long-memory volatility requires; the fast kernel keeps it responsive.
- **Positivity.** The activity feature is floored to stay strictly positive, keeping the forecast well-defined.
- **Calibration.** A 4-predictor ridge regression is solved each bar over a rolling window via standardised correlation-matrix inversion, then mapped back to raw units. Ridge (a single, adjustable penalty) is what keeps the correlated predictors from producing erratic coefficients.
### How to read it
- **Bold line** = the model’s volatility **forecast**; **faint line** = the **realised** volatility it tracks. Close agreement = the model fits here.
- **Driver** tells you *why* volatility is where it is: **Path** (a falling path lifting vol = leverage/fear, or a strong rally = upside), **Activity** (recent churn persisting), or **Memory** (volatility coasting on its own persistence). The % is that channel’s share.
- **Model fit** is the rolling R² — how much of realised-vol variance the path explains on this symbol. Trust the forecast more when it is high; treat it cautiously when it reads “weak.”
- **Regime** (Low / Normal / High / Extreme) is the forecast’s own percentile. Rising vol from a Low regime is an expansion; this is context, not a trade call.
- **Markers:** ▲ red = a fear-driven spike; ◆ amber = a volatility expansion into the High regime.
A practical note: this forecasts the **size** of moves, not their **direction**. A high forecast says “expect bigger swings,” not “go long/short.” Typical uses are risk-management context (sizing, stop width), regime filtering (compressed Low regimes precede expansions; Extreme regimes tend to mean-revert), and options-style context (is volatility likely to rise or fade) — always as context layered on your own method.
### Universal data layer (works on any asset, any market)
The script reads the chart’s own symbol by default, so it runs on equities, futures, FX, crypto and indices with no configuration. Settings let you:
- choose the **price source** (close / hl2 / hlc3 / ohlc4),
- optionally compute the forecast on a **different symbol** than the one charted,
- optionally run on a **fixed calculation timeframe** for a stable basis,
- choose the realised-vol estimator (range-based or close-to-close) for symbols with or without usable ranges.
The dashboard theme is **adaptive**: it reads the chart background and keeps text and cells legible on dark or light colour schemes (or you can force Dark/Light).
### What makes it original
A working, per-instrument path-dependent **realised-volatility forecaster** with rolling ridge self-calibration, a three-way (Path / Activity / Memory) decomposition, and an on-chart fit score — a recent institutional volatility concept made legible and measurable on a chart, rather than an ATR or a standard-deviation band. It does not merely display a volatility statistic; it fits a small volatility model to the symbol and shows you both the forecast and how much to trust it.
### Limitations (honest)
- Volatility is forecastable but never certain. The realised-volatility research this builds on explains a **minority** of realised-vol variance even at its best, so a rolling fit in the 0.3–0.6 range is doing well, not failing.
- The forecast is a **reduced, practical form** of the underlying framework; it is meant as context, not a precise volatility product.
- The fit dips through structural breaks; the dashboard shows it (“weak”), which is itself useful information.
- An optional higher calculation timeframe than the chart can update intrabar until that bar closes; the default (chart timeframe) does not.
### Credits
The path-dependent volatility framework this script operationalises is from the academic work of **J. Guyon and J. Lekeufack, “Volatility is (mostly) path-dependent” (2023)**. The persistence/memory predictor follows the heterogeneous-autoregressive (HAR) realised-volatility approach of **F. Corsi (2009)**. The range-based realised-variance estimator is **Garman & Klass (1980)**. The activity-positivity treatment follows results by **Nutz & Riveros Valdevenito** and **Andrès & Jourdain**. This implementation, the rolling ridge self-calibration, the Path/Activity/Memory decomposition, and the on-chart fit score are the author’s own work.
### Disclaimer
This script is a study/indicator for chart analysis and education only. It is **not** a strategy, **not** a recommendation, and **not** financial advice. It places no orders and guarantees no outcome. All values are estimates derived from price and can be wrong, especially through structural breaks and on illiquid or low-history symbols. Markets carry risk; do your own research and manage your own risk.
אינדיקטור

אינדיקטור

אינדיקטור
אינדיקטור

ATR Trailing Stop ProTitle:
ATR Trailing Stop Pro — Long & Short | Close/Wick Filter | Alerts | Risk %
Description:
A fully-featured ATR-based trailing stop anchored to a specific entry date and price — built for traders who want to manage an open position with a clean, rules-based stop rather than a signal generator.
Unlike generic ATR stop indicators that run on every bar from the beginning of the chart, this one starts exactly where your trade did.
Features
🔴 Long & Short — trails upward for longs, downward for shorts
📅 Entry date & price — set your exact entry point; leave price at 0 to use the day's close automatically
📊 ATR-based trailing — stop only ever moves in your favour, never against you
🕯️ Close vs wick stop-out — choose whether a close below the stop triggers it, or any wick (reduces false exits on volatile assets like BTC/crypto)
🏷️ Chart labels — marks your entry price and stop-out point directly on the chart
📋 Info table — live overlay showing entry price, current stop level, risk % from entry, and trade direction
🔔 Built-in alert — set it once and get notified when your stop is hit without watching the chart
How to use
Add the indicator to a daily chart
Open settings and enter your entry year, month, day
Enter your entry price or leave at 0 to use that day's close
Select Long or Short
Adjust the ATR multiplier to suit your risk tolerance (higher = wider stop, less noise)
Toggle Close mode on if you want to avoid getting stopped out by intraday wicks
Set an alert on the indicator for hands-off monitoring
Works on any asset — stocks, crypto, forex, commodities. Designed and tested on Bitcoin daily. For best results use on the 1D timeframe. אינדיקטור

Options Probabilistic Bounds [InferredSignals]█ OVERVIEW
Options Probabilistic Bounds (OPB) draws a forward price corridor on the daily chart — an upper and a lower band projected over a horizon you choose (1 to 20 trading days) at a confidence level you choose (default 95%).
In plain words: given how this stock has actually been moving, where could the CLOSING price realistically land over the next few days? The corridor is calibrated so that, at each horizon, roughly your chosen percentage of closes finish inside it.
It is built for option sellers — short puts in particular. The lower band is a statistically calibrated reference for where to place a strike. And because the corridor takes no view on direction, OPB adds something most volatility tools don't: a drift readout that tells you which side currently has the wind at its back, so you can see whether puts or calls are the safer leg to sell right now.
No option-chain data is used anywhere — no implied volatility, no greeks, no implied-vol skew. "Options" describes who the tool is for, not what it reads. OPB is a pure statistical model of the underlying's own price history.
█ WHAT MAKES IT ORIGINAL
• Per-symbol MAP-style calibration, entirely in Pine.
Parameters are fitted to each ticker by minimizing a penalized negative log-posterior — Student-t likelihood, Bayesian-style priors, and residual-moment penalties combined in one objective — searched multi-start and coarse-to-fine, with the winner chosen on residual quality, not likelihood alone. The result: less in-sample curve-fitting and a steadier calibration than a plain best-fit vol model.
• Two-component, leverage-aware GJR-GARCH variance.
A slow long-run level plus a faster mean-reverting short-run component, so a volatility shock decays over a few days instead of holding the corridor wide for weeks. Negative-return days get a specific leverage response — downside risk is modeled, not averaged away.
• Filtered historical tails with EVT extension.
The residual body is empirical (Filtered Historical Simulation); each tail is extended with a Generalized Pareto fit whose shape and scale are estimated in closed form by Probability-Weighted Moments (Hosking-Wallis) — more stable than method-of-moments or MLE on the small tail samples you actually get. The shape is floored at zero so equity tails are never assumed bounded, and with too few exceedances it falls back to empirical quantiles rather than overfitting noisy extremes.
• Data-driven downside asymmetry.
The downside leverage increment is routed fully to the lower band; the upper band receives only a data-driven semivariance fraction. The corridor widens below only as far as the symbol's own history justifies.
█ THE DRIFT READOUT — WHICH SIDE TO SELL
The bands are DRIFT-NEUTRAL by design: centered on today's close, never tilted up or down. Over 1–20 days, direction is effectively unestimable from price history — and a wrong directional bet would quietly under-reserve the downside, the worst place to be short a put. So the whole band width is spent on dispersion, none of it gambled on a direction the data can't support.
OPB still measures the recent drift and reports it as a small number next to σ, in :
• ↑ : favors puts — the stock has been drifting up, so the put leg has had a cushion.
• ↓ : favors calls — drifting down, the call leg has had the cushion.
• flat — no meaningful drift.
Practical read: it is usually safer to sell the leg the drift is moving AWAY from — sell puts into an uptrend, calls into a downtrend. The wind at your back.
In the backtest this shows up cleanly: on a strongly trending stock the drift-neutral bands breach the TREND side more often than the nominal rate, while the opposite side stays close to it. This is expected, not miscalibration — the corridor is honestly direction-agnostic, so the band width itself stays unbiased and the extra breaches on the trend side are pure drift. The takeaway matches the readout: the side you should be selling — the one the trend is moving away from — is the side that stays calibrated. One caveat: the drift readout is the RECENT past, never a forecast — a strong reading is often exactly where mean-reversion becomes most likely. The fat-tailed band remains the real safety net.
MU · daily · walk-forward, monthly recals. On this uptrend the trend side (Brch+) runs well above nominal while the put-sell side (Brch−) holds at/below its 2.5% target — the drift asymmetry described above, in numbers.
█ HOW TO USE IT
• Set a horizon (e.g. 5 days) and a confidence level (e.g. 95%).
• Read the upper/lower band at your horizon as a strike-placement reference.
• Glance at the drift readout to pick the safer leg — puts vs calls.
• Turn on the walk-forward backtest and check: Close-in ≈ your confidence level; Brch+ / Brch− near the per-side rate and reasonably balanced; NT dn = how often a lower-band strike was never touched over the whole path — the number that matters for assignment.
• Optional PIT diagnostic: D ≈ 1 well-sized, D < 1 too wide, D > 1 too narrow. Read h = 1 first (least affected by overlapping windows).
• Anchor mode D-1…D-5 freezes the corridor as it looked N days ago, calibrated only on data known then — handy to inspect how past corridors held.
█ SETTINGS
Defaults are robust and research-oriented: Horizon 5d · Confidence 95% · Calibration window 252d · Two-component variance ON · Leverage-asymmetric bands ON · Earnings-gap neutralization ON.
"Long-run half-life" sets how steady the long-run volatility baseline is — a higher value keeps it stiffer after a shock, which (with the two-component model on) reduces post-shock over-widening.
Every input ships with a plain-language tooltip. Daily timeframe only. Calibration runs on the last bar for performance; walk-forward recalibration is monthly, a Pine execution-time constraint.
█ WHAT IT IS NOT
• Not a directional forecast — the corridor is drift-neutral, centered on the anchor close.
• Not a joint path bound — confidence targets the close at each horizon separately; the chance of touching a band along the path is the separate No-Touch figure (see backtest).
• Not an option-pricing model — no implied volatility, greeks, or option-chain data.
• Not a guarantee — the backtest and PIT diagnostics are historical calibration evidence, not a promise of future coverage.
Full methodology, equations, and references are documented section by section in the source code. This is a research and educational tool, not investment advice.
אינדיקטור

אינדיקטור

אינדיקטור

Liquidity Sweep Retracements [MarkitTick]💡An advanced analytical framework designed to decode market micro-structure by evaluating the depth, speed, and statistical probability of price pullbacks. Rather than relying solely on static Fibonacci levels, this tool dynamically tracks the historical characteristics of an asset's swing behavior, alerting the user to structural anomalies and shifts in momentum. By intersecting retracement analysis with liquidity sweep detection and a built-in heatmap, this framework offers a comprehensive lens into market behavior, isolating environments where trend continuation is highly probable versus areas prone to exhaustion.
✨ Originality and Utility
Standard market analysis often relies on rigid tools that do not adapt to changing volatility conditions. This script introduces a highly original dynamic evaluation method by actively saving the characteristics of recent price swings into an internal array and establishing a moving statistical baseline.
The primary utility of this script lies in its multidimensional analysis. It does not just measure how far price has pulled back; it calculates how fast the pullback occurred and compares this velocity to the asset's recent historical baseline. This enables the framework to categorize price action not merely as a "pullback," but as a statistically significant "Anomaly" or an "Aggressive" move. Furthermore, by weaving Higher Timeframe (HTF) trend alignments and localized liquidity sweep detections into a single, cohesive dashboard and visual charting environment, it reduces chart clutter while exponentially increasing the depth of available data.
🔬 Methodology and Concepts
● Swing Structuring and Pivot Detection
The foundational logic relies on identifying structural pivot highs and lows through a localized lookback and look-forward window. The algorithm requires a definitive peak or trough isolated by user-defined left and right bars, establishing the anchor points for all subsequent mathematical measurements.
● Dynamic Retracement Scoring
Once a swing structure is confirmed, the script calculates the exact percentage of the retracement relative to the preceding impulse. These percentages are continuously categorized into defined behavioral zones:
Impulse (Less than 23%)
Shallow (Less than 38%)
Healthy (Up to 61.8%)
Deep (Up to 78.6%)
Reversal (Beyond 78.6%)
● Retracement Momentum Velocity (RMV)
Time and price are merged to extract velocity. By dividing the total percentage of the retracement by the number of bars it took to form, the script generates a velocity reading. This reading is dynamically compared against an array of historical velocities to determine if the current counter-trend move is unusually aggressive.
● Statistical Anomaly Detection
The script manages historical arrays of past retracement data, calculating a rolling mean (average) and standard deviation. An anomaly is triggered when a live retracement deviates significantly from this moving baseline, determined by a user-defined standard deviation multiplier. This mathematically highlights structural shifts before they mature into full trend reversals.
● Liquidity Sweep Verification
The indicator actively monitors price interactions with localized structural extremes. A bullish sweep occurs when price pierces a recent significant low but closes decisively above it, creating a structural trap. Bearish sweeps apply the inverse logic to structural highs.
🎨 Visual Guide
● Heatmap Candles
The script overrides standard candle colors with a dynamic heatmap that visually translates the health and speed of the current retracement:
Green indicates a healthy, standard retracement zone.
Orange highlights a weak zone, suggesting the trend is losing foundational strength.
Red warns of a deep structural violation bordering on a reversal.
Purple explicitly signifies an aggressive Retracement Momentum Velocity (RMV), warning of high counter-trend momentum.
● Price Action Overlays and Labels
Pivot Highs and Lows are marked precisely with small red and green crosses. (Note: These appear retroactively once the defined right-side bars confirm the pivot).
Data Labels are plotted at swing extremes. These carry a dark blue-gray background with dynamic text colors. They display the exact retracement percentage alongside quality badges, anomaly alerts (orange for opportunity, red for danger), and RMV warnings.
● Liquidity Markers
When a sweep is detected, small distinct shapes appear. "LS" text markers are plotted in bright green below bullish sweeps and bright red above bearish sweeps, visually anchoring liquidity traps directly onto the price action.
● The Analytical Dashboard
Located in the top right corner, this panel serves as the central intelligence hub. It utilizes shaded backgrounds to organize critical data natively on the chart.
Retracement and Health bars utilize block characters (█/░) to visualize strength out of 100%.
HTF Alignment displays the macro bias via clear text and color codes (Green for Bullish, Red for Bearish).
The dashboard aggregates averages, velocities, and quality metrics into a readable, high-contrast matrix.
📌 Note : the best way to resolve visual overlap is to navigate to the Object Tree and drag the indicator above the main chart layer, or simply hide the native candles in your chart settings.
📖 How to Use
Traders should monitor the dynamic relationship between the visual candle heatmap and the dashboard metrics.
Trend Continuation: Look for retracements that remain within the "Healthy" or "Shallow" zones (highlighted by green candles and positive dashboard health scores) that align with a bullish HTF signal.
Anomaly Exploitation: If an anomaly label appears marking a shallow retracement (orange text warning), this historically suggests an unusually strong impulse where standard deep pullbacks may not materialize.
Exhaustion Warnings: If the candles shift to purple, indicating an RMV Aggressive state, the counter-trend velocity is statistically high. Traders may use this to delay entries until momentum normalizes, or to identify structural traps if this aggression ends in a marked Liquidity Sweep (LS marker).
⚙️ Inputs and Settings
• Swing Settings
Controls the sensitivity of pivot detection. Higher values filter out market noise for major swing structures, while lower values react quickly to micro-trends.
• Retracement and Anomaly Parameters
Dictates the maximum number of historical retracements held in the memory array. The Standard Deviation Threshold allows users to expand or contract the mathematical boundary for what qualifies as an anomaly.
• RMV (Velocity) Limits
Controls the aggression threshold. Adjusting the multiplier determines how much faster a retracement must be compared to the historical average to trigger the purple heatmap and aggressive warnings.
• Liquidity Sweeps
Defines the lookback length for identifying local highs and lows that act as liquidity pools.
• Alerts and Dashboard Configuration
Enables fully customizable JSON-formatted alerts based on statistical deviations, and allows users to toggle or completely restyle the visual dashboard and heatmap components.
🔍 Deconstruction of the Underlying Scientific and Academic Framework
This indicator is heavily anchored in statistical mechanics and kinematics principles applied to financial time-series data.
• Gaussian Distribution and Variance
Instead of utilizing fixed geometric sequences (such as the Golden Ratio), the framework treats market swings as a dataset exhibiting normal distribution characteristics. By calculating the variance and extracting the standard deviation of historical swing depths, the script establishes mathematically sound confidence intervals. When price action breaches these standard deviation bands, it represents a statistically significant outlier, formally alerting the user to a fat-tail market event.
• Financial Kinematics
The integration of Retracement Momentum Velocity (RMV) introduces physics-based kinematic principles to price action. In traditional mechanics, velocity is the rate of change of position with respect to a frame of reference. The algorithm defines the frame of reference as the structural swing, calculating velocity as the percentage of displacement per unit of time (bars). By tracking the rolling average of this velocity, the script can algorithmically determine when kinetic energy in a counter-trend direction is statistically abnormal, independent of the actual price level reached.
⚠️ Disclaimer
All provided scripts and indicators are strictly for educational exploration and must not be interpreted as financial advice or a recommendation to execute trades. We expressly disclaim all liability for any financial losses or damages that may result, directly or indirectly, from the reliance on or application of these tools. Market participation carries inherent risk where past performance never guarantees future returns, leaving all investment decisions and due diligence solely at your own discretion. אינדיקטור