
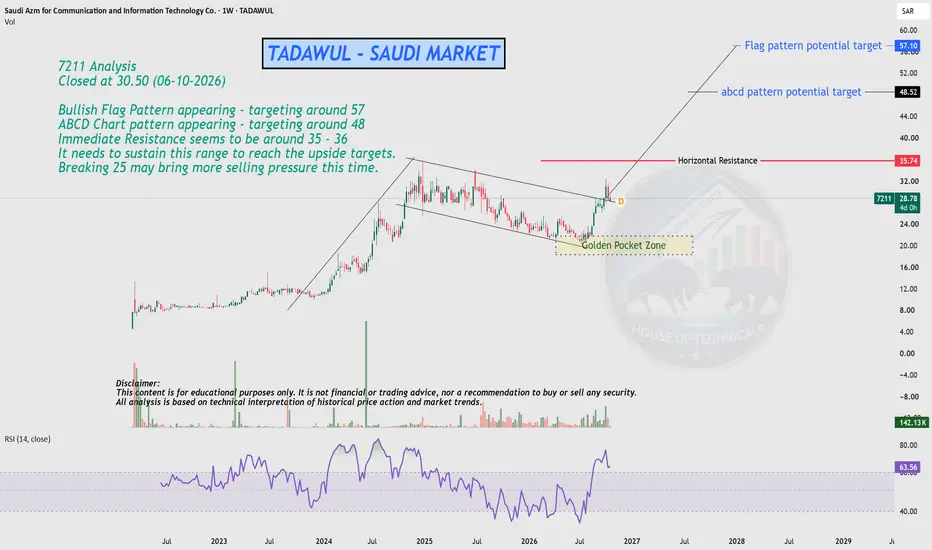
7211 Analysis
Closed at 30.50 (06-10-2026)
Bullish Flag Pattern appearing - targeting around 57
ABCD Chart pattern appearing - targeting around 48
Immediate Resistance seems to be around 35 - 36
It needs to sustain this range to reach the upside targets.
Breaking 25 may bring more selling pressure this time.
Closed at 30.50 (06-10-2026)
Bullish Flag Pattern appearing - targeting around 57
ABCD Chart pattern appearing - targeting around 48
Immediate Resistance seems to be around 35 - 36
It needs to sustain this range to reach the upside targets.
Breaking 25 may bring more selling pressure this time.

“I DON’T PREDICT. I PRE-READ THE CHARTS!”
TRUE TECHNICALS • PRICE ACTION • MARKET STRUCTURE
TRUE TECHNICALS • PRICE ACTION • MARKET STRUCTURE
Disclaimer
The information and publications are not meant to be, and do not constitute, financial, investment, trading, or other types of advice or recommendations supplied or endorsed by TradingView. Read more in the Terms of Use.
“I DON’T PREDICT. I PRE-READ THE CHARTS!”
TRUE TECHNICALS • PRICE ACTION • MARKET STRUCTURE
TRUE TECHNICALS • PRICE ACTION • MARKET STRUCTURE
Disclaimer
The information and publications are not meant to be, and do not constitute, financial, investment, trading, or other types of advice or recommendations supplied or endorsed by TradingView. Read more in the Terms of Use.