
1. The Macro Perspective: The Secular Ascending Channel
I am taking a LONG bias on Apple Inc. (AAPL) on the monthly (1M) timeframe.
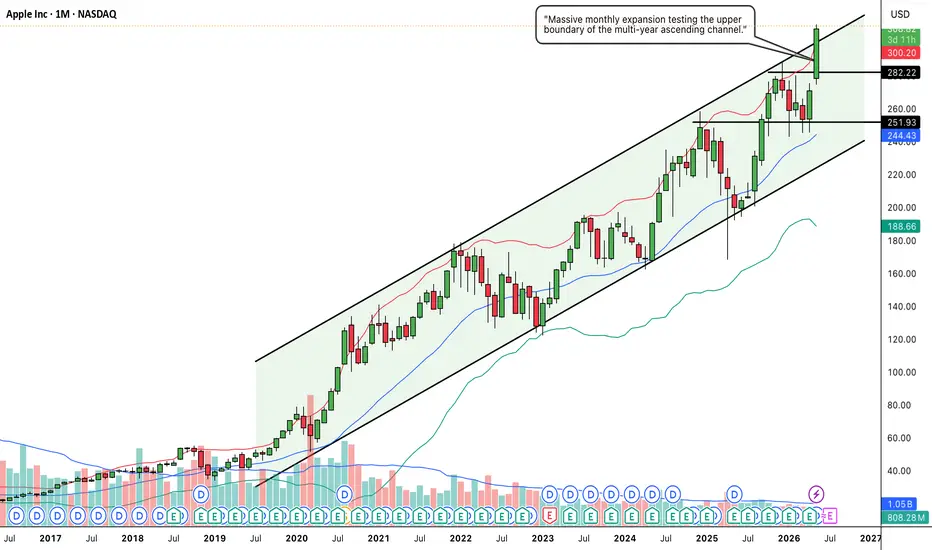
When analyzing pure market structure on a mega-cap tech leader, long-term trend channels dictate the primary narrative. Look at the structural development on this chart. Since the pandemic crash in early 2020, AAPL has been flawlessly respecting a massive ascending parallel channel. This channel acts as a mechanical roadmap: the lower boundary consistently serves as a deep-value accumulation floor, while the upper boundary acts as a profit-taking zone. Following the most recent test of the channel's lower support line in early 2026, institutional buyers aggressively stepped in, launching the stock back toward the top half of the structure. Fundamentally, this fierce momentum aligns perfectly with Apple's recent blockbuster Q2 2026 earnings report, where the company delivered $111.2 billion in revenue and announced a massive new $100 billion share repurchase authorization.
investing.com
2. The Educational Setup: Clearing Horizontal Resistance
To understand the technical validity behind this recent thrust, look at how the price interacted with key horizontal levels within the channel:
The 251.93 Support Base: During the mid-channel chop, sellers tried to push the price lower but repeatedly failed at the 251.93 structural support. This established a critical, unbreakable higher low.
The 282.22 Resistance Ceiling: The main obstacle preventing AAPL from reaching the channel top was the solid black horizontal resistance line drawn at 282.22. This marked a major historical pivot where supply previously capped rallies. By chopping tightly beneath this line while the moving averages caught up, the stock built the necessary kinetic energy for a major breakout.
3. Current Price Action: Volatility Expansion and Channel Top
Look at the most recent monthly candle on the far right of the chart. The structural pressure cooker has exploded. Buyers have seized absolute control, printing a massive, full-bodied green expansion candle that has decisively shattered the 282.22 resistance ceiling. The stock has surged to fresh highs near the 311.40 mark, driven by major positive catalysts such as the upcoming CEO transition to John Ternus and Apple's continued dominance in the premium consumption market. Furthermore, this aggressive move has pushed the price directly into the upper boundary of the macro ascending channel.
perplexity.ai
4. The Trade Plan: Entries, Targets, and Risk Management
Entry Strategy: Momentum is incredibly strong, but the stock is currently running directly into the upper resistance line of the multi-year channel. Buying blindly at the absolute top of a channel carries a severe risk of a mean-reversion pullback. The highest-probability, lowest-risk entry strategy involves stepping down to the weekly timeframe and waiting for a structural cooling-off period. Look to scale into long positions on a healthy pullback that perfectly retests the broken 275.00 to 285.00 zone. Letting the 282.22 historical resistance prove itself as a concrete new support floor offers a phenomenal risk-to-reward ratio.
Take Profit (Targets): If AAPL can establish the 282.22 level as support, the primary objective is a continued grind along the upper channel boundary, projecting a structural macro target zone of 340.00 to 350.00 over the coming quarters.
Invalidation (Stop Loss): The bullish continuation thesis is severely damaged if the price fails to hold the mid-channel support and collapses back below the breakout zone. A hard stop loss should be placed safely below the 251.93 swing low, around the 240.00 to 245.00 level. A definitive monthly close completely below 240.00 would act as a major warning sign of structural failure and a break of the macro channel.
5. Time Horizon:
Because this technical setup is engineered on a 1-Month chart capturing a secular channel and a major horizontal breakout, this is a longer-term position trade designed to capture sustained macro markup over the coming months and quarters. Let the mega-cap trend run!
I am taking a LONG bias on Apple Inc. (AAPL) on the monthly (1M) timeframe.
When analyzing pure market structure on a mega-cap tech leader, long-term trend channels dictate the primary narrative. Look at the structural development on this chart. Since the pandemic crash in early 2020, AAPL has been flawlessly respecting a massive ascending parallel channel. This channel acts as a mechanical roadmap: the lower boundary consistently serves as a deep-value accumulation floor, while the upper boundary acts as a profit-taking zone. Following the most recent test of the channel's lower support line in early 2026, institutional buyers aggressively stepped in, launching the stock back toward the top half of the structure. Fundamentally, this fierce momentum aligns perfectly with Apple's recent blockbuster Q2 2026 earnings report, where the company delivered $111.2 billion in revenue and announced a massive new $100 billion share repurchase authorization.
investing.com
2. The Educational Setup: Clearing Horizontal Resistance
To understand the technical validity behind this recent thrust, look at how the price interacted with key horizontal levels within the channel:
The 251.93 Support Base: During the mid-channel chop, sellers tried to push the price lower but repeatedly failed at the 251.93 structural support. This established a critical, unbreakable higher low.
The 282.22 Resistance Ceiling: The main obstacle preventing AAPL from reaching the channel top was the solid black horizontal resistance line drawn at 282.22. This marked a major historical pivot where supply previously capped rallies. By chopping tightly beneath this line while the moving averages caught up, the stock built the necessary kinetic energy for a major breakout.
3. Current Price Action: Volatility Expansion and Channel Top
Look at the most recent monthly candle on the far right of the chart. The structural pressure cooker has exploded. Buyers have seized absolute control, printing a massive, full-bodied green expansion candle that has decisively shattered the 282.22 resistance ceiling. The stock has surged to fresh highs near the 311.40 mark, driven by major positive catalysts such as the upcoming CEO transition to John Ternus and Apple's continued dominance in the premium consumption market. Furthermore, this aggressive move has pushed the price directly into the upper boundary of the macro ascending channel.
perplexity.ai
4. The Trade Plan: Entries, Targets, and Risk Management
Entry Strategy: Momentum is incredibly strong, but the stock is currently running directly into the upper resistance line of the multi-year channel. Buying blindly at the absolute top of a channel carries a severe risk of a mean-reversion pullback. The highest-probability, lowest-risk entry strategy involves stepping down to the weekly timeframe and waiting for a structural cooling-off period. Look to scale into long positions on a healthy pullback that perfectly retests the broken 275.00 to 285.00 zone. Letting the 282.22 historical resistance prove itself as a concrete new support floor offers a phenomenal risk-to-reward ratio.
Take Profit (Targets): If AAPL can establish the 282.22 level as support, the primary objective is a continued grind along the upper channel boundary, projecting a structural macro target zone of 340.00 to 350.00 over the coming quarters.
Invalidation (Stop Loss): The bullish continuation thesis is severely damaged if the price fails to hold the mid-channel support and collapses back below the breakout zone. A hard stop loss should be placed safely below the 251.93 swing low, around the 240.00 to 245.00 level. A definitive monthly close completely below 240.00 would act as a major warning sign of structural failure and a break of the macro channel.
5. Time Horizon:
Because this technical setup is engineered on a 1-Month chart capturing a secular channel and a major horizontal breakout, this is a longer-term position trade designed to capture sustained macro markup over the coming months and quarters. Let the mega-cap trend run!
Trade active
Target already achievedTrade closed: target reached
Target already achieved.
Disclaimer
The information and publications are not meant to be, and do not constitute, financial, investment, trading, or other types of advice or recommendations supplied or endorsed by TradingView. Read more in the Terms of Use.
Disclaimer
The information and publications are not meant to be, and do not constitute, financial, investment, trading, or other types of advice or recommendations supplied or endorsed by TradingView. Read more in the Terms of Use.