
________________________________________
📊 ABB India: Daily Technical Snapshot – Symmetrical Triangle Consolidation
📊 STWP Technical Analysis
________________________________________
MARKET STRUCTURE SNAPSHOT | NSE: ABB
Closing Price: ₹7,204.50 (+₹312.50 | +4.53%)
Core Trend: Long-Term Uptrend
Market State: Consolidation Within Uptrend
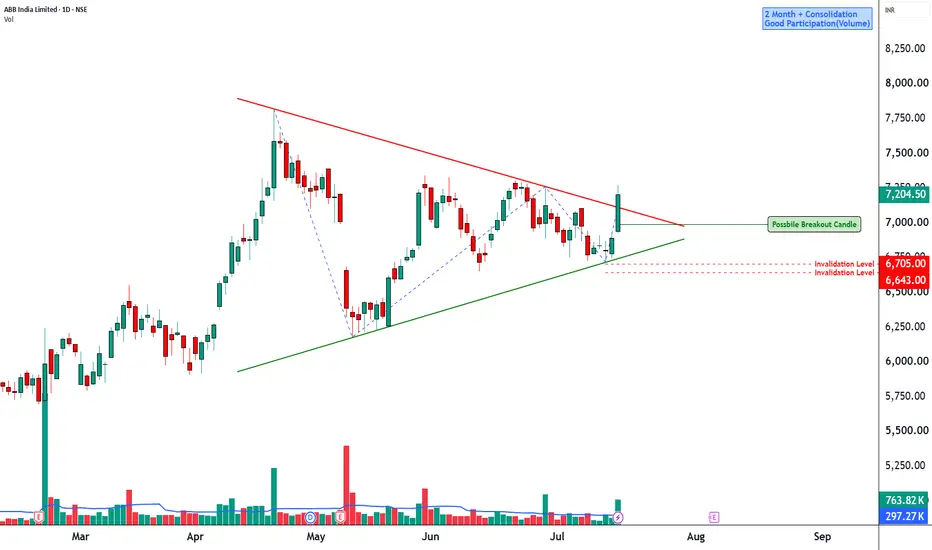
Price Structure: Price is consolidating inside a Symmetrical Triangle, reflecting a period of compression following the previous rally. The structure suggests that buyers and sellers are reaching equilibrium, with a breakout likely to determine the next directional move.
________________________________________
OPERATIONAL PRICE GRID & KEY REFERENCE LEVELS
Model Reference Level: ₹7,270.00
Hard Invalidation Level: ₹6,643.20
Structural Risk: ₹626.80 (8.62%)
Resistance Levels: R1 ₹7,340.83 | R2 ₹7,477.17 | R3 ₹7,684.33
Support Levels: S1 ₹6,997.33 | S2 ₹6,790.17 | S3 ₹6,653.83
Range Structure: Low ₹6,643.20 | High ₹7,684.33
Higher Timeframe Observation Zones: ₹7,477 | ₹7,684 | ₹8,000
________________________________________
MOMENTUM, PARTICIPATION & CPR DATA
Volume Profile: 763.82K Shares
Volume Character: Strong Relative Participation
RSI: 58.93 (Positive Momentum Zone)
ADX: 11.75 (Low Trend Strength – Compression Phase)
ROC: +3.86%
MACD Status: Momentum Improving
CCI: +68.25 (Positive Momentum)
Stochastic Reading: 88.19 (Strong Momentum Zone)
Current Bias: WAIT FOR BREAKOUT CONFIRMATION
CPR State: Bullish Zone | CPR Moving Up (Wide)
Today's CPR: Pivot ₹6,852.00 | Top ₹6,872.00 | Base ₹6,832.00
Tomorrow's CPR (Projected): Pivot ₹7,133.65 | Top ₹7,169.10 | Base ₹7,098.25
________________________________________
📚 EDUCATIONAL OBSERVATION
ABB India continues to consolidate within a Symmetrical Triangle, a chart pattern that commonly develops after a strong directional move as the market enters a temporary period of balance between buyers and sellers. The series of lower highs and higher lows reflects gradually narrowing price swings, often preceding a volatility expansion.
The stock remains within its broader uptrend despite the ongoing consolidation. Rather than signalling weakness, the current structure appears to represent a pause following the previous advance. Such consolidation phases frequently allow momentum indicators to cool before the next significant move develops.
Momentum indicators remain constructive despite the consolidation. The RSI at 58.93 remains comfortably above the neutral zone, suggesting buyers continue to hold an advantage. ROC at +3.86% reflects positive price momentum, while CCI at +68.25 remains in bullish territory. MACD is stabilising after the previous correction, indicating improving momentum. Meanwhile, ADX at 11.75 confirms the market is currently in a low-trend environment, which is typical during triangle formations before a decisive breakout.
The projected Central Pivot Range (CPR) for the next trading session has shifted higher, with the projected Pivot at ₹7,133.65. A rising and widening CPR generally reflects improving acceptance of higher prices and provides a supportive backdrop should a breakout emerge.
The immediate technical focus remains on the upper boundary of the Symmetrical Triangle, which coincides with the resistance zone between ₹7,340 and ₹7,477. A decisive close above this region, supported by stronger-than-average trading volume, would confirm the continuation breakout and strengthen the probability of a move towards ₹7,684 and potentially the psychological ₹8,000 level. Conversely, failure to hold the lower trendline could shift attention towards the support levels near ₹6,997 and ₹6,790.
________________________________________
🏢 BUSINESS OVERVIEW
ABB India is a leading provider of electrification, industrial automation, robotics and motion technologies. The company benefits from India's ongoing investment in manufacturing, infrastructure, renewable energy, data centres and industrial automation. Rising capital expenditure across these sectors continues to support long-term demand for ABB India's products and engineering solutions.
________________________________________
📖 Educational Note
Support and resistance levels should be treated as observation zones rather than predictive targets. Chart patterns, price action, volume analysis, momentum indicators and CPR are educational tools that help market participants understand evolving market structure within a disciplined risk-management framework.
________________________________________
⚠️ Disclaimer
This analysis is provided strictly for educational and informational purposes.
It does not constitute financial, investment or trading advice and should not be interpreted as a recommendation to buy or sell any security.
Stock market investments are subject to market risks, including the possible loss of capital.
Historical performance, chart patterns and technical indicators do not guarantee future results.
Please conduct your own research and consult a SEBI-registered investment adviser before making investment decisions.
STWP assumes no responsibility or liability for any financial loss arising directly or indirectly from the use of this analysis.
📊 ABB India: Daily Technical Snapshot – Symmetrical Triangle Consolidation
📊 STWP Technical Analysis
________________________________________
MARKET STRUCTURE SNAPSHOT | NSE: ABB
Closing Price: ₹7,204.50 (+₹312.50 | +4.53%)
Core Trend: Long-Term Uptrend
Market State: Consolidation Within Uptrend
Price Structure: Price is consolidating inside a Symmetrical Triangle, reflecting a period of compression following the previous rally. The structure suggests that buyers and sellers are reaching equilibrium, with a breakout likely to determine the next directional move.
________________________________________
OPERATIONAL PRICE GRID & KEY REFERENCE LEVELS
Model Reference Level: ₹7,270.00
Hard Invalidation Level: ₹6,643.20
Structural Risk: ₹626.80 (8.62%)
Resistance Levels: R1 ₹7,340.83 | R2 ₹7,477.17 | R3 ₹7,684.33
Support Levels: S1 ₹6,997.33 | S2 ₹6,790.17 | S3 ₹6,653.83
Range Structure: Low ₹6,643.20 | High ₹7,684.33
Higher Timeframe Observation Zones: ₹7,477 | ₹7,684 | ₹8,000
________________________________________
MOMENTUM, PARTICIPATION & CPR DATA
Volume Profile: 763.82K Shares
Volume Character: Strong Relative Participation
RSI: 58.93 (Positive Momentum Zone)
ADX: 11.75 (Low Trend Strength – Compression Phase)
ROC: +3.86%
MACD Status: Momentum Improving
CCI: +68.25 (Positive Momentum)
Stochastic Reading: 88.19 (Strong Momentum Zone)
Current Bias: WAIT FOR BREAKOUT CONFIRMATION
CPR State: Bullish Zone | CPR Moving Up (Wide)
Today's CPR: Pivot ₹6,852.00 | Top ₹6,872.00 | Base ₹6,832.00
Tomorrow's CPR (Projected): Pivot ₹7,133.65 | Top ₹7,169.10 | Base ₹7,098.25
________________________________________
📚 EDUCATIONAL OBSERVATION
ABB India continues to consolidate within a Symmetrical Triangle, a chart pattern that commonly develops after a strong directional move as the market enters a temporary period of balance between buyers and sellers. The series of lower highs and higher lows reflects gradually narrowing price swings, often preceding a volatility expansion.
The stock remains within its broader uptrend despite the ongoing consolidation. Rather than signalling weakness, the current structure appears to represent a pause following the previous advance. Such consolidation phases frequently allow momentum indicators to cool before the next significant move develops.
Momentum indicators remain constructive despite the consolidation. The RSI at 58.93 remains comfortably above the neutral zone, suggesting buyers continue to hold an advantage. ROC at +3.86% reflects positive price momentum, while CCI at +68.25 remains in bullish territory. MACD is stabilising after the previous correction, indicating improving momentum. Meanwhile, ADX at 11.75 confirms the market is currently in a low-trend environment, which is typical during triangle formations before a decisive breakout.
The projected Central Pivot Range (CPR) for the next trading session has shifted higher, with the projected Pivot at ₹7,133.65. A rising and widening CPR generally reflects improving acceptance of higher prices and provides a supportive backdrop should a breakout emerge.
The immediate technical focus remains on the upper boundary of the Symmetrical Triangle, which coincides with the resistance zone between ₹7,340 and ₹7,477. A decisive close above this region, supported by stronger-than-average trading volume, would confirm the continuation breakout and strengthen the probability of a move towards ₹7,684 and potentially the psychological ₹8,000 level. Conversely, failure to hold the lower trendline could shift attention towards the support levels near ₹6,997 and ₹6,790.
________________________________________
🏢 BUSINESS OVERVIEW
ABB India is a leading provider of electrification, industrial automation, robotics and motion technologies. The company benefits from India's ongoing investment in manufacturing, infrastructure, renewable energy, data centres and industrial automation. Rising capital expenditure across these sectors continues to support long-term demand for ABB India's products and engineering solutions.
________________________________________
📖 Educational Note
Support and resistance levels should be treated as observation zones rather than predictive targets. Chart patterns, price action, volume analysis, momentum indicators and CPR are educational tools that help market participants understand evolving market structure within a disciplined risk-management framework.
________________________________________
⚠️ Disclaimer
This analysis is provided strictly for educational and informational purposes.
It does not constitute financial, investment or trading advice and should not be interpreted as a recommendation to buy or sell any security.
Stock market investments are subject to market risks, including the possible loss of capital.
Historical performance, chart patterns and technical indicators do not guarantee future results.
Please conduct your own research and consult a SEBI-registered investment adviser before making investment decisions.
STWP assumes no responsibility or liability for any financial loss arising directly or indirectly from the use of this analysis.

STWP | Mentor & Demand-Supply Specialist |
Empowering traders through structured learning |
simpletradewithpatience.com
Community: chat.whatsapp.com/BEYz0tkqP0fJPBCWf59uel
wa.me/message/6IOPHGOXMGZ4N1
Educational Only
Empowering traders through structured learning |
simpletradewithpatience.com
Community: chat.whatsapp.com/BEYz0tkqP0fJPBCWf59uel
wa.me/message/6IOPHGOXMGZ4N1
Educational Only
Disclaimer
The information and publications are not meant to be, and do not constitute, financial, investment, trading, or other types of advice or recommendations supplied or endorsed by TradingView. Read more in the Terms of Use.
STWP | Mentor & Demand-Supply Specialist |
Empowering traders through structured learning |
simpletradewithpatience.com
Community: chat.whatsapp.com/BEYz0tkqP0fJPBCWf59uel
wa.me/message/6IOPHGOXMGZ4N1
Educational Only
Empowering traders through structured learning |
simpletradewithpatience.com
Community: chat.whatsapp.com/BEYz0tkqP0fJPBCWf59uel
wa.me/message/6IOPHGOXMGZ4N1
Educational Only
Disclaimer
The information and publications are not meant to be, and do not constitute, financial, investment, trading, or other types of advice or recommendations supplied or endorsed by TradingView. Read more in the Terms of Use.