
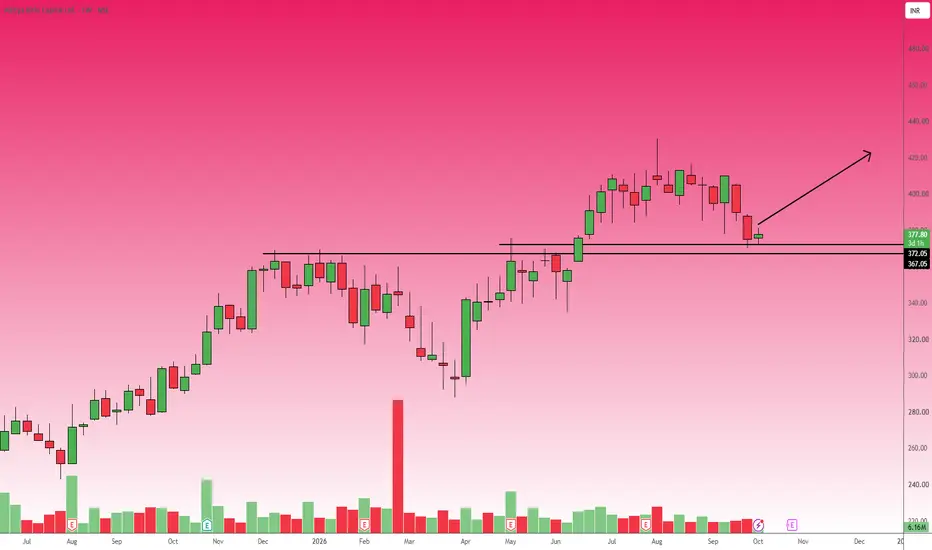
The weekly chart of Aditya Birla Capital Ltd. indicates a classic breakout and retest technical setup.
After a strong uptrend, the stock has experienced a pullback and is currently resting at a critical demand zone.
The horizontal black lines marked on the chart highlight a previous resistance area between 367.05 and 372.05, which is now acting as strong support based on the principle of polarity.
The current weekly candle shows the price stabilizing near 377.15, right above this key structural support.
If this zone holds, it provides a favorable risk-to-reward ratio for a trend continuation trade.
Entry Point: Accumulate near the current market price of 377.15, or on minor dips into the 372.05 support area.
Target: The primary target is a retest of the recent swing highs near the 420.00 level, followed by potential price discovery above the previous peak.
Stop Loss: A strict stop loss should be maintained on a weekly close below the lower support band of 367.05 to invalidate the bullish retest thesis.
After a strong uptrend, the stock has experienced a pullback and is currently resting at a critical demand zone.
The horizontal black lines marked on the chart highlight a previous resistance area between 367.05 and 372.05, which is now acting as strong support based on the principle of polarity.
The current weekly candle shows the price stabilizing near 377.15, right above this key structural support.
If this zone holds, it provides a favorable risk-to-reward ratio for a trend continuation trade.
Entry Point: Accumulate near the current market price of 377.15, or on minor dips into the 372.05 support area.
Target: The primary target is a retest of the recent swing highs near the 420.00 level, followed by potential price discovery above the previous peak.
Stop Loss: A strict stop loss should be maintained on a weekly close below the lower support band of 367.05 to invalidate the bullish retest thesis.
Trade closed: stop reached
Stoploss hit...
Disclaimer
The information and publications are not meant to be, and do not constitute, financial, investment, trading, or other types of advice or recommendations supplied or endorsed by TradingView. Read more in the Terms of Use.
Disclaimer
The information and publications are not meant to be, and do not constitute, financial, investment, trading, or other types of advice or recommendations supplied or endorsed by TradingView. Read more in the Terms of Use.