
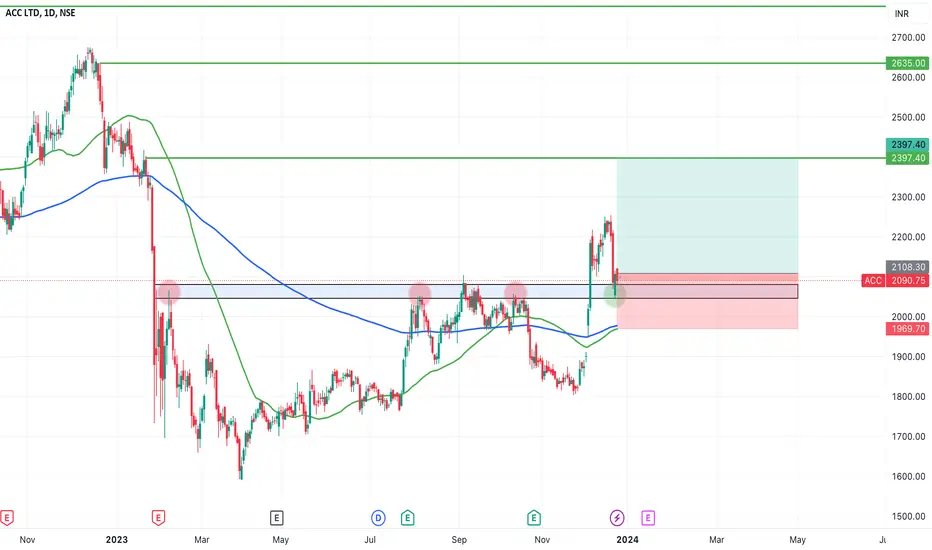
ACC has recently emerged as a focal point of interest, presenting a promising buying opportunity when analyzed through the lens of technical indicators.
Reasons are listed below :
Target - 2397 // 2635 // 2777
StopLoss - Daily close below 1970
Reasons are listed below :
- The 2080 levels underwent multiple tests before the price eventually broke through. Currently, the price is in the process of retesting those levels.
- A bullish marubozu candle is formed on daily timeframe.
- 0.382 Fibonacci support.
- Broke strong consolidation of 308 days.
- The stock price is above 50EMA and 200EMA i.e the trend is intact.
Target - 2397 // 2635 // 2777
StopLoss - Daily close below 1970
Note
Price is 6.5% up from buying.the momentum seems steady.
HOLD !
Note
we got a daily close above the recent swing.we are 7.6% up from buying.
HOLD!
Trade closed: target reached
1ST TARGET ACHIEVED !!12.7% DONE
Trade closed: target reached
2nd target achieved - 30%+Note
We can add some quantity (reason : 'W' pattern near crucial support - 2400)Note
Price is breaking out again, hope you all added quantity (as mentioned on 27th march)Note
made a new swing high : 31%+, we are very close to our 3rd targetTrade closed: target reached
3rd target achieved : 34%++
Disclaimer
The information and publications are not meant to be, and do not constitute, financial, investment, trading, or other types of advice or recommendations supplied or endorsed by TradingView. Read more in the Terms of Use.
Disclaimer
The information and publications are not meant to be, and do not constitute, financial, investment, trading, or other types of advice or recommendations supplied or endorsed by TradingView. Read more in the Terms of Use.