
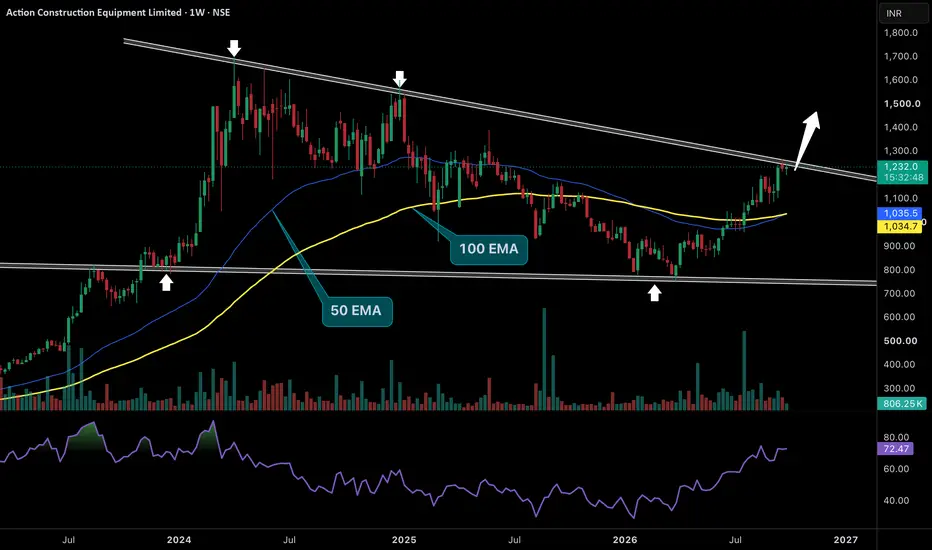
Stock is reaching a very important point on the weekly chart. The stock has been trading below this falling trendline since the 2024 highs and every major attempt near it was rejected. But the structure has changed significantly after the strong reversal from the 750–800 support zone. Price has reclaimed both the 50 and 100 EMA around 1035 and buyers have pushed it back towards the long-term trendline with very strong momentum.
Now price is trying to break the 1220–1250 trendline zone. A clean breakout and sustain above it can confirm that the long correction phase is finally over. RSI above 70 shows how strong the current momentum has become and once this resistance is cleared liquidity above the previous swing highs can attract another wave of buying. If the breakout holds this structure can quickly shift into an expansion phase with 1400+ coming back into focus first.
Now price is trying to break the 1220–1250 trendline zone. A clean breakout and sustain above it can confirm that the long correction phase is finally over. RSI above 70 shows how strong the current momentum has become and once this resistance is cleared liquidity above the previous swing highs can attract another wave of buying. If the breakout holds this structure can quickly shift into an expansion phase with 1400+ coming back into focus first.

📌 Join Trading Community 👇
Telegram : 👉telegram.me/chartifyy
Instagram: 👉 instagram.com/chartifyig?igsi=Y2ZiODZtczZ2aDA=&utm_source=qr
Telegram : 👉telegram.me/chartifyy
Instagram: 👉 instagram.com/chartifyig?igsi=Y2ZiODZtczZ2aDA=&utm_source=qr
Disclaimer
The information and publications are not meant to be, and do not constitute, financial, investment, trading, or other types of advice or recommendations supplied or endorsed by TradingView. Read more in the Terms of Use.
📌 Join Trading Community 👇
Telegram : 👉telegram.me/chartifyy
Instagram: 👉 instagram.com/chartifyig?igsi=Y2ZiODZtczZ2aDA=&utm_source=qr
Telegram : 👉telegram.me/chartifyy
Instagram: 👉 instagram.com/chartifyig?igsi=Y2ZiODZtczZ2aDA=&utm_source=qr
Disclaimer
The information and publications are not meant to be, and do not constitute, financial, investment, trading, or other types of advice or recommendations supplied or endorsed by TradingView. Read more in the Terms of Use.